Gretchen Kupferschmid-Looking Outwards-07

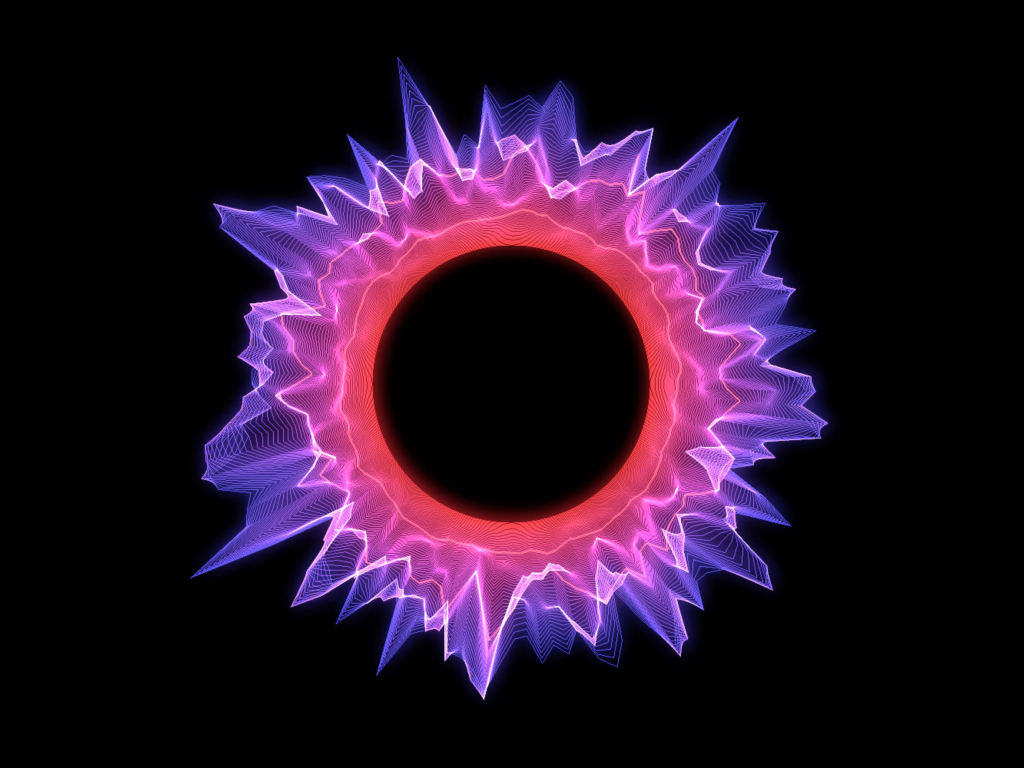
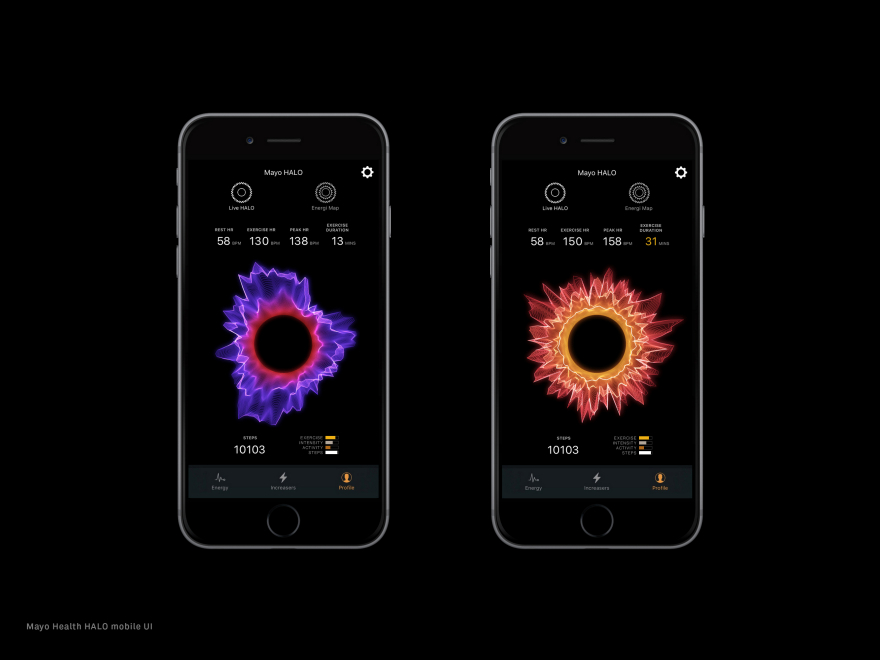
an example of a data visualization generated by Halo representing various data

Created by Ora Systems, the project “Halo” is a visualization platform that can combine up to ten different data sets into a fluid multi-dimensional band of light. Ora currently works to develop “halo”s that represent patient’s health status, working with health companies such as Mayo Clinic to enhance the way we look at the health data of patients by creating responsive wearable-driven health identities through an app. Through familiarizing yourself with the visualization, the user should be able to easily understand and compare vast data sets. I appreciate the way this project combines both a creative and artistic approach to the output of the visualization with a technical advancement in its combination of so many different data inputs/sets. I also appreciate that this project can be used to solve problems through its design and not just be a visual.
reated by Ora Systems, the project “Halo” is a visualization platform that can combine up to ten different data sets into a fluid multi-dimensional band of light. Ora currently works to develop “halo”s that represent patient’s health status, working with health companies such as Mayo Clinic to enhance the way we look at the health data of patients by creating responsive wearable-driven health identities through an app. Through familiarizing yourself with the visualization, the user should be able to easily understand and compare vast data sets. I appreciate the way this project combines both a creative and artistic approach to the output of the visualization with a technical advancement in its combination of so many different data inputs/sets. I also appreciate that this project can be used to solve problems through its design and not just be a visual.

Gretchen Kupferschmid-Project 07- Curves

sketch

//Gretchen Kupferschmid
//Section E
//gkupfers@andrew.cmu.edu
//Project-07-Curves

function setup() {
    createCanvas(480,480);
}
 function draw (){
    //gradient picking color
    var gradient1 = color(255, 238, 87); 
    var gradient2 = color(247, 119, 179); 
    createGradient(gradient1, gradient2);
    
    push();
    //moves all objects to center of canvas
    translate(width/2, height/2);
    //rotates shapes with movement of mouse X value from values 0 to pi
    rotate (map(mouseX, 0, width, 0, 10));
    circlePedal();
    deltoidCata();
    hypotrochoid();
    pop();
 }

function deltoidCata(){
    //mapping colors to mouse
    colorR = map(mouseX, 0, width, 200, 255);
    colorB = map(mouseY, 0, height, 200, 255);
    
    //mapping factor of deltoid to mouse
    g = map(mouseX, 0, width, 0, 100);
    g = map(mouseY, 0, height, 25, 50);
    
    //stroke & fill
    strokeWeight(5);
    fill(colorR, 250, colorB);
    stroke(0);
    

    // creating deltoid catacaustic
    beginShape();
    for (var i = 0; i < 200; i ++) {
        
        var angle = map(i, 0, 200, 0, 2*(TWO_PI));
        //formula for deltoid catacaustic
        x= ((2 *(cos(angle))) + (cos(2*angle)))*g ;
        y= ((2 *(sin(angle))) - (sin(2*angle)))*g ;
        vertex(x,y);
    }
    endShape();
}

function circlePedal(){
    //mapping colors to mouse X & Y
    colorR = map(mouseX, 0, width, 80, 200);
    colorG = map(mouseX, 0, width, 0, 50);
    colorB = map(mouseY, 0, height, 70, 170);
    
    //mapping factor multiplied by to mouse X & Y
    t = map(mouseX, 0, width, 150, 250);
    t = map(mouseY, 0, height, 130, 200);
    
    //stroke & fill
    strokeWeight(2);
    fill(colorR, colorG, colorB);
    stroke(255);
    
    //creating circle pedal
    for (var i = 0; i < 500; i ++) {
        
        var angle = map(i, 0, 500, 0, 2*(TWO_PI));
        //formula for circle pedal
        var x1 = cos(angle);
        var y1 = sin(angle);
        var x2 = t *((cos(angle)) -( y1 * cos(angle) * sin(angle)) + (x1 * pow(sin(angle),2))); 
        var y2 = (.5* (y1 + (y1 * cos(2*angle))+ (2*sin(angle))- (x1 * sin(2*angle)))) * t;
        vertex(x2,y2);
    }
    endShape();
     
}

function hypotrochoid(){
    //mapping size of hypotrochoid to mouse
    a = map(mouseX, 0, width, 200, 350);
    b = map(mouseY, 0, height, 100, 200);
    h = map(mouseY, 0, height, 2, 105);
    
    //stroke & fill
    strokeWeight(2);
    noFill();
    stroke(255);

    // creating hypotrochoid
    beginShape();
    for (var i = 0; i < 500; i ++) {
        // hypotrochoid formula
        angle = map(i, 0, 500, 0, TWO_PI);
        var x = (a - b) * cos(angle) + h * cos((a - b) / b * i);
        var y = (a - b) * sin(angle) + h * sin((a - b) / b * i);
        vertex(x, y);
    }
    endShape();
}

//function gradient 
function createGradient(top, bottom) {
    for(var i = 0; i <= height; i++) {
      var mapColor = map(i, 0, height, 0, 1);
      var interA = lerpColor(top, bottom, mapColor);
      stroke(interA);
      line(0, i, width, i);
    }
}

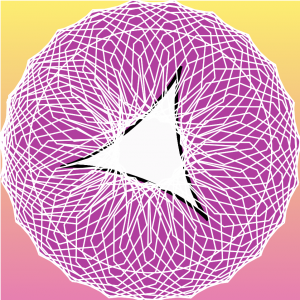
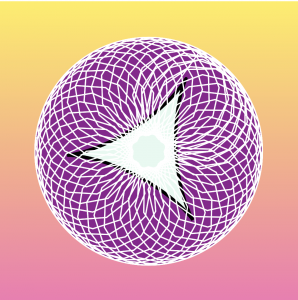
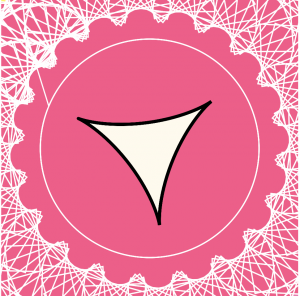
I started the project with just creating the deltoid curve and the circle pedal curve, but realized that just them two together weren’t creating a very interesting composition even though the formulas to create them were pretty complex. Even with altering numbers, mapping values, and angle amounts, I still wasn’t getting anything particularly interesting or complex looking. So, I decided to add a more circular and dynamic curve of the hypotrochoid, which can be altered by various radii values and its repeating structure.

Gretchen Kupferschmid-Project 06-Abstract Clock

sketch

//Gretchen Kupferschmid

function setup() {
    createCanvas(480,480);
    
}
 function draw (){
    
    //gradient picking color
    var gradient1 = color(223, 202, 252); 
    var gradient2 = color(202, 252, 238); 
    createGradient(gradient1, gradient2); 

    //creating time veriaples 
    var h = hour();
    var m = minute();
    var s = second();
    
    //mapping time variables
    var dripsS = map(s, 0, 59, 200, height);
    var colorLemon = map(m, 0, 59, 0, 30);
    var highLight = map(h, 0, 23, 110, 240);
    
     
    //lemon shadow
    noStroke();
    fill(211,180,117);
    ellipse(235,274,124,33);
     
    //changing color of lemon with minutes
    var Yellow= color(244-colorLemon,216-colorLemon, 100-colorLemon);
    fill(Yellow);
    noStroke();
    ellipse(211,181,161,208);
    ellipse(289,182,28,19);
     

    //drawing lemon interior
    noStroke();
    fill(247,234,181);
    ellipse(182,185,107,208);
    strokeWeight(2);
    stroke(196,141,32);
    fill(244,226,149);
    ellipse(182,185,73,178);
    strokeWeight(1);
    line(181,95,181,274);
    line(209,126,153,240);
    line(145.5,185,218,173);
    line(153.3,130,213.3,229.3);
    
    //lemon highlight every hour
    noStroke();
    fill(255);
    ellipse(193,highLight,8,18);
     
    //drip goes down every second
    fill(247,223,119);
    ellipse(170, dripsS, 10.5, 31);
    
    //text of time
    fill(255);
    text(h+":"+m+":"+s,350,50);
 
    
 }

 //background 
function createGradient(top, bottom) {
    for(var i = 0; i <= height; i++) {
      var mapColor = map(i, 0, height, 0, 1);
      var interA = lerpColor(top, bottom, mapColor);
      stroke(interA);
      line(0, i, width, i);
    }
}

As I tried to decide what form to make my clock, I based it heavily on my love for simple graphic elements such as lemons and the simplicity that comes from them. I wanted to also try various techniques for showing the time in the illustration itself from the drip of the lemon, to the hue of the actual lemon itself. It was important to me to show time in subtle ways that didn’t take away from the illustration but added to it in a form of animation.

Gretchen Kupferschmid-Looking Outward-06

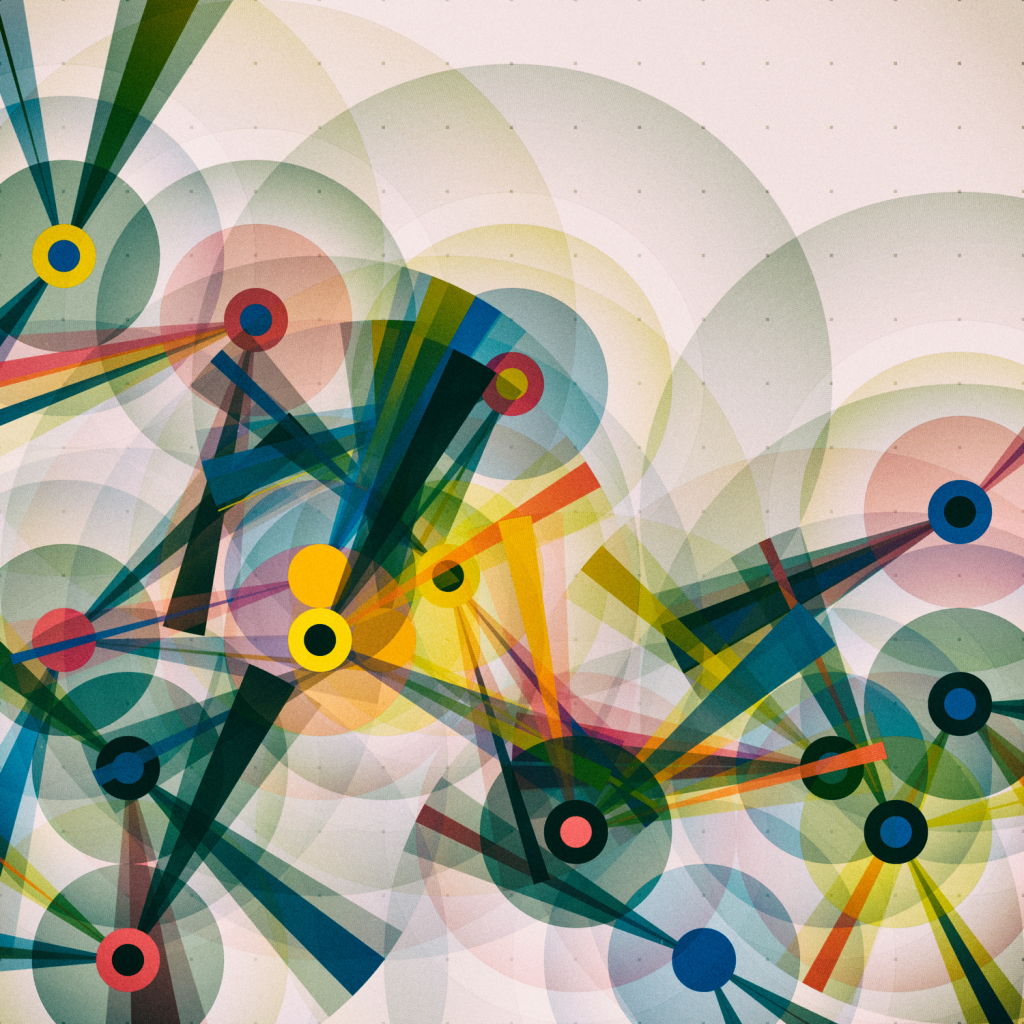
Artist Manolo Gamboa Naon from Argentina creates art from the randomness of computational algorithm he creates. His art looks very intentional and involves lots of hard shapes and geometry, yet the idea of randomness is very fluid, so its interesting to see these two styles intersecting. I enjoy how the art itself is very reminiscent of mid-century art and feels as it could fit right in place with the 60s style art that relied so heavily on paint and traditional materials. His abstract and random work is grounded through shapes and color. By using just a circle and triangle, Naon is able create a piece of art by color changing and object placement.

https://www.artnome.com/news/2018/8/8/generative-art-finds-its-prodigy

Gretchen Kupferschmid-Project 05- Wallpaper

sketch

var x;
var y;

function setup() {
    createCanvas(480,480);
}
 function draw (){
    background(247, 173, 209);
    drawGrid();
 }
 function drawGrid(){
     //create tile through looping x and y values no more than height and width of canvas
     for (y= -6; y<height; y+=94){
         for(x=-6; x<width ; x+=94){
             //translate the grid to the new x/y position each loop
             push();
             translate(x,y);
             drawShadowPink();
             drawWhites();
             drawShadowEgg();
             drawYolk();
             pop();
         }
     }
 }
//create egg white shape
function drawWhites(){
    fill(255);
    strokeWeight(3);
    beginShape();
    curveVertex(41.77, 38.02);
    curveVertex(82.95, 38.2);
    curveVertex(96.47, 39.8);
    curveVertex(101.98, 41.56);
    curveVertex(103.88, 46.61);
    curveVertex(97.46, 51.37);
    curveVertex(96.27, 59.94);
    curveVertex(92.47, 67.03);
    curveVertex(88.92, 66.25);
    curveVertex(72.82, 68.51);
    curveVertex(55.28, 73.71);
    curveVertex(47, 71.42);
    curveVertex(42.5, 67.12);
    curveVertex(40.78, 63.32);
    curveVertex(21.58, 53.57);
    curveVertex(20.22, 51.85);
    curveVertex(24.11, 47.02);
    curveVertex(30.22, 44.07);
    curveVertex(31.38, 41.25);
    curveVertex(35.3, 38.36);
    curveVertex(41.93, 38.2);
    curveVertex(41.77, 38.02); 
    endShape();
}
//create yolk shape
function drawYolk(){
    fill(250, 212, 25);
    strokeWeight(1);
    beginShape();
    curveVertex(41.38, 41.62);
    curveVertex(47.15, 28.01);
    curveVertex(57.11, 23.11);
    curveVertex(68.59, 23.89);
    curveVertex(79.61, 31.47);
    curveVertex(82.02, 35.39);
    curveVertex(82.61, 40.38);
    curveVertex(71.89, 47.39);
    curveVertex(57.46, 48.21);
    curveVertex(41.38, 41.62);
    curveVertex(47.15, 28.01);
    curveVertex(57.11, 23.11);
    endShape();
}
//shadow underneath whites
function drawShadowPink(){
    fill(224, 112, 168);
    strokeWeight(0);
    ellipse(66.77, 60.15, 82.86, 37.3);
}
//shadow underneath egg yolk
function drawShadowEgg(){
    fill(219, 150, 0);
    strokeWeight(0);
    ellipse(65.05, 43.14, 47.3, 18.7);
}

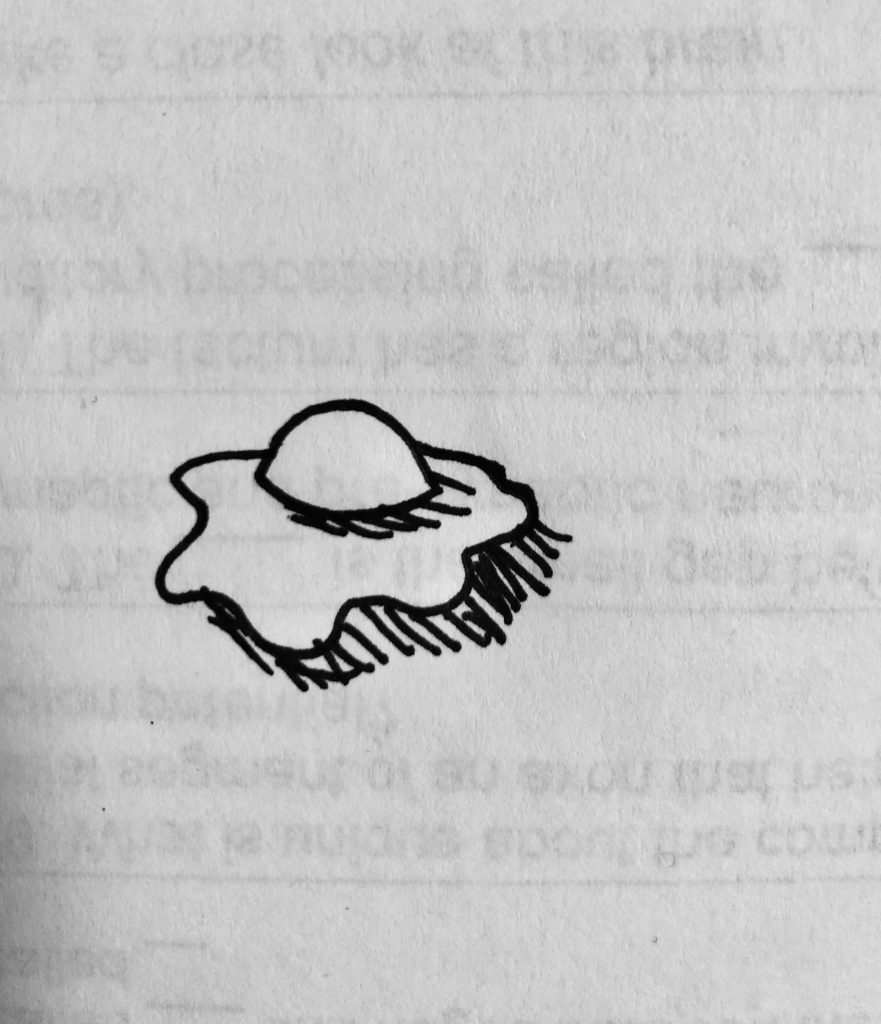
I used the pattern of an egg, which is a little doodle/drawing I constantly draw. I even named my website eggontoast.store because of the eggs I draw

I used this simple egg drawing and added some shadows to give it dimension and a more interesting factor.

Gretchen Kupferschmid-Looking Outward-05

https://timrodenbroeker.de/projects/redrawing-images/

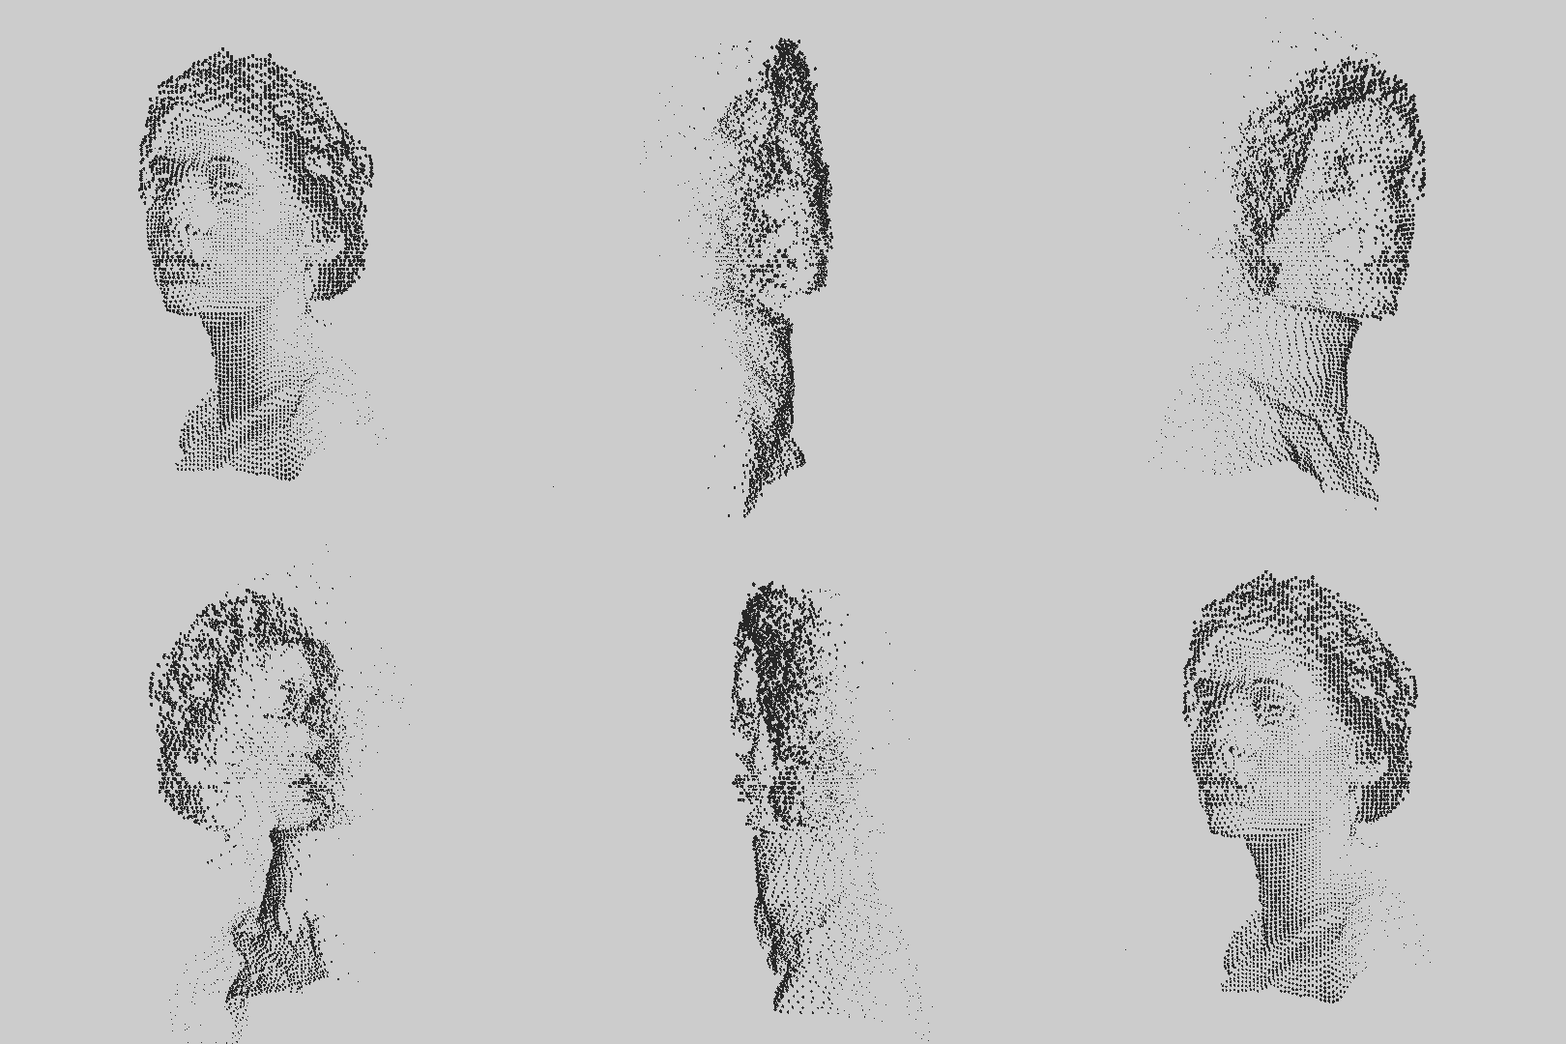
A series of 3d generative portraits were created by artist Tim Rodenbroeker in which he utilizes portraits taken by photographer Ivana Marija Hope to create digital artwork and animation of the portraits. The size and z-position of each object is based on the brightness values of images files. I love the fact that this artwork is heavily based on the portrait style of the 1900s, yet is so contemporary in its generative and coding based digital aspect. Rodenbroeker’s work is based heavily on using open-source technology like Processing and even p5js. He also creates this images by combining the algorithm and code he creates with lots of research and experimentation.

Though the art is based off of photography art that had already been created, Rodenbroeker manages to create new artwork that celebrates the new computational style that computers allow us to create and to combine it with the human form.

Gretchen Kupferschmid-String Art-Project 04


with this project, I wanted to play around with color and the way layering string art and color can create an abstract piece of art.

sketch


function setup() {
    createCanvas(400,300);
    
}
 function draw (){
    background(235, 192, 52);
    for (i= 0; i<200; i+=5){
    stroke(244, 192, 252);
    line(i-100, 0, 400, i)
        
    stroke(244, 192, 252);
    line(0, i, i, 200)
    
    stroke(244, 192, 252);
    line(i, 200, 0, 600-i)
    line(i, 250, 0, 300-i)
    
    }
    for(i=0; i<400; i+=10){
    stroke(255);
    line(400, 300-i , i, 300);
    line(400, 200-i , i, 300);
    line(400, 100-i , i, 300);
    line(400, 50-i , i, 300);
    stroke(209, 61, 90);
    line(100-i, 150, mouseX, mouseX);
    line(300-i,0, i-290, 150);
    
    
    }
 }

Gretchen Kupferschmid-Looking Outwards-04

Mixing both art with experience design, the hotel Sister City in NYC has a special sound installation in their lobby. Through a collaboration between musician and composer Julianna Barwick and Mircrosoft this project utilized Microsoft’s Custom Vision Service which utilizes artificial intelligence to track and analyze various elements of the Sister City environment through a camera on the roof. Through this knowledge, it then triggers the sound specific to what the camera has recognized. For example, clouds play a different sound than birds, and as things occur in the environment, a “song” is produced in the lobby. I find this extremely interesting because it creates a generative music installation that although is very technical, its being made by the natural environment around you. It also allows Barwick to see her own sound scores become something of their own as they are controlled by “outside forces”.

A video describing the project

https://www.microsoft.com/inculture/musicxtech/sister-city-hotel-julianna-barwick-ai-soundscape/

Gretchen Kupferschmid-Looking Outwards-03

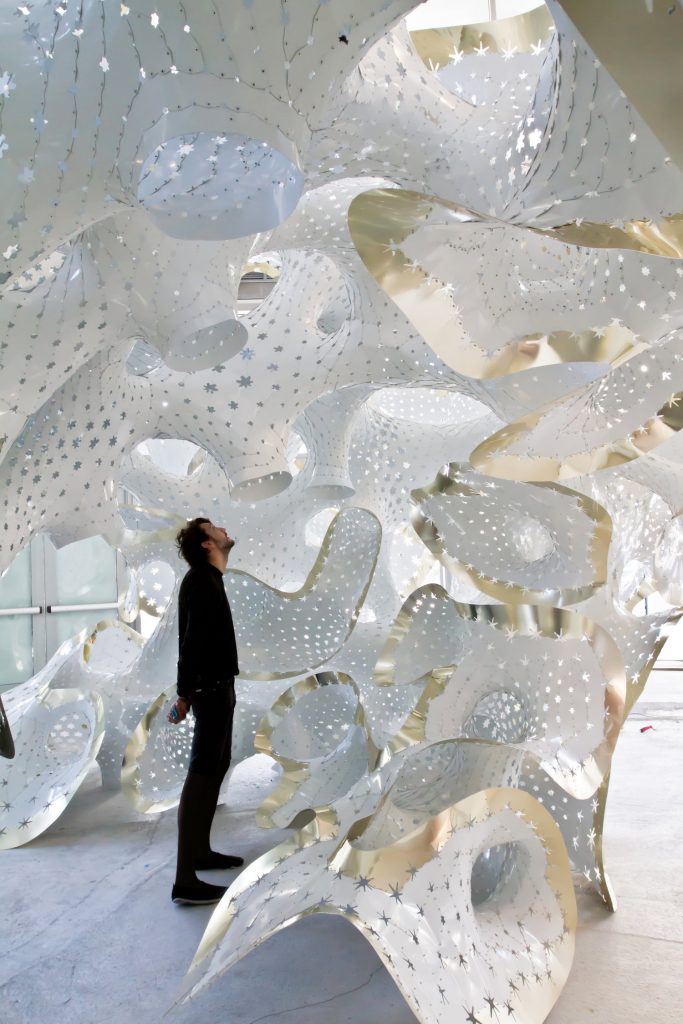
The sculpture that was installed at Miami Art Basel

Constructed from aluminum that is one millimeter thick, Marc Fornes/THEVERYMAN created a sculpture that works as a pavilion called Labrys Frisae. The sculpture was meant to blur the distinctions between edge and space to create a immersive experience. This object was create through computational code, but what I find intriguing is creating art through code that humans can interact with and hold the human form. I couldn’t find much information of the exact algorithm he uses, but I know that process is meticulous and hands on.

The indoor pavilion at Art Basel

https://theverymany.com/constructs/11-art-basel-miami

Gretchen Kupferschmid-Project 03- Dynamic Drawing


sketch

var angle = 0;

function setup() {
    createCanvas(480,640);
}
 function draw (){
    background(500 - mouseY, 128, 224);
    //ellipse grows big and changes color
    noStroke();
    fill(800-mouseY, 400-mouseX, 15);
    ellipse(width/2, height/2, mouseX, mouseX);
    //line rotates with mouse and color changes
    push();
    translate(width/2, height/2);
    rotate(radians(mouseX/3));
    strokeCap(ROUND);
    strokeWeight(50);
    stroke(147, 190, 500-mouseX);
    line(10,10 ,mouseX, mouseY);
    pop();
    //line 1 rotate clockwise and change color
    push();
    translate(mouseX, mouseY);
    rotate(radians((angle+.5)*2));
    strokeCap(ROUND);
    strokeWeight(50);
    stroke(500-mouseX, 154, 158);
    line(10,10 ,50, 100);
    pop();
    //line 2 rotates counterclockwise and change color 
    push();
    translate(mouseX, mouseY);
    rotate(radians((angle+.5)*-2));
    strokeCap(ROUND);
    strokeWeight(50);
    stroke(220, 500-mouseX, 158);
    line(10,10 ,50, 100);
    pop();
    //line 3 rotates fastest and changes color 
    push();
    translate(mouseX, mouseY);
    rotate(radians((angle+.5)*5));
    strokeCap(ROUND);
    strokeWeight(50);
    stroke(220, 150, 500-mouseX);
    line(10,10 ,50, 100);
    pop();

     
    angle = angle +.5;
 }