Sammie Kim–Project 07–Curves

sketch

//Sammie Kim
//Section D
//sammiek@andrew.cmu.edu
//Project 07 - Curves
var nPoints = 360;

function setup() {
    createCanvas(480, 480);
}

function draw() {
    background(0);
    drawHypotrochoid();
    drawAstroid();
}

function drawHypotrochoid() {
    //constraining mouse within the canvas size
    var x = constrain(mouseX, 0, width);
    var y = constrain(mouseY, 0, height);
    //stroke color will also change based on the direction of mouse
    var rColor = map(mouseX, 0, width, 0, 230)
    var gColor = map(mouseY, 0, height, 0, 230)
    stroke(rColor, gColor, 200);
    strokeWeight(2);
    noFill();
    //Setting the parameters for the hypotrocoid
    push();
    translate(width/2, height/2); //starting the shape at the center of canvas
    var a = map(mouseX, 0, width, 0, 200); //the radius range of circle
    var b = map(mouseY, 0, height, 0, 50);
    var h = map(mouseX, 0, height, 0, 50);
    beginShape();
    //Hypotrochoid formula
    //http://mathworld.wolfram.com/Hypotrochoid.html
    for(var i = 0; i <= nPoints; i++) {
        var x = (a - b) * cos(i) + h * cos((a - b) / b * i);
        var y = (a - b) * sin(i) - h * sin((a - b) / b * i);
        vertex(x, y);
    }
    endShape();
    pop();
}

function drawAstroid(){
    var x = constrain(mouseX, 0, width);
    var y = constrain(mouseY, 0, height);
    push();
    noFill();
    strokeWeight(4);
    stroke("pink");
    translate(width / 2, height / 2);
    var a = map(mouseX, 0, width, 20, width / 3);
    beginShape();
    //Astroid formula
    //http://mathworld.wolfram.com/Astroid.html
    for (var i = 0; i < nPoints; i+= 0.5){
        var x = a * pow(cos(i), 3);
        var y = a * pow(sin(i), 3);
        vertex(x, y);
    }
    endShape();
    pop();
}

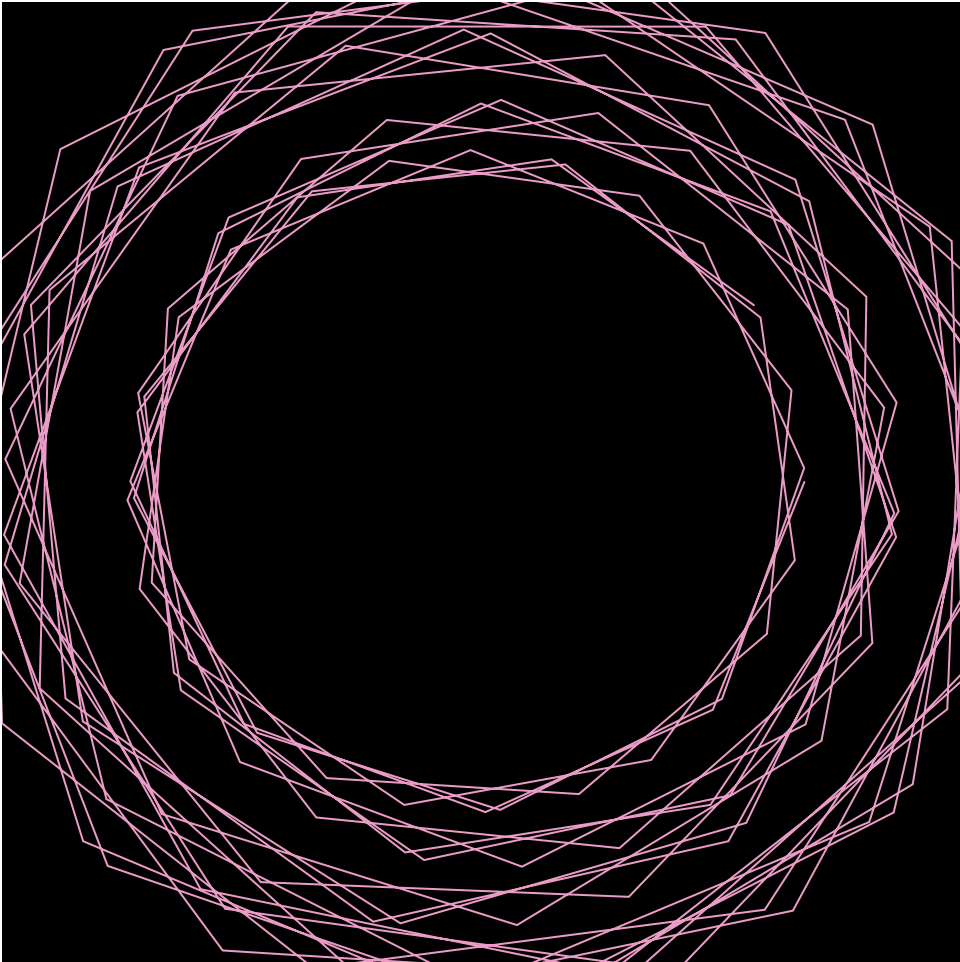
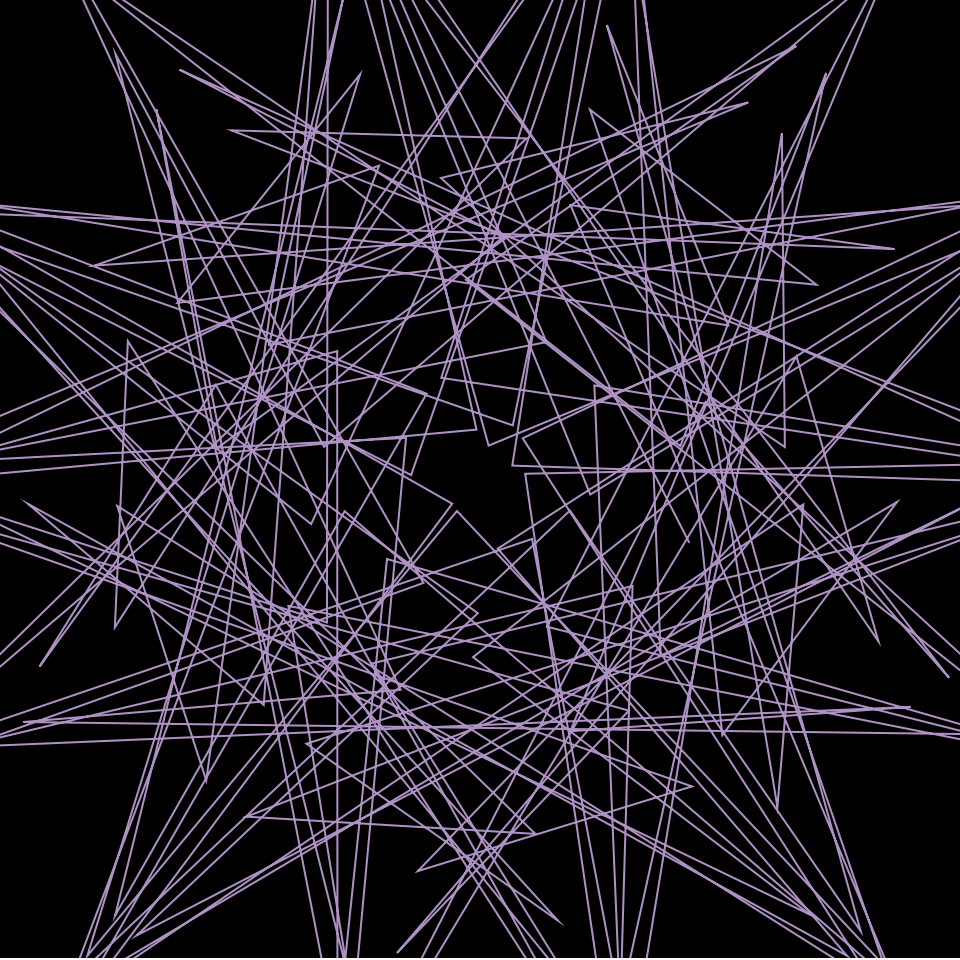
This project was challenging as I had to incorporate an interactive element within the hypotrochoid shape. It initially took a while to understand how I could flexibly use the map function, substituting different numbers to play with the range of mouse X and Y, then seeing the effects on screen. I also added a change to color as another element, where the R and G values would change depending on the mouse’s location. Afterwards, I created an astroid in the center that playfully interacts with the surrounding hypotrochoid. What intrigued me the most was how unexpected the shape would vastly change by rotating my mouse around the canvas, creating diverse shapes through intersection of lines.

When the max range of hypotrochoid value a is at (0, 10)
When the max range of hypotrochoid value a is at (0, 300)

Sammie Kim – Looking Outwards – 07

Artificial Arcadia is a collaborative project between the KOSMOS architects and Fragmentin, an art practice based in Switzerland. With its spatial design inspired by the Swiss infrastructures like snow cannons, irrigation systems, and more, Artificial Arcadia inspires visitors to interact with the dynamic landscape in a performative scenographic landscape. This landscape is mapped with “bauprofile” markers, which are construction poles that show the intended location of future buildings, and they are topped with a white textile roof evoking the Swiss mountain range. The interactive element comes alive as visitors enter and move through the installation, where the poles position themselves at different heights and gradually fall to reference the melting levels of ice. The algorithms derives from the Swiss topography data, where a new portion of the Alps snow level map is randomly selected and analyzed every few minutes, then translated within the landscape. This project was inspiring as it provides a perspective towards our environment, particularly how it sparks debate regarding the artificial integration to a natural area. Likewise, Fragmentin’s work crosses the boundary between art and engineering, exploring the complex systems through form and interaction. 

“bauprofile” markers (Fragmentin)

Interactive installation space prompts visitors to move through (Fragmentin)

Sammie Kim – Looking Outwards 06

35 years ago, Ken Perlin won an academic award for discovering a technique now called “Perlin Noise.” It is defined as a type of gradient noise that interpolates random values to create smooth transitions through the noise function. While it is readily controllable, Perlin Noise can also be embedded flexibly into other mathematical expressions to create a wide range of textures that imitate the controlled random appearance of textures in nature. 

Thus, this technique is a powerful algorithm that is used in methodical content generation, particularly popular in visual media from games to movies for adding realistic randomness to CG renderings of smoke, fire, and water. Likewise, the bottom artworks “Perlin Noise Patterns” by the artist Martin Tinram really inspired me, especially with how delicate and sophisticated the texture are rendered. It was astonishing how they were computer generated, as they looked so detailed and realistic, almost like photographs. The effects are mostly present in the 2nd and 3rd dimension, although it could be extended into the 4th dimension as well. With this, I learned how significant randomness can be in computation and design, as it could be both readily controlled for specific aesthetic results, yet unprecedented at the same time. 

Perlin Noise Patterns (Martin Tinram)

https://www.behance.net/stingingeyes

Sammie Kim – Project 06 – Abstract Clock

sketch

//Sammie Kim
//Section D
//sammiek@andrew.cmu.edu
//Project 06 - Abstract Clock

function setup(){
    createCanvas(400,600);
}

function draw(){
    background(0);
    //variables for time
    var s = second();
    var m = minute();
    var hr = hour();

    //Shining stars and black night background
    for (var i = 0; i < 100; i ++) {
        frameRate(2);
        fill(225);
        var eSize = random(1, 5);
        var x = random(0, width);
        var y = random(0, height);
        ellipse(x, y, eSize, eSize);
     }

    //Mapping time to shape components
    var secIncrease = map(s, 0,59, 0, height);
    var minIncrease = map(m,0, 59, 50, height/2);
    var hrIncrease = map(hr, 0, 23, 100, height * 3/4);

    //Every minute, the blue sky background will decrease, slowly revealing the space
    fill(102, 153, 255);
    rect(0, 0, width, height - minIncrease);

    //Rocket flies upwards every second
    fill(78, 78, 252);
    triangle(225, 525 - secIncrease, 190, 570 - secIncrease, 260, 570 -secIncrease);
    fill(252, 84, 78)
    rect(190, 570 - secIncrease, 70, 100);
    stroke(0);
    strokeWeight(10);
    fill(255);
    ellipse(225, 600 - secIncrease, 30, 30);
    noStroke();
    fill(252, 153, 78);
    triangle(190, 670 - secIncrease, 225, 730 - secIncrease, 260, 670 - secIncrease);
    fill(170, 110, 196);
    triangle(190, 670 - secIncrease, 190, 710 - secIncrease, 230, 670 - secIncrease);

    //Pink circle is the sun, which is changing color every hour
    //The sun also goes down every hour
    noStroke();
    fill(hrIncrease, 180, 220);
    ellipse(100, hrIncrease, 60, 60);
  }

This project was challenging as I had to analyze how to incorporate the time concept into my canvas, letting each element pace by a specific rate of time. I imagined a rocket flying up by each second, and the sky slowly disappearing along as the rocket goes further up. The sun would also go down at the same time by every hour. With this, I got to review the map function once more, as I got to think about the range that is needed to limit the movement of the rocket. Also it took some time figuring out how to move the rocket in second increments up, which I eventually did by subtracting “secIncrease,” since the coordinates get smaller as it gets nearer to the top.

Sammie Kim–Project-05-Wallpaper

sketch

//Sammie Kim
//Section D
//sammiek@andrew.cmu.edu
//Project 05 - Wallpaper

function setup() {
    createCanvas(600, 480);
    background("black");
    }
//Calling pattern function in consistent intervals by using for loop
function draw() {
    for (var x = 0; x < width + 50; x += 100) {
        for (var y = 0; y < height + 50; y += 70) {
            pattern(x + 50, y + 30);
        }
    }
}
function pattern(x, y){
    //variables controlling each shape's size
    var size = 50;
    var smallSize = 15;
    var rectSize = 30;

    noStroke();
    //pink ellipse
    fill("pink");
    ellipse(x, y, size, size);
    rectMode(CENTER);
    //rotated center black square to make diamond shape
    push();
    translate(x, y)
    rotate(radians(45));
    fill("black");
    rect(0, 0, rectSize, rectSize);
    pop();
    //inner red diamond inside the black diamond
    push();
    translate(x, y)
    rotate(radians(45));
    fill(255, 125, 122);
    rect(0, 0, size * 0.3, size * 0.3);
    pop();
    //tiny left black ellipse
    fill("black");
    ellipse(x - 20, y, smallSize, smallSize);
    //tiny top black ellipse
    fill("black");
    ellipse(x, y - 20, smallSize, smallSize);
    //tiny right black ellipse
    fill("black");
    ellipse(x + 20, y, smallSize, smallSize);
    //tiny bottom black ellipse
    fill("black");
    ellipse(x, y + 20, smallSize, smallSize);
    //vertical white lines
    stroke("white");
    line(x + 50, 0, x + 50, height);
  }

Brief Sketch of Initial idea

This project combined the materials I have learned so far in lecture regarding for loop and calling a function. I first created the pattern drawing of circles and squares as function “pattern” which I then embedded in the for loop to create repetition. Once again I realized how much more efficient it is to use this for loop rather than drawing all these elements numerous times.

Sammie Kim-Looking Outward-05

The Japanese computer graphic artist Yoichiro Kawaguchi was the first to build 3D computer generated images based on math and algorithms during the 1980s. He developed the course of image making, incorporating movements, realistic volumes, and high quality textures into his digital art. Kawaguchi calls this the “growth model,” a  “self organizing, formative algorithm for computationally reproducing branches or cell divisions.”  This specific artwork called Growth: Mysterious Galaxy was created in 1983, and it utilizes two essential techniques of ray tracing and metaballs. Ray tracing is an optical technique for calculating the luminance of each pixel, which defines the color to provide depth in the 3D image. I was particularly attracted to this piece due to its poppy and vivid colors and how the elements have such smooth and voluminous curves. As such, the recurring theme of his work is morphogenesis, reflecting on the principles of organic change and evolution—morphing the biological concept to create an artificial art piece.  When creating his art, he has a step by step process, starting with black and white geometric shapes and then allowing computer commands to evolve them into more complex and unknown figures. 

Growth: Mysterious Gallaxy (1983)
Complex computer graphic system (Yoichiro Kawaguchi)
Yoichiro Kawaguchi, Cytolon, 2002.

Sammie Kim – Project 04 – String Art


sketch

//Sammie Kim
//sammiek@andrew.cmu.edu
//Section D
//Project 4

function setup() {
    createCanvas(400, 300);
    //Variables to modify the coordinates of line sets
    //pink lines set a
    aY1Gap = 50;
    aY2Gap = 0.9;
    //light blue lines set b
    bY2Gap = 0.5;
    //Purple lines set c
    cY1Gap = 300;
    cX2Gap = 100;
    cY2Gap = 0.8;
    //Green lines set d
    dY1Gap = 200;
    dY2Gap = 0.75;
}

function draw() {
    background("black");
    //for loop to create series of lines with increments of 10
    for (var i = 0; i < 400; i += 10) {
        //Red line sets a
        stroke(255, 112, 112);
        line(i, mouseY / 2 - aY1Gap, width, i * aY2Gap);
        //light blue lines sets b
        stroke(181,255,221);
        line(i, mouseY, 0, i * bY2Gap);
        //Purple lines sets c
        stroke(122, 114, 240);
        line(i, -mouseY + cY1Gap, width / 3 + cX2Gap, i * cY2Gap);
        //Green lines set d
        stroke(28, 151, 45);
        line(i, -mouseY + dY1Gap, width, i * dY2Gap);
    }
  }

This project was challenging as I had to visualize the lines coordinates to create the curves. Sketching the picture first really helped me, since I got to picture the starting and ending points. By utilizing the “for function” to repeatedly create the line sets, I realized once more how much more convenient it is rather than writing a ton of line codes. 

Sammie Kim– Looking Outwards – 04

Interaction between audience and the installation (Quevillon)

“Algorithmic Drive” is an interactive installation created by Francois Quevillon, who was inspired by dash cam recordings and autonomous cars. Generated with a database of recordings from the car’s built-in camera, the captured videos are synchronized with information, including speed, location, orientation, altitude, as well as temperature of various motor sensors. This mechanism utilizes data analysis and computer vision algorithms that statistically sorts the content, then fabricates endless videos made with specific parameters related to the car’s activity and its current location. The interactive aspect comes with a controller and screen that allows the audience to engage and maneuver the system. I found it inspiring how the artist gained his creative spark from a technological venture, and developed an art piece that raises many ethical questions in our minds. According to Quevillon, he wanted to signify the issue of technical, legal, and moral issues that are involved in autonomous vehicles that can function without human intervention by “feeding and following algorithmic procedures” (Quevillon). As such, spontaneous events can always occur, especially road accidents due to unexpected causes.

Algorithmic Drive installation (Quevillon)

Algorithmic Drive – Spectacular car(au)tonomy

Sammie Kim-Project-03-Dynamic-Drawing

sketch

//Sammie Kim
//sammiek@andrew.cmu.edu
//Section D
//Project 3

//Global variables for default
var colorR = 0;
var colorG = 9;
var colorB = 48;
var angle1 = 0;
var angle2 = 0;

function setup() {
    createCanvas(640, 480);
}

function draw() {
    //Changing background colorR as my mouse moves in the Y direction
    var colorR1 = min(colorR + mouseY, 173);
    var colorG1 = min(colorG + mouseY, 48);
    var colorB1 = min(colorB + mouseY, 63);
    background(colorR1, colorG1, colorB1);

    //Limit the mouse range, so the images don't go off the canvas
    mouseX = max(min(mouseX, 500), 0);

    //Y coordinates of the rectangle behind the circle
    var rectY = 480 - mouseY;
    var rect2Y = 0 + mouseY;

    fill("black");
    rectMode(CENTER);
    rect(320,rectY,140,300); //center rectangle
    rect(110,rect2Y,50,400); //left rectangle
    rect(530,rect2Y,50,400); //right rectangle

    //X locations of the circles
    var circAx = mouseX
    var circBx = mouseX - 40
    var circCx = mouseX - 20
    var circDx = mouseX-50

    //Changing the widths of the circles
    var circAw = mouseX - 80;
    var circBw = mouseX - 150;
    var circCw = mouseX * 0.5 - 30;
    var circDw = mouseX * 0.4;

    //Series of circles
    fill(mouseX, mouseY, 100);
    circAw = constrain(circAw, 90, 350); //constrain main circle size
    circle(circAx,240,circAw);//Big visible circle
    fill(colorR1, colorG1, colorB1);
    circle(circBx, 240, circBw); //Big hidden circle
    fill(mouseX, 200, mouseY);
    circle(circCx,240, circCw);//Small visible circle
    fill(colorR1, colorG1, colorB1);
    circle(circDx,240, circDw); //Small hidden circle

    //Changing size of the rotating squares
    var rectSize = mouseY * 0.2;
    var rectSize2 = mouseY * 0.1

    //Rotating square
    fill(253, 242, 216);
    noStroke();
    push();
    translate(mouseX,240);
    rotate(radians(angle1));
    rectMode(CENTER);
    rect(100,100,rectSize,rectSize);
    pop();
    angle1= angle1 + 2;

    //Second rotating square
    fill(126, 211, 216);
    push();
    translate(mouseX,300)
    rotate(radians(angle2));
    rectMode(CENTER);
    rect(120,100,rectSize2,rectSize2);
    pop();
    angle2 = angle2 + 2
  }

This project was challenging in many aspects; I had to think about the shape’s coordinates in relation to the mouse location and constrain them so that they don’t leave the canvas. I was able to apply a lot of the knowledge I gained from the lab exercises with rotating squares and the lecture about creating movement. Overall, this project prompted me to be both creative and logical.

Sammie Kim – Looking Outwards 03

“Digital Grotesque” is a huge architectural piece led by Michael Hansmeyer that delves into the application of 3D fabrication technology.  Immediately, I was astonished by was the bold, massive scale of this artwork, as 3D technology has only been used for small-scale models in the past. Yet, the method of “sand-printing through additive manufacturing technology” overcomes such limitations, which allows for the fabrication of large-scale elements, along with high resolution and accuracy. Not only does the Digital Grotesque present a vast human-scale structure, it encompasses extremely complex geometry (260 million individual facets), along with ornate details that are impossible to draw by hand. What I find admirable about this project is the surprise element, how the base algorithms produce results that are not entirely predictable, though not random. The Also, what shocked me was how cost of the sand-printing technique, which was similar to printing a basic cube—there was barely any cost for customization. This showed how enormous the potentials of additive manufacturing in architecture can be, as even more complex forms could now be executed through the computer.

Photo of the Digital Grotesque (http://benjamin-dillenburger.com/grotto/)
Scale of the Architecture compared to the person (http://benjamin-dillenburger.com/grotto/)