Ghalya Alsanea – LO-07 – What the street!?

MOVE LAB- Resident Researcher/Artist
Direction
Full Credits
–Data derived from OpenStreetMap (OSM)
This project looks into wasted public spaces in cities. The tool creates awareness about the disparity between the distribution of space for bikes, cars, parking lots, rails, etc.

Who “owns” the city?

They first looked at how much space there is in a city for moving around (ie the allocation/distribution ratios between cars, bikes, etc). The tool, “What the Street!?” is labelled as “The Mobility Space Report”, where the designers created an open-source public tool for exploring urban mobility spaces. They created a fun way to look at inequality of mobility spaces systematically AND interactively.

Play with the tool here!

Cover for About What the Street!?
I choose this project because of how the resulting shapes give a mesmerizing, never before seen perspective of urban spaces. For example, the image above shows all parking spaces in NYC, packed tightly together.

How does it work?

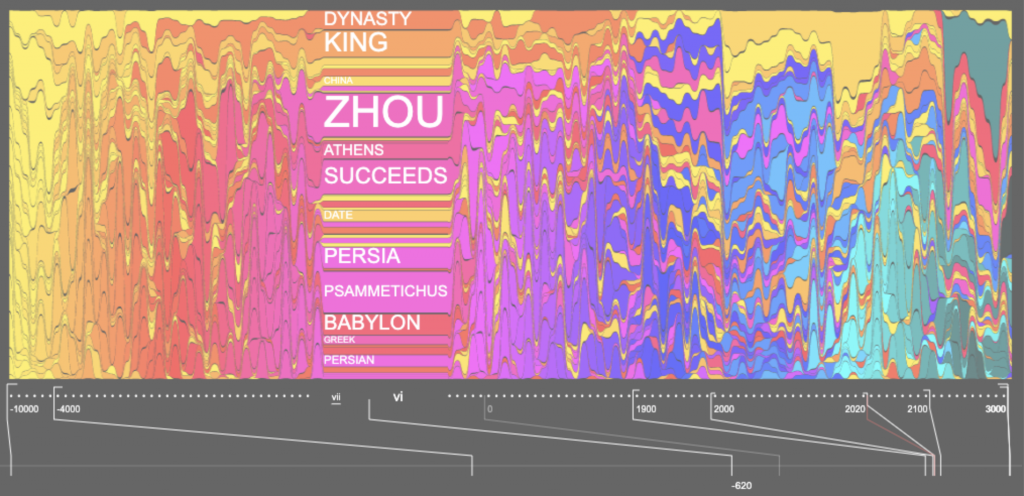
They use the data visualization tools of unrolling, packing, and ordering irregular shapes.  Therefore, they packed and rolled all mobility spaces into rectangular bins to visualize the areas they take up, then the tool allows you to see the same shape on a regular satellite map.

The mobility triangle shows how people move in each city – how much by car, bike, or public transport. Each dot stands for one city, and this specific image is highlighting Berlin (in blue). A dot in the very middle means an even share of these 3 forms of transportation is being used.

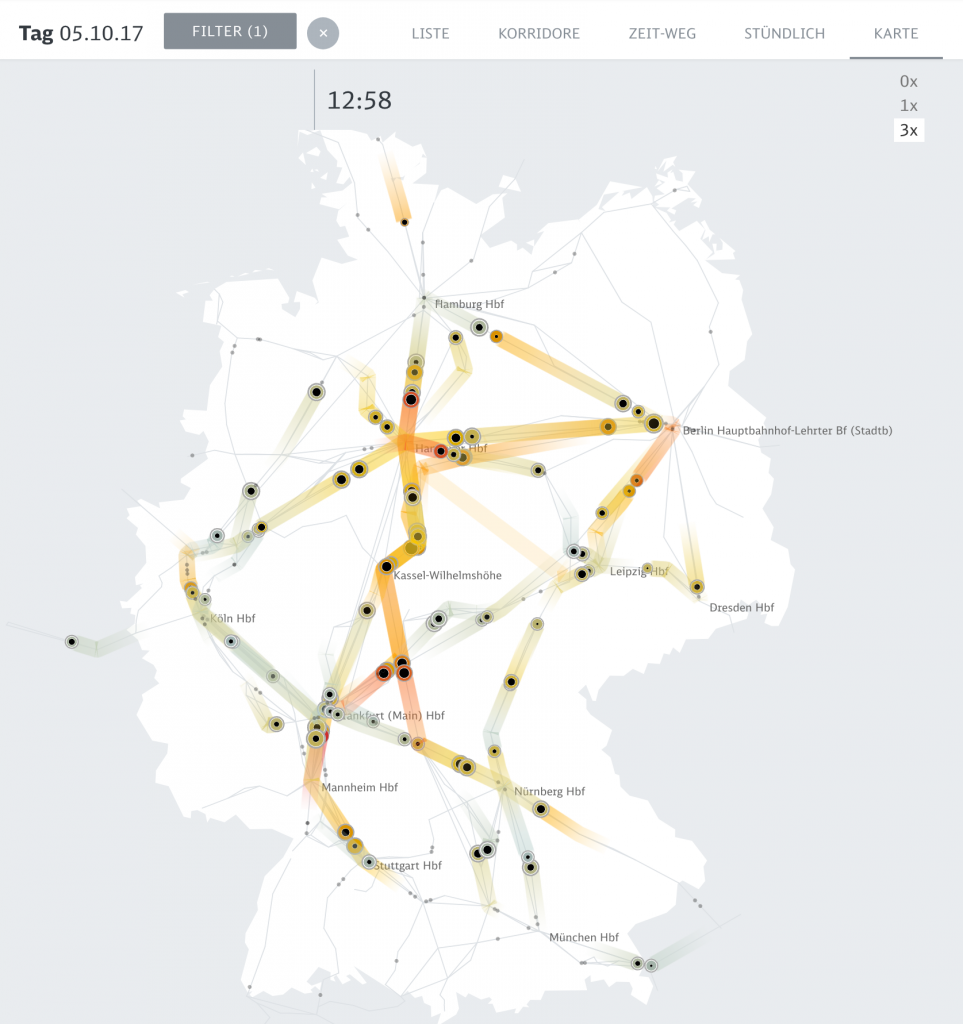
With each large dot there is a second dot that shows how much space a city has allocated for moving around with this particular transit mode. If first and second dots coincide, this would mean that city space is allocated in a fair way towards all forms of mobility. The triangle shows that space allocated is unfair: cars get much more space than they “deserve” – and bikes typically get much less. The team hope this tool shines a light on this disparity.

Austin Garcia – Looking Outwards – 07 – Section C

Santiago Ortiz’s Personal Knowledge Database is a very interesting amalgam of this artists references.

Database

I could not find a way to link an image of this interactive piece to this page, but I wanted to write about it nonetheless. I was fascinated clicking through this shifting mess of lines and finding different websites that Ortiz has used as reference in the past. All of these sites were used or created by him for one reason or another. I find this to be a fascinating way of storing and categorizing digital histories and data. Personally, I try to store a lot of my own references as images or text on my computer or an external hard drive. I have design documents and specifications, color palates, and academic papers all stored in folders. This method is a great way of visualizing that data as well as less tangible data like links to websites which are easily forgotten. While this way of sorting these things is not necessarily logical for accessing that data in the future, it is a visually compelling way to display all that data.

Stefanie Suk – Looking Outwards – 07

Installation of Unnumbered Sparks in Vancouver, Canada

Unnumbered Sparks, a work by Aaron Koblin and Janet Echelman, is a monumental interactive sculpture installed in the sky. This sculpture is a crowd-controlled visual artwork on a large canvas, where the color and design on the sculpture is choreographed by visitors at the moment through their mobile device. The visitors were able to use their smartphones and tablets to paint colors of light across the installation. Every small movement of the electronic devices projected vivid beans of light across the sculpture. What I admire the most about this artwork is the scale and complexity achieved in a single piece of installation. The computational software used in this sculpture explores scale, density, shape, and interaction with people, which I thought was the most fascinating about this project. Thus, the material used in this installation also caught my attention. The whole sculpture is made out of soft fibers attached directly into existing buildings. This exploration of material and application of interaction technology, I thought, really showed how much the artists wanted people to feel projected/connected to their artwork. This sculpture was definitely successful in using computation technology to create interaction between artwork and the visitors. 

Video of Unnumbered Sparks in Vancouver, Canada

Shannon Ha – Looking Outwards 07

Photo taken from jevbratt.com

‘Migration’ by Lisa Jevbratt is a data visualization image of the Internet. Each pixel represents 256 IP addresses and the different positions, size, color of the pixel blobs represents the amount of websites. This database of Websites was created by searching for Websites in the same IP addresses three times throughout 1999, 2001, 2004. The patterns in these images reveal  both the search process and information about the Internet and the Web. What I admire most about this piece of work is how it shows change over time in our ‘technology carbon footprint’ through the way the visual representations intensify which goes to show how dependent we have become on The Web. It is also very interesting how we can click into the blobs which would link and redirect you to the Website IP address, this way, the data visualized isn’t only presented on a surface level, but also lets us interact with it.

Carly Sacco – Looking Outwards – 07

7 Sets Venn Diagram is a creative visual by Santiago Ortiz that replicates the color wheel in a way that represents different mixtures of colors. He was inspired by Newton’s theories on light and color spectrum and used the actual colors instead of numbers. Ortiz created the wheel so that on Side A, there are little circles that when you hover your mouse over the names of the colors appear in the bottom. On Side B, the mandala consists more of filled in sections, but similarly has the names of the hues shown after you hover over the color. 

Santiago Ortiz is the Head at Moebio Labs which consists of data visualization developers and designers. Ortiz also specializes in interactive information visualization which this project is an example of the type of work he may do in that field. 

Looking Outwards-07-Claire Yoon

paths of air traffic visualized in color and form

Flight patterns is a data visualization of airplane traffic that captures the rhythms and spatial patterns across North America over a 24- hour period. This project was created by Aaron Koblin who used data from the Federal Aviation Administration’s (FAA), which tracks 140,000 planes a day. He then used processing to plot where each plane went and used after effects and Maya.

The various colors and patterns are coded to show a wide range fo data such as type of aircraft, alterations to routes, weather systems and no fly zones. Also, the airline hubs appear as bright points of diffusion inside a complex web. I found this project particularly intriguing because this project’s use of aggregated data is visually pleasing as well as represents a relationship between humans and technology.

This was originally part of

Flight paths from FAA data drawn algorithmically and colored based on airplane model

24 hours of flight data in the U.S

YouieCho-LookingOutwards-07

The animated map allows to see the big picture in train movements and to spot systemic effects. Peak Spotting by Christian Au, Moritz Stefaner, Stephan Thiel, Christian Laesser, Gabriel Credico, Lennart Hildebrandt, and Kevin Wang

The computational information visualization that I looked at is “Peak Spotting.” This is a means to combine machine learning and visual analytics methods to help manage the passenger loads on trains in Germany. It has a futuristic elements in the web application that integrates millions of datapoints over 100 days in the future to make predictions, and custom developed tools such as animated maps, path-time-diagrams, and stacked histograms create a vast range of types of data. The clearly color-coded visualizations point out what the critical bottlenecks are within the traffic difficulties. I think that the overall aesthetics is very helpful for understanding the data because it is subtle and readable with highly effective key colors. I can immediately know what kind of data I am looking at, and what time period the data are relevant to. Navigation also gives a good guidance.

Peak Spotting Preview

Cathy Dong-Looking Outwards-07

Flight Pattern Visualization

Originally developed by Scott Hessels and Gabriel Dunne, “Celestial Mechanics” project used Adobe After Effects and Maya. With time lapse animation, the project visualizes air traffic data and turns it into a series of videos and drawings, and perhaps art. Through still 2D drawings and screen captures, it displays the dynamics. Information shows the origin, end and path of the journey. Comparing the density of parts, readers find the busier ports in North America within a period of twenty-four hours. Also as it reveals multiple iterations of multiple iterations of flight patterns during the cycle, the project implies weather systems and no-fly zones.

Air Traffic over North America
Zoom-in Flight Pattern

Nawon Choi— Looking Outward 07

History Words Flow

History Words Flow by Santiago Ortiz

I chose Santiago Ortiz’s “History Words Flow” because I found the way he represented the data really intriguing and visually captivating. He represents the words found in Wikipedia articles about different time periods. In a video, he talks about the way he chose to represent the words. He uses scale and color to indicate the frequency and type of word, and arranges these words on a timeline that looks like melting or flowing paint. Moreover, the information is not absorbable at once glance. The viewer must scroll through the timeline in order to parse through and view each of the most common words at a single point in history. I liked this project because it was an interested concept executed in a creative and unique way.

Aaron Lee – Looking Outwards – 07

BikeCycle by Feltron

Nicholas Felton is both a designer and artist who transcribes numbers into something more meaningful whether it is an object or experience. One of the projects that I was interested was his collaboration with MoMa Store and art screen company Framed. They were using a year of data to come up with an app called BikeCycle.

The app visualizes a year of data in New York’s bike sharing program CitiBike focusing mainly into five different aspects. 1) Activity 2) popular routes 3)stations 4)bikes and 5)cyclist demographics.

I was mainly drawn by this project because I was interested in how bike rental apps developed over the course of the year. This project was done and released back in 2015, and obviously there are many more apps like this today. I was surprised to find how this app looks very similar that of today but also perhaps more artistic. It’s hard to know more about the specific algorithm behind the project but I could still read the creator’s artistic sensibilities.