Meejin Yoon is an architect and designer. She currently serves as the dean of the school of architecture at MIT. She got her bachelor of architecture education from Cornell and a master of architecture degree from Harvard GSD. She is truly a pioneer in designing interactive public space and she regarded her projects as bridges that engage technology in the public sphere. Her works that were presented in the talk really showed that she has successfully and effectively integrated technology to the architecture that aligns with the purpose and context of her projects.
One project that I really admired is MIT’s Collier Memorial. There are a number of concepts that are associated with this memorial. The form drew from MIT’s motto, “Mens et Manus,” Latin for “mind and hand.” Five radial stone walls form the hand’s fingers connecting by a vault; the palm and the open hand represent Collier’s spirit of helpfulness, and the space under the vault represented his absence. She successfully synthesized some really meaningful memories aligning with the core values of MIT and finally produced an elegant and beautiful memorial.
Eyeo 2015 – Meejin YoonHöweler + Yoon Architecture, Collier Memorial
Refik Anadol is a media artist and director born in Istanbul that currently lives in Los Angeles. He is the co-founder and creative director of Antilop, a technology-driven creative design studio operating at the intersection of audio-visual performances, moving images, and interactive installations. He creates site-specific public art that uses a parametric data sculpture approach, as well as live visual or audio performances within immersive installations. His work often creates a hybrid relationship between architecture and media arts with machine intelligence. As someone that studies architecture, I appreciate how he uses light as an architectural median in order to create buildings with memories that can learn, dream and remember.
My favorite project by him was WDCH Dreams, a project in which he projects visualizations onto the Walt Disney Concert Hall. In order to make the building “dream” he collected 45 terabytes of data from the LA Phil data archives. He then applied machine intelligence to the digital archives in order to create a computerized mind that processed these memories to form new combinations of images and ideas. I admire this project because of the amount of preparation that went into the project, from remodeling every detail of the Disney Concert Hall from old Catia models to processing all of the data. In addition, the Disney Concert Hall is a building that I admire and it is fascinating to see a new layer of meaning on top of it.
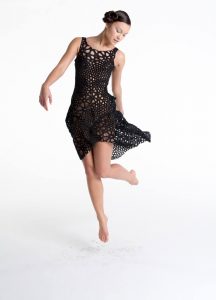
Nervous System is a design studio that works at the intersection of science, art, and tech. Founded in 2007 by Jesse Louis-Rosenburg and Jessica Rosenkrantz, Nervous System focuses on creating generative online applications in which users can co-create products resulting in infinite design possibilities for homeware, lighting, jewelry, and most fascinating, clothing. Some of their simpler 3-D designs can also be downloaded and printed at home. Check out their website here.
One of their more interesting designs is of a parametric dress which is fully 3-D printed using smaller modules that can fold and make the dress malleable and form-fitting. In addition, they implemented an application which accounts for body shape and size so that almost anyone can rock this dress.
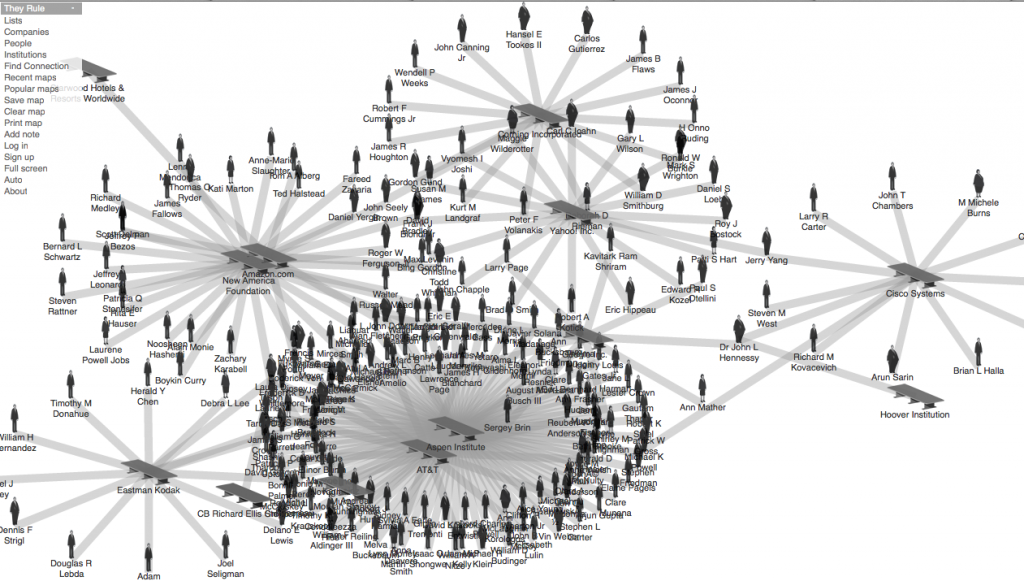
They Rule is a data visualization site where you are able to browse and identify the relationships of the US ruling class. It shows you the boards of the most powerful U.S. corporate companies, such as Google, Yahoo, and Amazon. If you click one of the board members in one of the companies, it will show the connections the individual has to different companies that he/she is involved in. Through the process, the data visualization expands from one to multiple connections of people and companies. It shows you how everything is connected to one another. This information design shows the structure of large corporations and distribution of power in U.S economy.
//Jasmine Lee
//jasmine4@andrew.cmu.edu
//Section C
//Project-07 (Composition with Curves)

var points = 100; //helps control length of curves
var turn = 0; //controls speed of rotation

function setup() {
    createCanvas(480, 480);
}

function draw() {
    background(20, mouseX / 3, 20);

    //"normal" speed curves
    push();
    translate(width / 2, height / 2);
    rotate(radians(turn));
    turn ++;
    drawEpi();
    drawEpi2();
    drawEpi3();
    pop();

    //slowest set of curves
    push();
    translate(width / 2, height / 2);
    rotate(radians(turn / 2));
    turn ++;
    drawEpi();
    drawEpi2();
    drawEpi3();
    pop();

    //fastest spinning set of curves
    push();
    translate(width / 2, height / 2);
    rotate(radians(turn * 2));
    turn ++;
    drawEpi();
    drawEpi2();
    drawEpi3();
    pop();

    //faster spinning set of curves
    push();
    translate(width / 2, height / 2);
    rotate(radians(turn * 1.5));
    turn ++;
    drawEpi();
    drawEpi2();
    drawEpi3();
    pop();

    //creates center of flower
    noStroke();
    fill(255, 255, 255, 50);
    ellipse(width / 2, height / 2, mouseX / 2.5, mouseX / 2.5);
    fill(255, 255, 255, 50);
    ellipse(width / 2, height / 2, mouseX / 4, mouseX / 4);
    fill(255, 255, 255, 50);
    ellipse(width / 2, height / 2, mouseX / 5, mouseX / 5);

}

//draws the smaller epicycloid curve
function drawEpi() {
    var a = map(mouseX, 0, width, 10, 100);
    var b = a / 2;

    //curves
    strokeWeight(3);
    stroke(mouseX / 2, 30, mouseY / 2);
    noFill();
    beginShape();
    for (var i = 0; i < points; i ++) {
        var t = map(i, 0, 50, 0, TWO_PI);
        crvX = ((a + b) * cos(t)) - (b * cos(((a + b) / b) * t))
        crvY = ((a + b) * sin(t)) - (b * sin(((a + b) / b) * t))
        curveVertex(crvX, crvY);
    }
    endShape();
}

//draws the medium epicycloid shape (filled-in)
function drawEpi2() {
    var a = map(mouseX, 0, width, 10, 300);
    var b = a / 2;

    //curves
    fill(mouseY / 2, 50, mouseX / 2, 100);
    beginShape();
    for (var i = 0; i < points; i ++) {
        var t = map(i, 0, 50, 0, TWO_PI);
        crvX = ((a + b) * cos(t)) - (b * cos(((a + b) / b) * t))
        crvY = ((a + b) * sin(t)) - (b * sin(((a + b) / b) * t))
        curveVertex(crvX, crvY);
    }
    endShape();
}

//draws the biggest epicycloid curves
function drawEpi3() {
    var a = map(mouseX, 0, width, 60, 400);
    var b = a / 2;

    //curves
    stroke(mouseY / 2, 60, mouseX / 2);
    noFill();
    beginShape();
    for (var i = 0; i < points; i ++) {
        var t = map(i, 0, 50, 0, TWO_PI);
        crvX = ((a + b) * cos(t)) - (b * cos(((a + b) / b) * t))
        crvY = ((a + b) * sin(t)) - (b * sin(((a + b) / b) * t))
        curveVertex(crvX, crvY);
    }
    endShape();
}
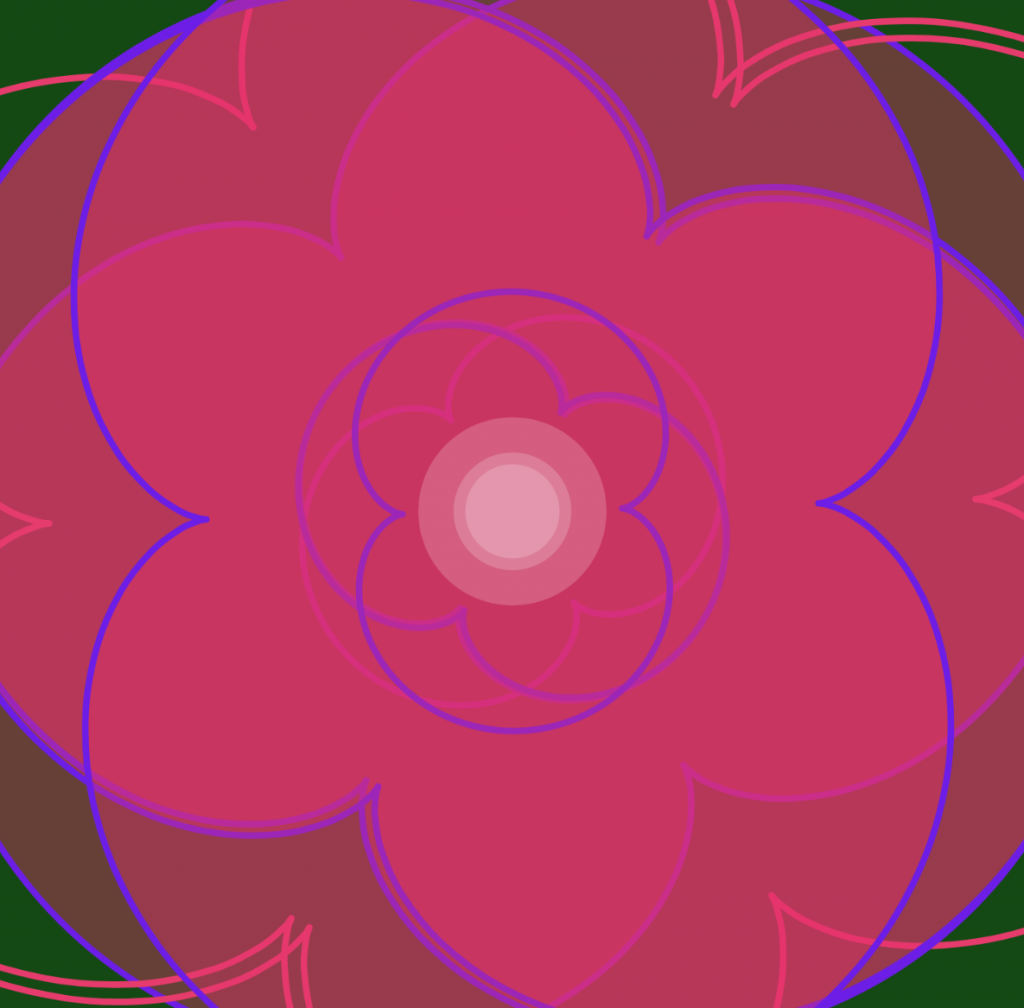
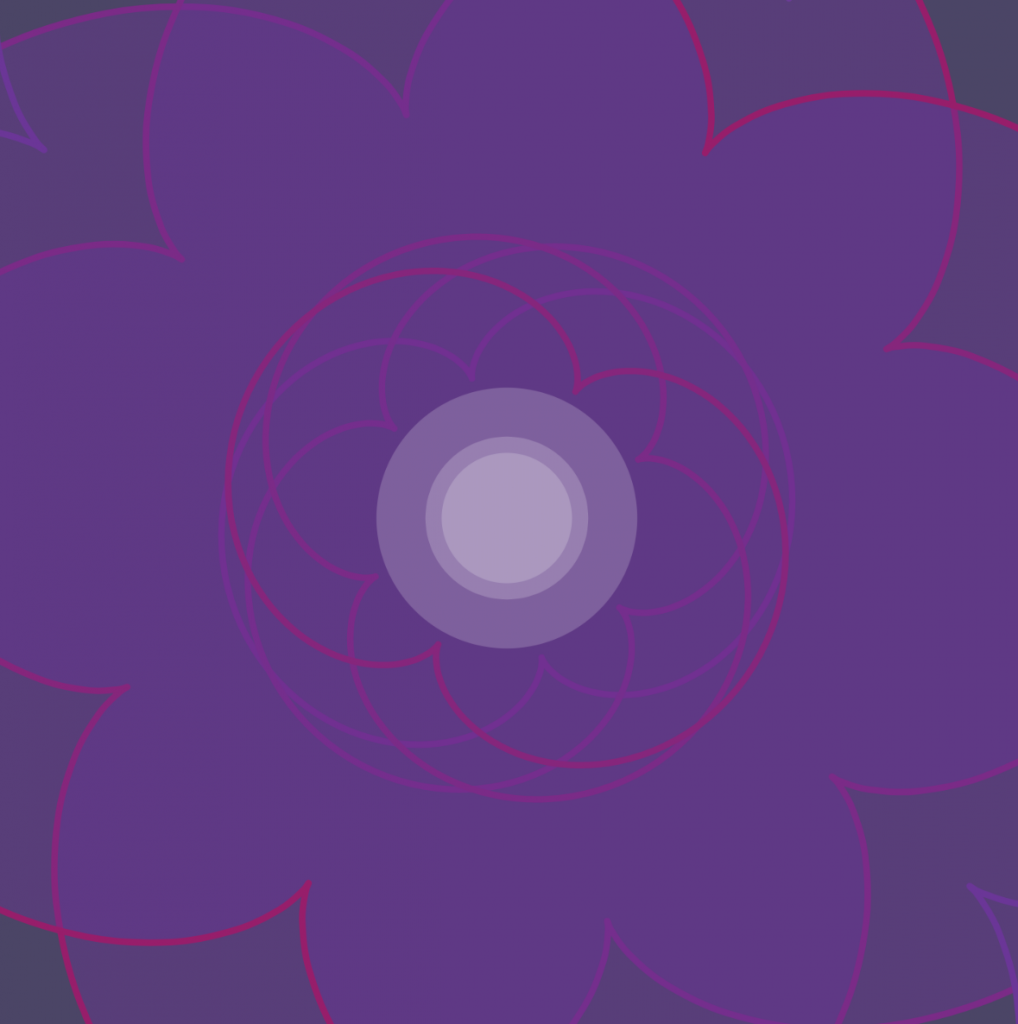
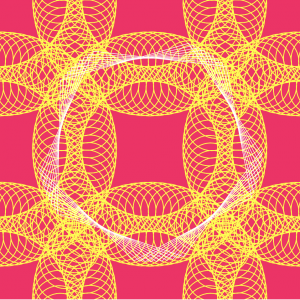
The trickiest part of doing this project was figuring how to create the curves using the mathematical formulas. I had to carefully study the formula to understand it. For this project, I was inspired by the Camellia flowers, which has petals that look as if they’re rotating around the center. It was interesting to be able to see the different curves and colors generated by the movement of the mouse.
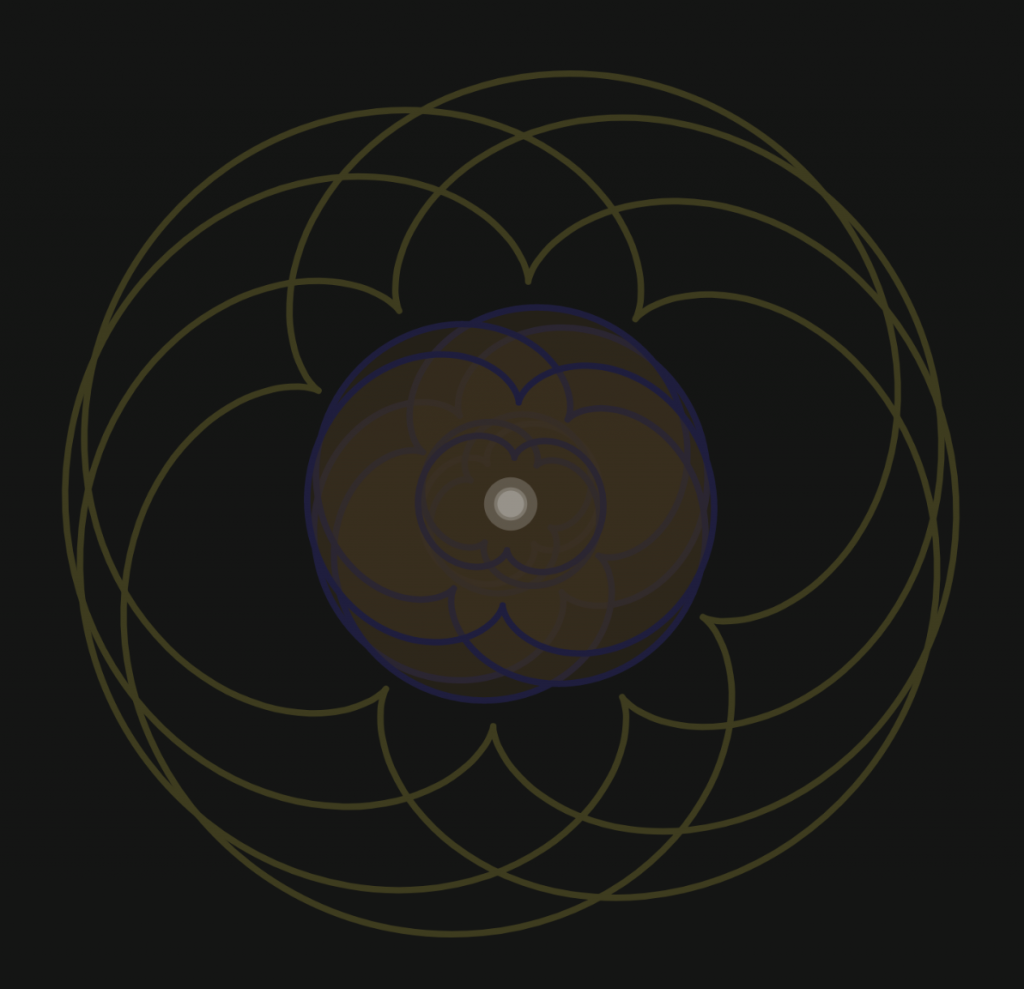
The flower is bigger when mouseX is greater (towards the right side of the screen).The colors get darker and more muted as the cursor approaches the top-left corner of the screen.The flower as it appears when the cursor is near the center of the canvas.
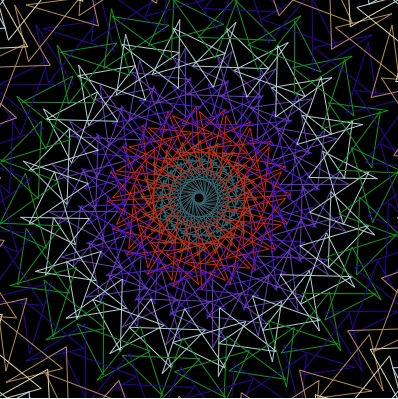
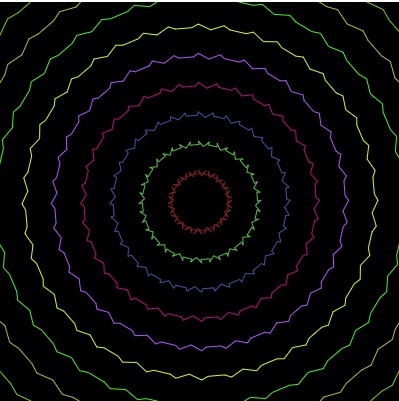
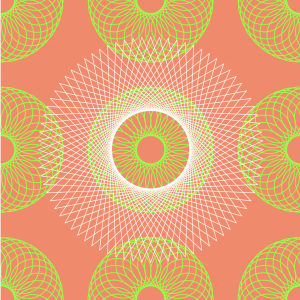
For this project, I tried to understand how curves work using cos() and sin(). So I spent time figuring out how to draw hypotrochoid after numerous attempt failed to get other curve forms.
Other forms that appear when you move your mouse:
/*SooA Kim
Section C
sookim@andrew.cmu.edu
Project 7: Composition with Curves
*/

var nPoints = 360;
var nPoints1 = nPoints * 10;
var angle = 1;

function setup() {
    createCanvas(480, 480);
    angleMode(RADIANS);
  }

function draw() {
    frameRate(24);
    var g = map(mouseX, 0, 480, 255, 0); //changing green color
    background(255, g, 100);
    angle += 10

    //replicate hypotrochoid using for loop

      for (var px = 0; px < 1000 ; px += 240) {
          for (var py = 0; py < 1000; py += 240) {
            push();
            translate(px, py);
            rotate(angle);
            Hypotrochoid();
            pop();
          }
      }
    drawCurveOne();
}

function Hypotrochoid() {
    var r = map(mouseX, 0, 480, 0, 255); //for red color changes
    var b = map(mouseY, 0, 480, 0, 255); //for blue

    strokeWeight(1.5);
    stroke(r, 255, b);
    noFill();
    beginShape();

    var a = map(mouseX, 0, 480, 10, 120);
    var b = map(mouseY, 0, 480, 2, 10);
    var h = map(mouseY, 0, 480, 40, 120);

        for (var i = 0; i < nPoints1; i++) {
            t = map(i, 0, nPoints1, 0, TWO_PI);
//Reference from <mathworld.wolfram.com/Hypocycloid>
            var x = (a - b) * cos(t) + h * cos((a - b) / b * t);
            var y = (a - b) * sin(t) + h * sin((a - b) / b * t);

            vertex(x,y);
        }

    endShape();
}

    function drawCurveOne() {
      stroke(255);
      strokeWeight(1);
      noFill();
      beginShape();

      //increase number of vertices of the curve
      var nuV = map(mouseX, 0, width, HALF_PI, TWO_PI);

      for (var i = 0; i < nPoints; i+= nuV) {
          //applied i to cos() and sin() to see what happens
          var x = 180 * cos(i) + width/2;
          var y = 180 * sin(i) + height/2;

          vertex(x,y);
      }
      endShape();
    }
I could not find a way to link an image of this interactive piece to this page, but I wanted to write about it nonetheless. I was fascinated clicking through this shifting mess of lines and finding different websites that Ortiz has used as reference in the past. All of these sites were used or created by him for one reason or another. I find this to be a fascinating way of storing and categorizing digital histories and data. Personally, I try to store a lot of my own references as images or text on my computer or an external hard drive. I have design documents and specifications, color palates, and academic papers all stored in folders. This method is a great way of visualizing that data as well as less tangible data like links to websites which are easily forgotten. While this way of sorting these things is not necessarily logical for accessing that data in the future, it is a visually compelling way to display all that data.
//sarah kang
//section c
//sarahk1@andrew.cmu.edu
//project-07-curves


 var ang = 0;
 var nPoints = 100;

function setup() {
    createCanvas(480, 480);
}

function draw() {

    background(0);
    noFill();
    //orange curves
    push();
    translate(width / 2, height / 2);
    strokeWeight(2);
    stroke(255, 159, 28);
    drawHypo1();
    pop();
    //red curves
    push();
    translate(width / 2, height / 2);
    strokeWeight(8);
    stroke(181, 42, 74);
    drawHypo2();
    pop();
    //yellow curves
    push();
    strokeWeight(2);
    stroke(255, 240, 122);
    translate(width / 2, height / 2);
    rotate(radians(ang));
    ang += mouseX / 50;
    drawRan();
    pop();
}
//Ranunculoid Curve
function drawRan(){ //http://mathworld.wolfram.com/Ranunculoid.html
    var sz = 10;
    //curve
    beginShape();
    for (var i = 0; i < nPoints; i += 0.1){
      var xr = sz * (6 * cos (i) - cos (6 * i));
      var yr = sz * (6 * sin (i) - sin (6 * i));
      vertex(xr, yr);
    }
    endShape();
}

//Hypotrochoid Curve 1
function drawHypo1() { //http://mathworld.wolfram.com/Hypotrochoid.html

    var x;
    var y;
    //controls
    var h = map(mouseY, 0, height, 0, 80);
    var a = map(mouseX, 0, width, 0, 300);
    var b = a / 8;
    //curve
    beginShape();
    for (var i = 0; i < nPoints; i ++) {
        var t = map(i, 0, 100, 0, TWO_PI)
        x = (a - b) * cos(t) + h * cos(((a - b) / b) * t)
        y = (a - b) * sin(t) - h * sin(((a - b) / b) * t)
        vertex(x, y)
    };
    endShape();
}

//Hypotrochoid Curve 2
function drawHypo2() { //http://mathworld.wolfram.com/Hypotrochoid.html

    var x;
    var y;
    //controls
    var h = map(mouseY, 0, height, 0, 80);
    var a = map(mouseX, 0, width, 0, 300);
    var b = a / 12;
    //curve
    beginShape();
    for (var i = 0; i < nPoints; i ++) {
        var t = map(i, 0, 100, 0, TWO_PI)
        x = (a - b) * cos(t) + h * cos(((a - b) / b) * t)
        y = (a - b) * sin(t) - h * sin(((a - b) / b) * t)
        vertex(x, y)
    };
    endShape();
}
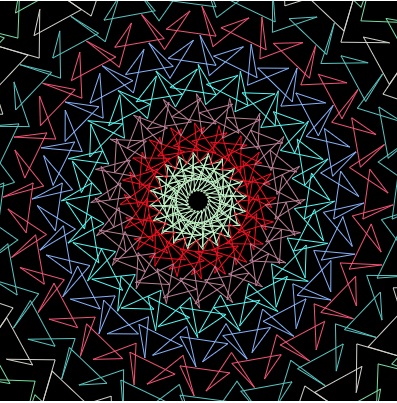
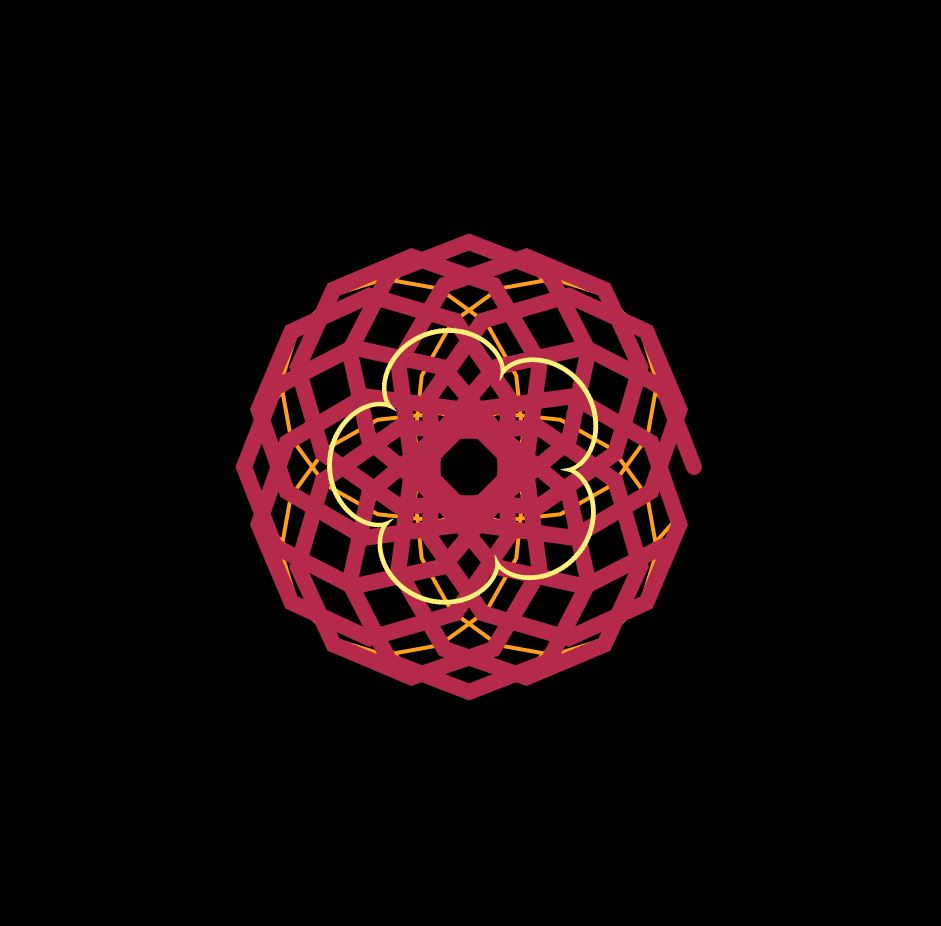
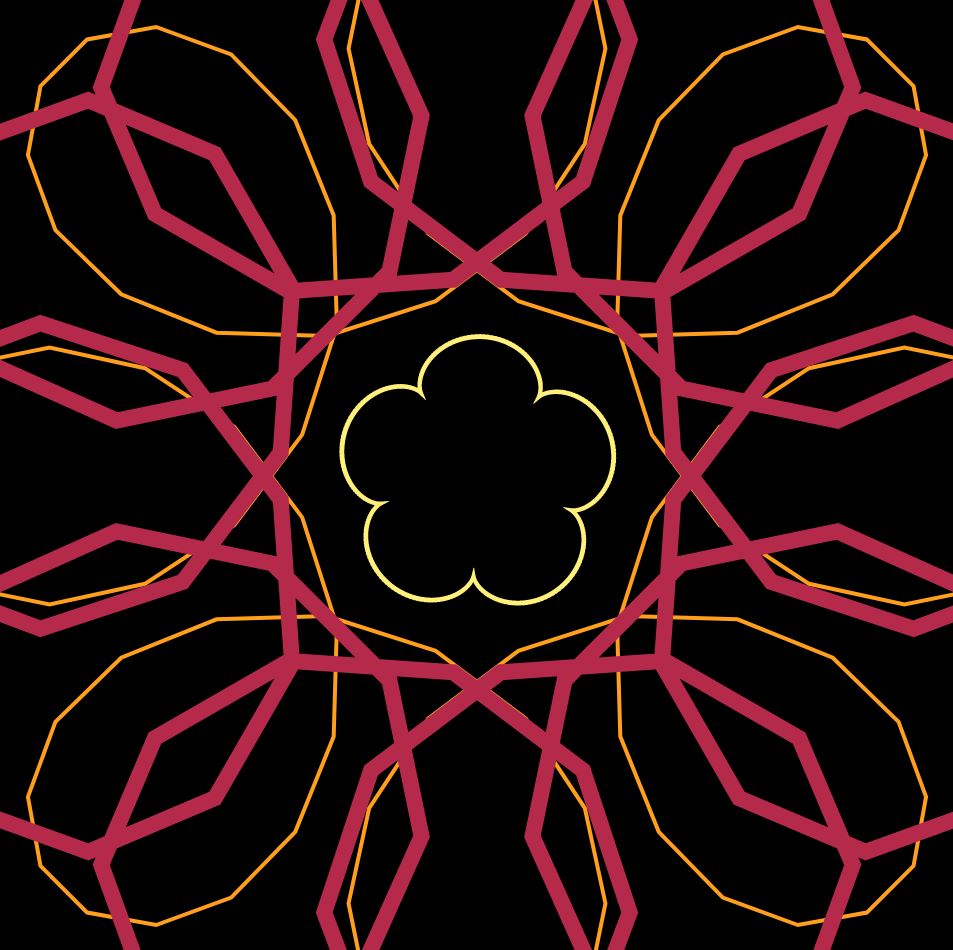
At first, trying to understand how the math equations were controlled was pretty confusing; after experimenting with the variables, I was able to adjust and change the outputs of the curves equations to how I wanted it to look. Then, I formatted the curves in terms of color and stroke weight to create a flowery design.
![[OLD FALL 2019] 15-104 • Introduction to Computing for Creative Practice](../../../../wp-content/uploads/2020/08/stop-banner.png)