![[OLD FALL 2019] 15-104 • Introduction to Computing for Creative Practice](wp-content/uploads/2020/08/stop-banner.png)
//Julia Nishizaki
//Section B
//jnishiza@andrew.cmu.edu
//Project 07 - Curves
var nPoints = 200;
var rotation = 0; //rotation for all Hypotrochoid Evolutes starts at 0
function setup() {
createCanvas(480, 480);
}
function draw() {
background('white');
stroke('white');
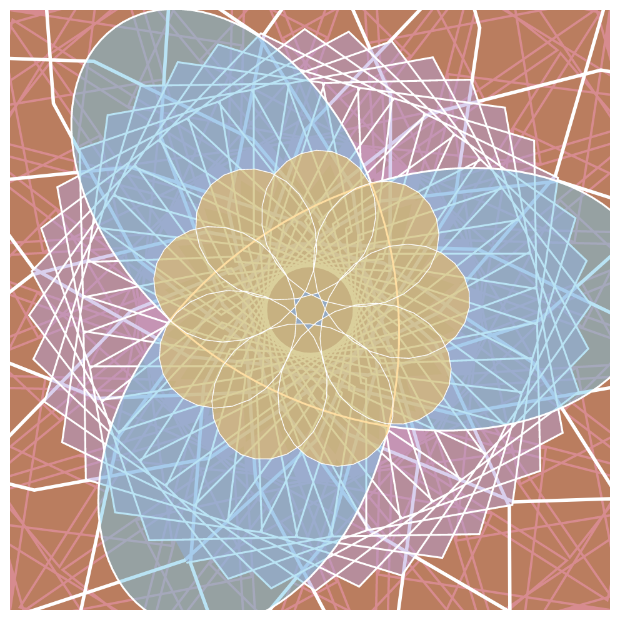
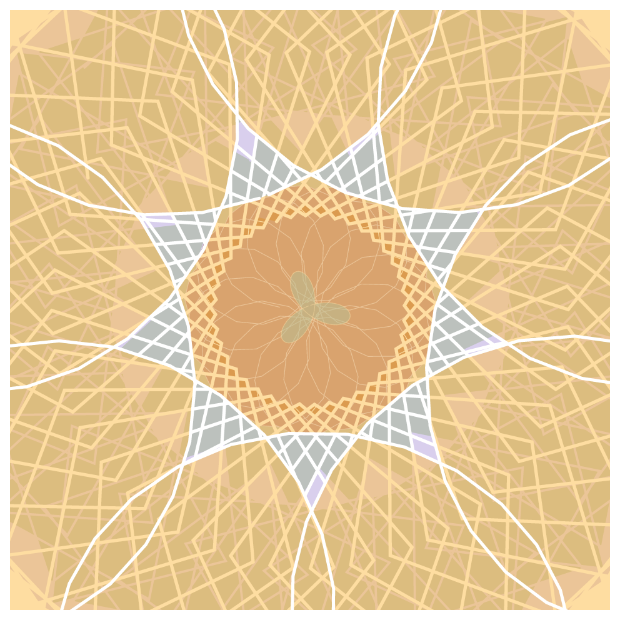
//Hypotrochoid Evolutes:
drawHypotrochoidEvolute(5, 300, 0.75, 2.5, color(139, 198, 63, 125)); //green
drawHypotrochoidEvolute(10, 150, map(mouseX, 0, width, 0, 2), 1.5, color(173, 18, 26, 125)); //red
drawHypotrochoidEvolute(5, 200, map(mouseY, 0, height, 0.25, 1), 2.5, color(177, 158, 219, 125)); //purple
drawHypotrochoidEvolute(50, 150, map(mouseY, height, 0, 0, 2), 1.5, color(113, 198, 232, 125)); //blue
drawHypotrochoidEvolute(25, 226, map(mouseX, width, 0, 0.25, 1.5), 2, color(253, 185, 63, 125)); //yellow
}
function drawHypotrochoidEvolute(pedalNum, angularity, size, strokeW, fillColor) { //pedalNum and angularity affect how many "pedals" you see, and their appearance
// Hypotrochoid Evolute:
// http://mathworld.wolfram.com/HypotrochoidEvolute.html
push();
translate(width / 2, height / 2);
scale(size); //scales down Hypotrochoids (including stroke), specified under draw
//causes all Hypotrochoid Evolutes to rotate at same rate, clockwise when mouse is below the middle of the canvas, counter-clockwise when above
rotation += map(mouseY, 0, height, -TWO_PI / 800, TWO_PI / 800);
rotate(rotation);
//creates the Hypotrochoid Evolutes
beginShape();
fill(fillColor);
strokeWeight(strokeW);
for (var i = 0; i < nPoints; i++) {
var t = map(i, 0, nPoints, 0, TWO_PI);
var h = map(mouseX, 0, width, -200, 200);
//The equation for Hypotrochoid Evolutes
x = (angularity - pedalNum) * cos(t) + h * cos((angularity - pedalNum) * (t / pedalNum));
y = (angularity - pedalNum) * sin(t) - h * sin((angularity - pedalNum) * (t / pedalNum));
vertex(x, y);
}
endShape();
pop();
}When approaching this project, I was a little overwhelmed, as I didn’t really know where to start, but after looking through the different roulette curves on the Mathworld curves website, I chose to focus on just the hypotrochoid evolute forms, as there were a large range of forms and examples for that particular curve that I could explore. After playing around with them a little, I started experimenting with colors and transparencies, and tried to go in the direction of a kaleidoscope, as I wanted my project to be constantly changing, and to reveal/conceal the different layers of colors depending on the location of your mouse.