![[OLD SEMESTER] 15-104 • Introduction to Computing for Creative Practice](../../../../wp-content/uploads/2023/09/stop-banner.png)
The project that I chose for this week’s Looking Outwards is called “Selfiecity” and it was coordinated by Dr. Lev Manovich. Selfiecity is an interactive project that analyzes the way people take selfies: in 5 different cities – Bangkok, New York, Moscow, Berlin, and Sao Paulo – the data of people’s selfies was collected to find many different patterns such as who smiles the most, who has more reserved looks, do angry people tilt their heads more strongly or what is a characteristic mood for people in Moscow.
I admire this project because it focuses on different cities all around the world instead of focusing on just specific ethnicity, culture or gender which shows more inclusion and diversity.
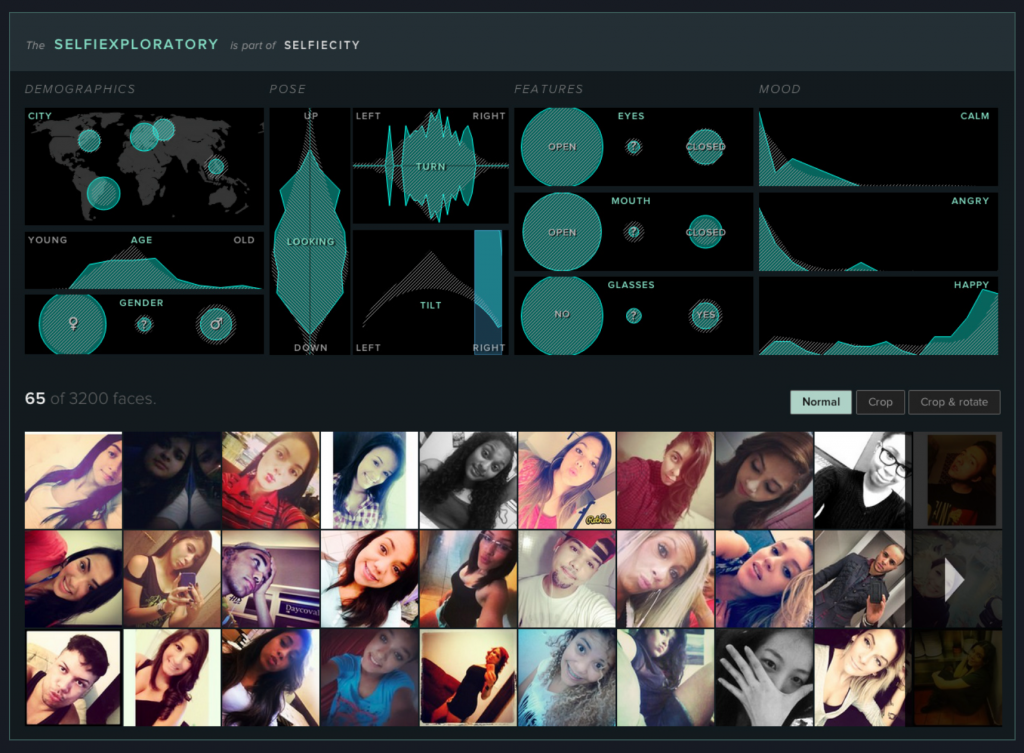
Selfiecity used different theoretic, artistic, quantitative, computational and data visualization methods to collect all the data. For example, Manovich’s team created an algorithm called Imageplots that assembled thousands of selfies to reveal interesting patterns and the team also created an interactive application called Selfiexploratory which allowed them to navigate the whole set of 3200 photos for the project. Selfiexploratory took into consideration matters such as location (1 of the 5 cities), age, gender, pose of looking up or down, tilt or turn of a head left or right, eyes and mouth open or closed, glasses or no glasses, calm, angry or happy. It’s fascinating how the team was able to create an application to take into consideration all of those things from just a simple selfie!
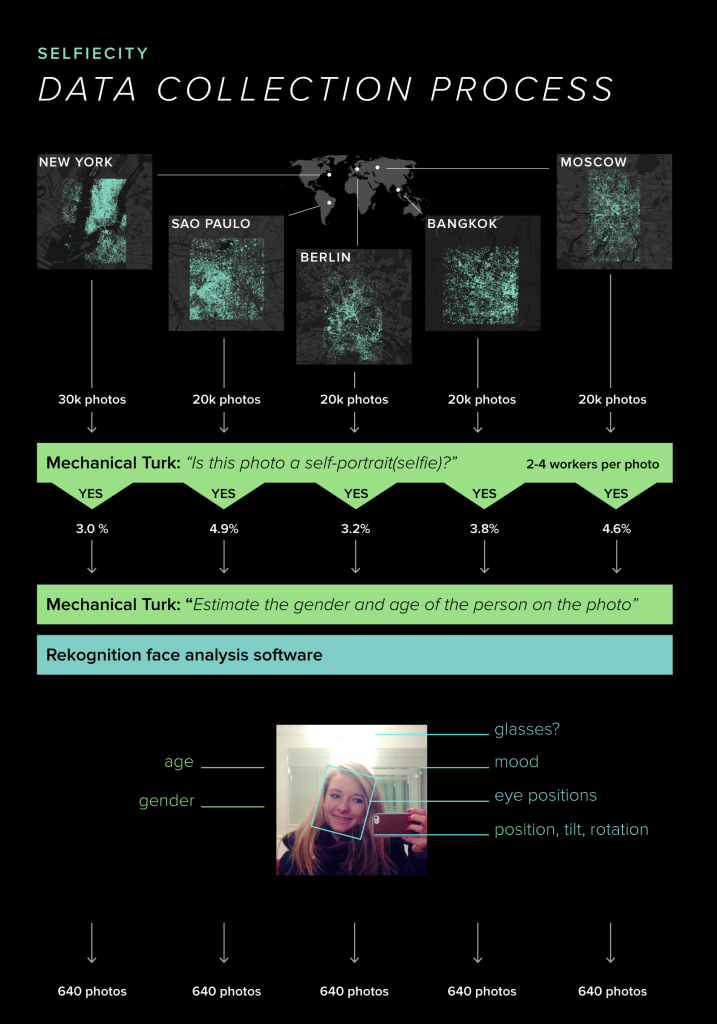
“This project is based on a unique dataset we compiled by analysing tens of thousands of images from each city, both through automatic image analysis and human judgement.” Manovich’s team randomly selected 120,000 photos, approximately 20,000-30,000 photos per city, from a total of 656’000 Instagram posts. After the selection, the team made 2-4 Amazon’s Mechanical Turk workers tag each photo by answering the simple question of “Does this photo show a single selfie?” The next step was to choose the top 1000 photos for each city and submit them to Mechanical Turk again to more skilled workers to guess the age and gender of the person in the selfies. With the top image selection, the team ran Selfiexploratory app to analyze the details. Finally, one or two members of Manovich’s team examined all these photos manually to find any mistakes and rounded the photos down to only 640 selfies per city.
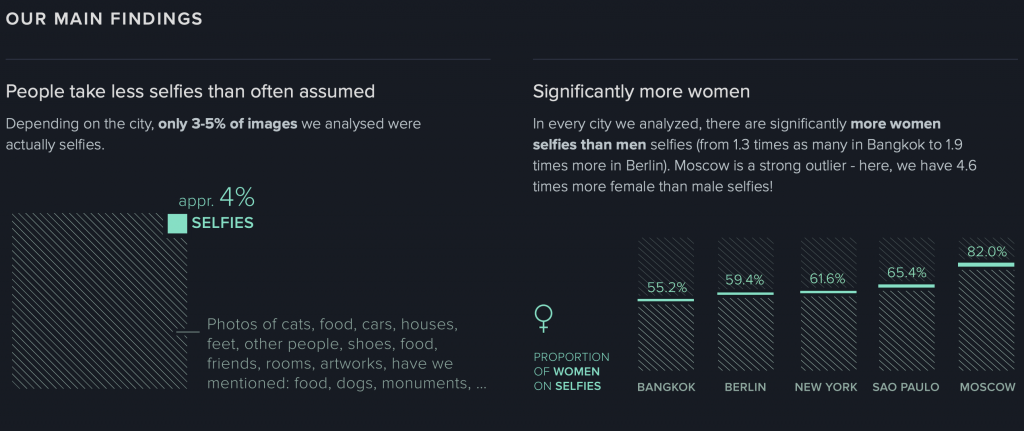
The creator’s artistic sensibilities manifest in the final form by finding out many interesting facts about selfies. For example, Manovich’s team found out that only 3-5% of images they analysed were actually selfies. The other 95-97% were pictures of cats, food, houses, artwork, other people like friends, etc. We always assume that people, especially Gen Z, take a lot of selfies lately, however only 3-5% of the photos analyzed were actually selfies. Moreover, the team found that in Moscow 82% of selfies were taken by women rather than men and Moscow has the least smiling selfies.
I think this project is very interesting because it focuses on the idea of a selfie and analyzes things such as tilt of a head or having glasses on. Many people wouldn’t even think that any data can be collected from a selfie, however data collected from a selfie in different cities can be used to find many cultural differences and lifestyles.