Final Project

sketch

var lines = []; // array of lines
var PGHannualAvg = [50.0, 50.4, 51.7, 49.0, 51.9, 53.8, 53.6, 52.6, 54.2, 54.5, 53.2, 52.3, 54.2, 51.2, 52.9, 54.1, 51.7, 53.4, 54.1, 53.8, 52.1, 51.6, 54.5, 52.3, 53.3, 53.3, 54.6, 53.6, 54.7, 52.6, 53.2, 52.9, 51.2, 52.0, 52.8, 50.7, 53.2, 52.2, 51.9, 53.7, 50.9, 53.6, 51.7, 52.0, 51.9, 49.3, 52.7, 53.3, 51.4, 55.4, 52.6, 50.3, 52.4, 50.8, 52.8, 51.6, 51.7, 53.1, 54.7, 53.5, 53.6, 52.6, 52.1, 51.0, 51.0, 53.0, 52.8, 49.6, 52.3, 51.6, 50.7, 52.0, 51.6, 53.6, 51.4, 52.4, 54.2, 51.1, 52.3, 52.9, 53.0, 51.8, 51.7, 51.0, 51.5, 48.8, 51.8, 49.1, 50.0, 49.4, 48.2, 51.1, 50.4, 50.1, 50.3, 49.1, 49.7, 50.7, 50.8, 49.9, 52.5, 51.4, 51.1, 48.0, 49.3, 49.7, 49.4, 49.5, 49.1, 50.4, 50.5, 50.4, 50.6, 51.7, 52.3, 51.0, 50.2, 53.3, 54.2, 50.9, 51.8, 51.6, 51.8, 50.3, 50.0, 54.0, 52.0, 50.8, 52.2, 52.6, 50.3, 51.6, 51.6, 52.3, 52.0, 50.9, 51.0, 51.9, 52.8, 54.2, 51.5, 50.0, 52.5, 54.2, 53.6, 52.3, 52.4, 53.3]
var Year = [];
var numLines = PGHannualAvg.length; // number of lines total
var lineWidth = 800/numLines; // width of lines

function preload() { // loads font info
    helveticaBold = loadFont('HelveticaNeueBold.ttf');
    helveticaUltraLight = loadFont('HelveticaNeueUltraLight.ttf');
    helveticaUltraLightObl = loadFont('HelveticaNeueUltraLightItal.ttf');
    helveticaLight = loadFont('HelveticaNeueLight.ttf');
    for (var i = 0; i < numLines; i++) { // pushes consecutive year info to year array
        Year.push(1872 + i);
    }
}

function setup() {
    createCanvas(800, 400);
    background(220);
    useSound();
}

function soundSetup() { // oscillator setup
    osc = new p5.Oscillator();
    osc.amp(0.25);
    osc.setType(sin);
    osc.start();
}

function makeLines() { // line object constructor
    for (i = 0; i < numLines; i++) {
        lines[i] = { x: i*lineWidth, y: height,
        temp: PGHannualAvg[i], draw: drawLines, c: chooseColor }
    }
}

function drawLines(line) { // function to draw lines
    noStroke();
    fill(this.c());
    rect(this.x, 0, lineWidth, this.y);
}

function chooseColor() { // if statements choosing colors based on temp array value
    if (this.temp <= 49.0) {
        return (color(0, 116, 255));
    }
    if (this.temp > 49.0 & this.temp <= 49.5) {
        return (color(5, 4, 254));
    }
    if (this.temp > 49.5 & this.temp <= 50.0) {
        return (color(82, 82, 254));
    }
    if (this.temp > 50.0 & this.temp <= 50.5) {
        return (color(126, 125, 253));
    }
    if (this.temp > 50.5 & this.temp <= 51.0) {
        return (color(183, 183, 255));
    }
    if (this.temp > 51.0 & this.temp <= 51.5) {
        return (color(251, 245, 133));
    }
    if (this.temp > 51.5 & this.temp <= 52.0) {
        return (color(249, 221, 13));
    }
    if (this.temp > 52.0 & this.temp <= 52.5) {
        return (color(254, 202, 5));
    }
    if (this.temp > 52.5 & this.temp <= 53.0) {
        return (color(254, 88, 2));
    }
    if (this.temp > 53.0 & this.temp <= 53.5) {
        return (color(234, 2, 0));
    }
    if (this.temp > 53.5) {
        return (color(133, 0, 0));
    }
}

function playSound() { // chooses oscillator frequency based on mouse index line
    var mInd = int(mouseX / lineWidth);
    osc.freq(chooseSound(PGHannualAvg[mind]));
}

function chooseSound(temp) { // if statements based on temperature index
    if (temp <= 49.0) {
        return (70);
    }
    if (temp > 49.0 & temp <= 49.5) {
        return (80);
    }
    if (temp > 49.5 & temp <= 50.0) {
        return (120);
    }
    if (temp > 50.0 & temp <= 50.5) {
        return (160);
    }
    if (temp > 50.5 & temp <= 51.0) {
        return (200);
    }
    if (temp > 51.0 & temp <= 51.5) {
        return (240);
    }
    if (temp > 51.5 & temp <= 52.0) {
        return (280);
    }
    if (temp > 52.0 & temp <= 52.5) {
        return (320);
    }
    if (temp > 52.5 & temp <= 53.0) {
        return (360);
    }
    if (temp > 53.0 & temp <= 53.5) {
        return (400);
    }
    if (temp > 53.5) {
        return (440);
    } 
}

function drawTitle() { // draws black bar and title text
    rect(0, 325, 800, 100);
    fill(255);
    textSize(18);
    textFont(helveticaBold);
    text("1872", 10, 350);
    text("2020", 748, 350);
    stroke(255);
    line(61, 343, 738, 343);
    line(732, 337, 738, 343);
    line(732, 349, 738, 343);
    noStroke();
    text("Annual Average Temperatures: Pittsburgh", 235, 375);
}

function showMouseInfo() { // black hover rectangle with bar info
    var mInd = int(mouseX / lineWidth);
    noStroke();
    fill(255);
    if ((mouseY < 325) & (mouseX > 0) && (mouseX < width) && (mouseY > 0)) {
        noFill();
        stroke(255);
        strokeWeight(2);
        rect(mInd*lineWidth, 0, lineWidth, 325);
        if (mouseX < 725) {
            noStroke();
            fill(0);
            rect(mouseX + 20, mouseY, 65, 40);
            fill(255);
            textFont(helveticaBold);
            text(Year[mInd], mouseX+25, mouseY+18);
            textFont(helveticaLight);
            text(PGHannualAvg[mInd]+"°F", mouseX+25, mouseY+34);
        }
        else {
            noStroke();
            fill(0);
            rect(mouseX - 70, mouseY, 65, 40);
            fill(255);
            textFont(helveticaBold);
            text(Year[mInd], mouseX- 65, mouseY+18);
            textFont(helveticaLight);
            text(PGHannualAvg[mInd]+"°F", mouseX-65, mouseY+34);            
        }
    }
}

function draw() { // main draw function
    background(0);
    noStroke();
    makeLines();
    for (i = 0; i < numLines; i++) {
        lines[i].draw();
        fill(0);
    }
    drawTitle();
    showMouseInfo();
    var mInd = int(mouseX / lineWidth);
    osc.freq(chooseSound(PGHannualAvg[mInd]));
}

My program is a data visualization of Pittsburgh’s fluctuating average annual temperatures over time. I took data from the historical records of the Pittsburgh International Airport weather station from 1872 through 2020. Each of the colored bars represent a year and its average temperature. The colors represent the temperatures–the warmer the color, the hotter the temperature, and vice versa. The user can use their mouse cursor to hover over the bars and view information for that particular one–the year and temperature from that year. There is also an aspect of sound–the temperatures relate to a frequency level that plays when the user hovers over the bar. The higher the temperature, the higher the frequency that is played.

Note: I used external fonts uploaded via local files and displayed using a local server, but I’m not sure how to upload those so that WordPress can run them. I tried Imgur but they don’t support TrueType font files.

Project 9: Computational Portrait

sketch

//John Henley; jhenley; 15-104 section D

var img;
var smallPoint;
var largePoint;

function preload() {
    //loads image
    img = loadImage('https://i.imgur.com/JmBw9uk.jpg');
}

function setup() {
    createCanvas(331, 442);
    img.resize(img.width/3, img.height/3); //reduce size of image
    print(img.width);
    print(img.height);
    smallPoint = 4;
    largePoint = 40;
    imageMode(CENTER);
    noStroke();
    background(255);
    img.loadPixels();
}

function draw() {
    //Maps mouseX to point size range to pixels
    var pointillize = map(mouseX, 0, width, smallPoint, largePoint);
    //Calculates random pixel generation locations
    var x = floor(random(img.width));
    var y = floor(random(img.height));
    var pix = img.get(x, y);
    //Maps mouseY for to framerate range
    var yframes = map(mouseY, 0, height, 1, 200);
    fill(pix, 128);
    //Draws square pixels
    square(x, y, pointillize);
    //Changes frame rate
    frameRate(yframes);
}

I wanted the interaction on my portrait to be the speed at which the computer builds the portrait. I made this performed using the mouseY value: the user can move the mouse along the y-axis to change the frame rate. I also made it so the mouseX value determines the size of the square pixels used to build the picture.

Appearance of portrait when mouse cursor is at bottom right of canvas.
Appearance of portrait when mouse cursor is at bottom left of canvas.

LO9: A Focus on Women and Non-binary Practitioners in Computational Art

I researched the designer of physical computational devices kate Hartman.
Specifically, I was interested in her project “Botanicalls.” Created in
2006, the name implies the purpose of the device: a combination of
“botanicals” and “calls,” as in phone calls. The device Hartman developed
featured sensors that detected states of the house plant: moisture levels,
leaf droopness, leaf colors, etc. and translate them to a more human-
understandable language. Using custom-developed software, the device
emails and calls human users to notify the caretaker of the plant of these
statuses and translates them to what the plant needs: ex. more light,
more water, etc. I think this project is really cool as it bridges the
gap between the human and natural worlds. It’s especially beneficial for
people unfamiliar with caring for plants, as it guides them through the
process and deepens the connection and understanding of the plant world.
Kate Hartman is based in Toronto and works at OCAD University as a professor
of wearable and mobile technology. She studies wearable technology and
is passionate about making human interactions with the natural world more
connective and integrative through her products.

Hi!

LO8: The Creative Practice of an Individual

Lecturer: Sasha Costanza-Chock
https://www.schock.cc/

Eyeo 2019 – Sasha Costanza-Chock on Vimeo

Sasha Constanza-Chock (they/she) is a design researcher who works in the field of design justice through community-led processes. They focus on dismantling the matrix of domination and oppression through design processes. Constanza-Chock is the Director of Research and Design at the Algorithmic Justice League and is a associate professor at Harvard University in Cambridge, Massachusetts. I really admire their work in using the power of design thinking and solutions to dismantle the systems of oppression of white
supremacy, heteropatriarchy, capitalism, and settle colonialism. I’m really passionate about inclusive design, where co-designing with actual communities involved in the problems are given an opportunity to be involved in a fair and meaningful design process. In terms of the presentation itself, I really appreciated the way that Constanza-Chock broke down their topics into easily digestible and understandable segments.

Project 07: Curves

sketch

// John Henley; jhenley; 15-104 section D

function setup() {
    createCanvas(480, 480);
    background(0);
}

function draw() { // draw loop for each spiral
    background(0);
    translate(width/2, height/2);
    spiral1(); // calls spiral functions
    spiral2();
}

function spiral1() { // horizontal spirals
    beginShape();
    noFill();
    stroke(255);
    for (var t = 0; t <= 100; t += 20) { // for loop for inner rings
        for (var i = 1; i <= 100; i ++) { // loop for each spiral
            var theta = map(i, 0, 100, 0, TWO_PI);
            var a = map(mouseX, 0, width/2, 0, 1); // maps mouseX onto 0 - 1 scale
            var x = a * t * cos(theta)^20;
            var y = a * t * sin(theta);
            vertex(x, y);
            endShape();
        }
    }
}

function spiral2() { // vertical spiral
    beginShape();
    noFill();
    stroke(255);
    for (var t = 0; t <= 100; t += 20) { // for loop for inner rings
        for (var i = 1; i <= 100; i ++) { // loop for each sprial
            var theta = map(i, 0, 100, 0, TWO_PI);
            var a = map(mouseX, 0, width/2, 0, 1); // maps mouseX onto 0 - 1 scale
            var x = a * t * cos(theta);
            var y = a * t * sin(theta)^20;
            vertex(x, y);
            endShape();
        }
    }
}

I wanted to make my curves very sharp and dramatic rather than the traditional smooth spiral. I accomplished this by using the equation for a spiral (r*cos(theta)^x, parametrically) and adjusted the exponent value and values in the map function until I achieved the desire effect. Below are two separate states of the program: the first is when the mouse is far to the left of the canvas, and the second is when the mouse is far to the right.

LO7: Data Visualization

For my Looking Outwards, I picked a project done by the data visualization firm
Pitch Interactive. The project, Decoding Asian Hate, is an interactive data visualization that shows a timeline of Asian Hate incidents over the span of January 2020 to present. For the client The Asian American Foundation, Pitch Interactive turned these incidents into fragments of shattered glass. The shards of glass rotate in 3 dimensions around the screen. Users can click an individual shard, and it will bring up an overlay of the news article and date information. I think that this project sheds light on such a critical issue in a really unique and engaging format. Rather than just a raw text timeline, the designers made it into an experience that brings a raw emotive reaction that provides a completely more dramatic outcome to sway audiences.

https://www.pitchinteractive.com/work/DecodingAsianHate/
Pitch Interactive, 2021

Project 6: Abstract Clock

For my clock, I decided against breaking the idea of what a clock was. I wanted to keep the traditional conventions of what a clock is–12 hour face, hour/minute/second positions, etc., for readability and functionality purposes. I did, however, was to create something more abstract and engaging that might take a little time of discovery to immediately interpret the system.

sketch

// John Henley; jhenley; 15-104 section D

var secondAngle; // initializes arrays/variables
var secondX = [];
var secondY = [];
var minuteAngle;
var minuteX = [];
var minuteY = [];
var hourAngle;
var hourX = [];
var hourY = [];

function setup() {
    createCanvas(480, 480);
}

function draw() {
    background(255);
    var center_x = width / 2;
    var center_y = height / 2;
    noFill();
    stroke(255, 0, 0); // sets color settings
    strokeWeight(2);
    push();
    translate(center_x, center_y);
    
    
    secondAngle = map(second(), 0, 59, 0, 360) - 90; // maps second 0 - 60 onto 360 degree scale
    for (i = 0; i < 10; i++) { // generates radian position for second, plus larger triangles
        secondX[i] = i*100*cos(radians(secondAngle));
        secondY[i] = i*100*sin(radians(secondAngle));
    }

    minuteAngle = map(minute(), 0, 59, 0, 360) -90; // maps minute 0 - 60 onto 360 degree scale
    for (i = 0; i < 10; i++) { // maps radian position for minute, plus larger triangles
        minuteX[i] = i*75*cos(radians(minuteAngle));
        minuteY[i] = i*75*sin(radians(minuteAngle));
    }

    currentHour = hour(); // adjusts 24 hour clock to 12 hour
        if (currentHour > 12) {
            currentHour = currentHour-12;
        }
    hourAngle = map(currentHour, 0, 12, 0, 360) - 90; // maps hour 0 - 12 onto 360 degree scale
    for (i = 0; i < 10; i++) { // maps radian position for hour, plus larger triangles
        hourX[i] = i*50*cos(radians(hourAngle));
        hourY[i] = i*50*sin(radians(hourAngle));
    }

    for (i = 0; i < 10; i++) { // draws triangles connected three points from each i array
        triangle(secondX[i], secondY[i], minuteX[i], minuteY[i], hourX[i], hourY[i]);
        color(255, 0, 0)
    }

    pop();
}

LO6: Randomness

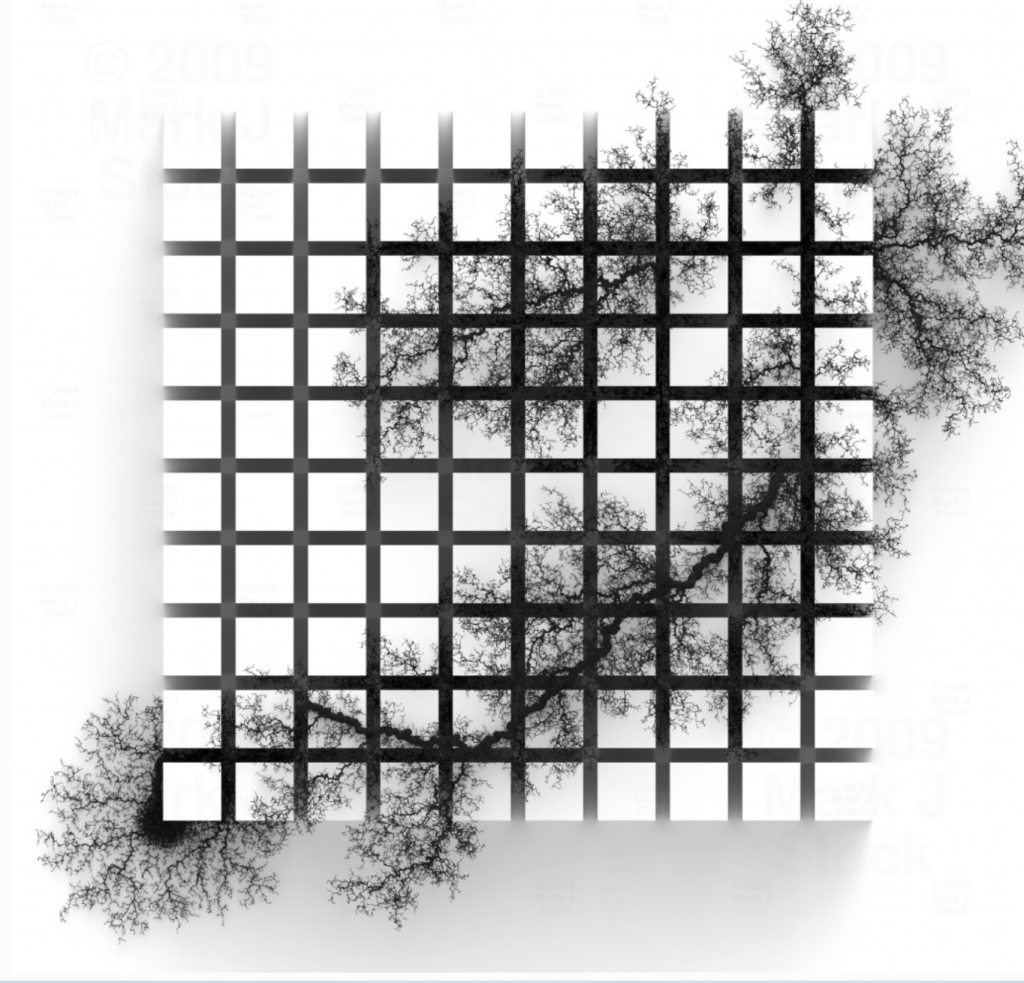
This week, I looked at the work of Mark J. Scott, a generative artist, programmer, and scientist. Specifically, I appreciated his piece “Sprawl,” which features a branching structure spanning an array of grid-like blocks. The piece was built by the computer that uses algorithms which grow the “legs” of the structure in random directions for random lengths–that is, until one leg
collides with another. I found the controlled randomness to be most interesting–the piece is very organic and chaotic, yet is controlled and seemingly constrained across the array of blocks.

Mark J. Stock (markjstock.com)

Mark J. Scott, “Sprawl,” 2009.

Project 5: Wallpaper

sketch

// John Henley; jhenley; 15-104 section D

function setup() {
    createCanvas(590, 395);
    background(0);
}

function draw() {
    for (var x = 10; x <= 590; x+= 30) { // vertical lines
        linesVertical(x);
    }
    for (var y = 10; y <= 390; y += 30) { // horizontal lines
        linesHorizontal(y);
    }
    for (var y = 10; y <= 390; y += 15) { // circles columns
        for (var x = 10; x <= 590; x+= 15) { // circles rows
            circles(x, y);
        }
    }
noLoop();
}   

function circles(x, y) { //circle function
    stroke(0);
    fill(random(0, 255));
    circle(x,y,random(5, 15));
}

function linesVertical(x) { //vertical lines function (random lengths)
    stroke(255);
    line(x, random(0, 390), x, random(0,390));
}

function linesHorizontal(y) { //horizontal lines function (random lengths)
    line (random(0, 590), y, random(0,590), y)
}

For my wallpaper, I wanted to make a row of lit up circles, almost like an old-fashioned light-up sign. Each of the circles is like a bulb, and despite the pattern with the “for” loops, I made it so the diameter of the circles was chosen randomly to make the image’s picture seemingly change with each refresh. To add visual interest, I added perpendicular lines, chosen with random lengths, cutting through the circles.

LO5: 3D Computer Graphics

I really admire the work by artist and designer Jon Noorlander. He explored 3D
generative forms in a beautifully fantastical and fun way. One specific example of his work was his piece entitled “Slime.” The piece itself is simply a looping aninimation of two balls of pink slime mushing and pulling across the canvas. However, it is very satisfying to watch, and is simply a fun animation. Noorlander engages bold, strong colors to create pieces that are engaging and exciting to watch and discover. While I’m not sure exactly, I imagine that the piece was rendered in Cinema 4D similar program to achieve the surface texture and reflections.

Slime. – Jon Noorlander | Design & Direction

Jon Noorlander – “Slime”