![[OLD SEMESTER] 15-104 • Introduction to Computing for Creative Practice](../../wp-content/uploads/2023/09/stop-banner.png)
//thien le, section d, project

var pressValue = 255;
var circValOne = 255;
var circValTwo = 255;
var circValThree = 255;
var cityImg;
var iceImg;
var forestImg;
var smoke = [];
var x;
var y;
var dx;

function preload() {
  cityImg = loadImage ("https://i.imgur.com/hmWYq6y.png")
  iceImg = loadImage ("https://i.imgur.com/bcdmnoM.png12")
  forestImg = loadImage ("https://i.imgur.com/SiHq9rT.png")
}


function setup() {
  createCanvas(550, 300);
  background("#edc399");
  //smoke
  for (var i = 0; i < 80; i ++) {
        var startLocX = random(0, 270);
        var startLocY = random(0, 300);
        smoke[i] = makesmoke(startLocX, startLocY);
    }

//clouds
  x = int(random(0, 270));
  y = int(random(250, 300));
  //random colors
  //velocity of cloud
  dx = int(2);
  dy = int(5);
}

function draw() {
  screenText();
  threeButtons();
  cloud(x, y, dx);
    x += dx;
    //once cloud hits the right, it switches side
    if (dx >= 0 & x > 250){
        dx = -dx
    }
    else if (dx < 0 && x - 10 < 0){
        dx = -dx
    }

}


function screenText() {
  push();
  fill(255);
  textSize(8);
  text('P R E S S  1 ,  2 ,  O R  3  O N  K E Y B O A R D  T O  S T A R T !', 300, 30)
  pop();
}

function aOrB() {
  push();
  fill(255);
  textSize(10);
  text("A", 355, 255)
  text("B", 470, 255)
  pop();

}
function choiceText() {
  push();
  fill(255);
  textSize(8);
  text('P R E S S  A  O R  B  T O  C H O O S E', 350, 270);
  pop();
}

function badChoice() {
  push();
  fill("red");
  textSize(15);
  textStyle(BOLD);
  text('CONTINUE PRESSING B', 340, 260);
  pop();
}
function threeButtons() { //buttons that will display 3 facts about climate change
    noStroke();
    fill(circValOne);
    circle(350, 70, 50, 50);
    fill(circValTwo);
    circle(420, 70, 50, 50);
    fill(circValThree);
    circle(490, 70, 50, 50);
}

function keyTyped() {
  //city
  if (key === '1') {
    circValOne = ("#cc7161");
    circValTwo = 255;
    circValThree = 255;
    fill(255);
    image(cityImg, 0, 0, 270, height);
    cityButton();
    cityFact();
    choiceText();
    aOrB();
    //ice
  }
  if (key === 'a') {
    background("#014421");
    push();
    textSize(15);
    textAlign(CENTER);
    fill(255);
    text('YAY YOU SAVED THE EARTH!', 150, 150)
    pop();
  }
  if (key === 'b') {
     smokeDisplay();
     badChoice();
  }
  if (key === '2') {
    circValTwo = ("#cc7161");
    circValOne = 255;
    circValThree = 255;
    image(iceImg, 0, 0, 270, height);
    iceButton();
    iceFact();
    choiceText();
    //forest
  }
  else if (key === '3') {
    circValThree = ("#cc7161");
    circValTwo = 255;
    circValOne = 255;
    image(forestImg, 0, 0, 270, height);
    forestButton();
    forestFact();
    choiceText();
  }
}

function cityButton(){
  push();
  rectMode(CENTER);
  fill("#638a7e");
  rect(360, 200, 100, 80, 20);
  rect(480, 200, 100, 80, 20);
  pop();
  push();
  textAlign(CENTER);
  fill(255);
  text('Walk, bike, or take public transportation', 310, 180, 100, 80);
  text('Drive personal vehicle', 430, 185, 100, 80);
  pop();
}

function iceButton(){
  push();
  rectMode(CENTER);
  fill("#638a7e");
  rect(360, 200, 100, 80, 20);
  rect(480, 200, 100, 80, 20);
  pop();
  push();
  textAlign(CENTER);
  fill(255);
  text('Utilize smart power in homes', 310, 185, 100, 80);
  text('Leave lights on everywhere', 430, 185, 100, 80);
  pop();
}

function forestButton(){
  push();
  rectMode(CENTER);
  fill("#638a7e");
  rect(360, 200, 100, 80, 20);
  rect(480, 200, 100, 80, 20);
  pop();
  push();
  textAlign(CENTER);
  fill(255);
  text('Encourage politicians to fund parks', 310, 180, 100, 80);
  text('Use lots of paper', 430, 190, 100, 80);
  pop();
}

function cityFact() {
  push();
  rectMode(CENTER);
  fill("#edc399");
  rect(420, 130, 230, 60);
  pop();
  push();
  textAlign(CENTER);
  fill(255);
  //climate fact
  fill(255);
  text('Each year 1.2 trillion gallons of untreated sewage, stormwater, and industrial waste are dumped into US water', 310, 107, 230, 100);
  pop();
}

function iceFact() {
  //climate fact
  push();
  rectMode(CENTER);
  fill("#edc399");
  rect(420, 130, 230, 60);
  pop();
  push();
  textAlign(CENTER);
  fill(255);
  //climate fact
  fill(255);
  text('95% of the oldest and thickest ice in the Arctic is already gone', 310, 115, 230, 100);
  pop();
}

function forestFact() {
  //climate fact
  push();
  rectMode(CENTER);
  fill("#edc399");
  rect(420, 130, 230, 60);
  pop();
  push();
  textAlign(CENTER);
  fill(255);
  //climate fact
  fill(255);
  text('Deforestation emits more greenhouse gas emissions than 85 million cars would over their entire lifetime', 310, 107, 230, 100);
  pop();
}

//smoke object
function drawsmoke() {
    noStroke();
    //fill(255);
    push();
    translate(this.x, this.y);
    fill(200, 200);
    ellipse(1, 10, this.starH, this.starH);
    pop();
}

function makesmoke(startLocX, startLocY) {
    var smoke = {x: startLocX,
               y: startLocY,
               starH: random(10, 30),
               speed: -1,
               move: smokeMove,
               draw: drawsmoke}
    return smoke;
}

function smokeMove() { //update position of smoke
    this.x += this.speed
    if (this.x <= 0) {
        this.x += 50
    }
}

function smokeDisplay() {
     for(i = 0; i < smoke.length; i ++) {
        smoke[i].move();
        smoke[i].draw();
    }
}

//cloud
function cloud(x, y, dx) {
    fill(200, 200);
    ellipse(x - 30, y + 20, 20, 20)
    ellipse(x - 15, y + 10, 30, 40)
    ellipse(x + 5, y + 5, 20, 30)
    ellipse(x, y, 20, 10)
}Author: Trex
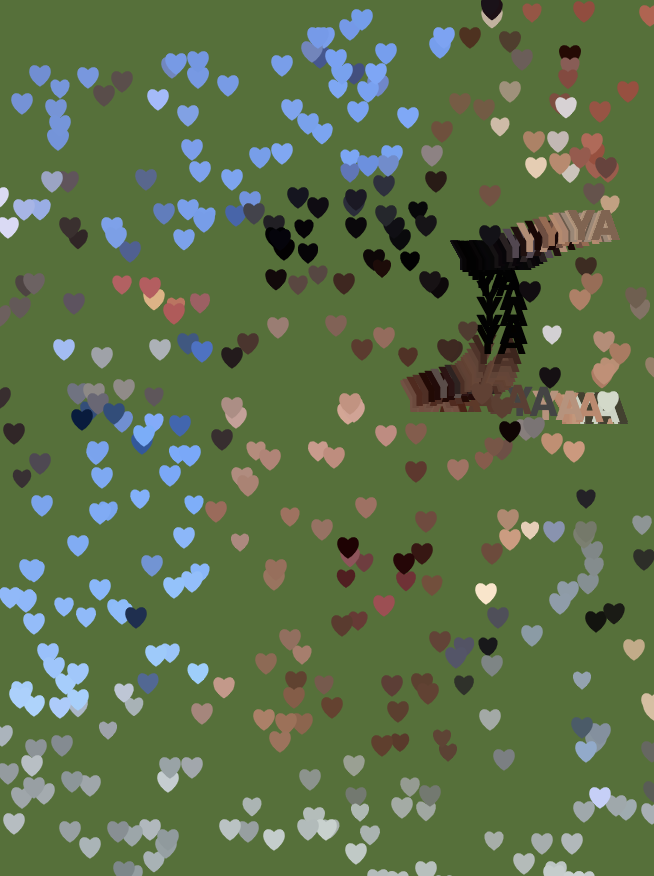
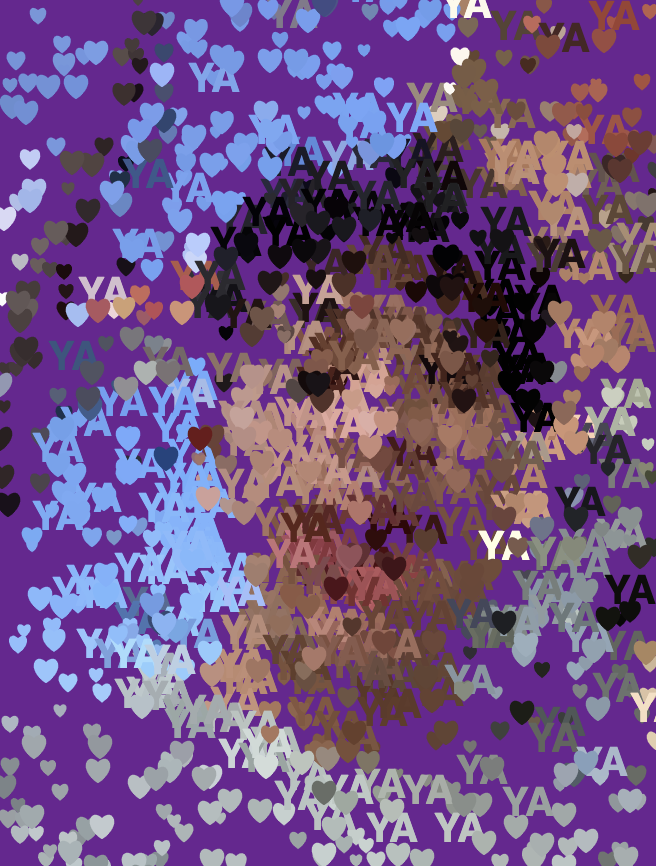
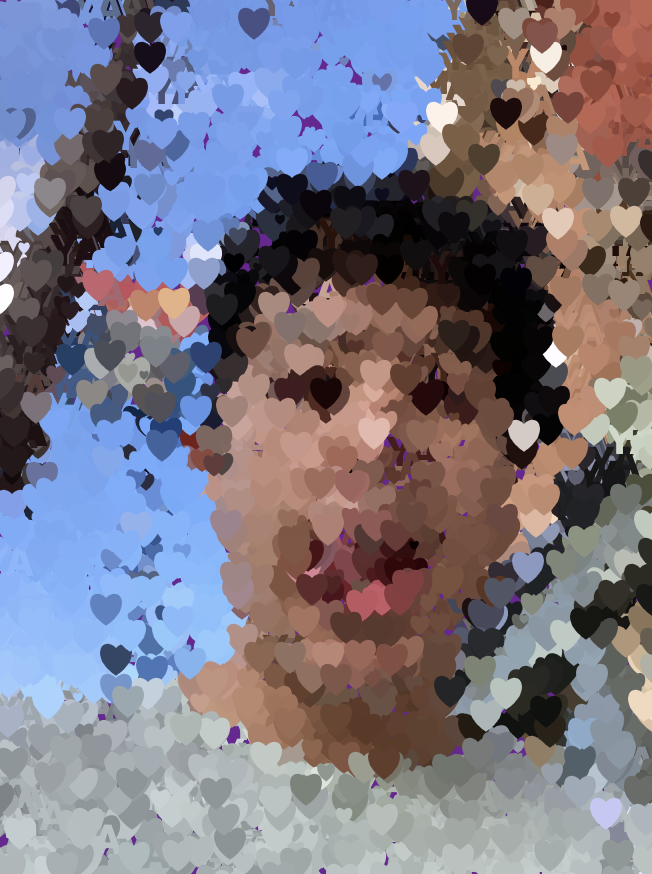
Project 9
var img;

function preload() {
    img = loadImage("https://i.imgur.com/mbg1U1D.jpg");
}

function setup() {
    img.resize(img.width/7, img.height/7);
    createCanvas(img.width, img.height);
    smallPoint = 4;
    largePoint = 10;
    //imageMode(CENTER);
    noStroke();
    img.loadPixels();
    textAlign(CENTER);
    text("CLICK TO CHANGE COLOR",width / 2,height / 2)

}

function draw() {
    //fill with heart
    let pointillize = map(mouseX, 0, width, smallPoint, largePoint);
    let x = floor(random(img.width));
    let y = floor(random(img.height));
    let pix = img.get(x, y);
    fill(pix, 10);
    heart(x, y, pointillize, pointillize);
    var cols = img.get(mouseX, mouseY);

    //fun text fills image according to mouse
    fill(cols);
    textStyle(BOLD);
    textSize(20);
    text("YA", mouseX, mouseY);
}

function heart(x, y, size) {
  //custom shape
  beginShape();
  vertex(x, y);
  bezierVertex(x - size / 2, y - size / 2, x - size, y + size / 3, x, y + size);
  bezierVertex(x + size, y + size / 3, x + size / 2, y - size / 2, x, y);
  endShape(CLOSE);
}

function mousePressed() {
    //background color changes
    background(color(random(255), random(255), random(255)));
}
Once I figured out how to make this project more creative, it was more fun to create. The text that follows the mouse to fill in the image was fun to play around with.
LO 9
Website: https://claudiahart.com/Alice-XR-2019
Artist: Claudia Hart
Work: https://claudiahart.com/Alice-Unchained-XR-2018
Year: 2018
The artist that I wanted to research this week was Claudia Hart. Hart attended NYU and was an early adopter of virtual imaging, using 3D animation to make media installations and projections. She creates work that discusses digital technology and critiques media through a feminist lens. One project in particular that I found interesting is titled “Alice XR: A Machine For Thinking”.
This work is a room installation that consists of projections and is accessed using a VR headset. One thing I find particularly interesting is that this room is a room for thinking, repose, and contemplation. Often with these works, artists want to create an experience for users that is interesting and unique, but with this work, she wants to create an experience that allows people to contemplate their life. The combination of motion, music, and visuals in this virtual space merges to create a very visceral experience. In terms of design, I think that the use of color and imagery that Hart created is very beautiful because of how bright and vivid it is.
LO 8
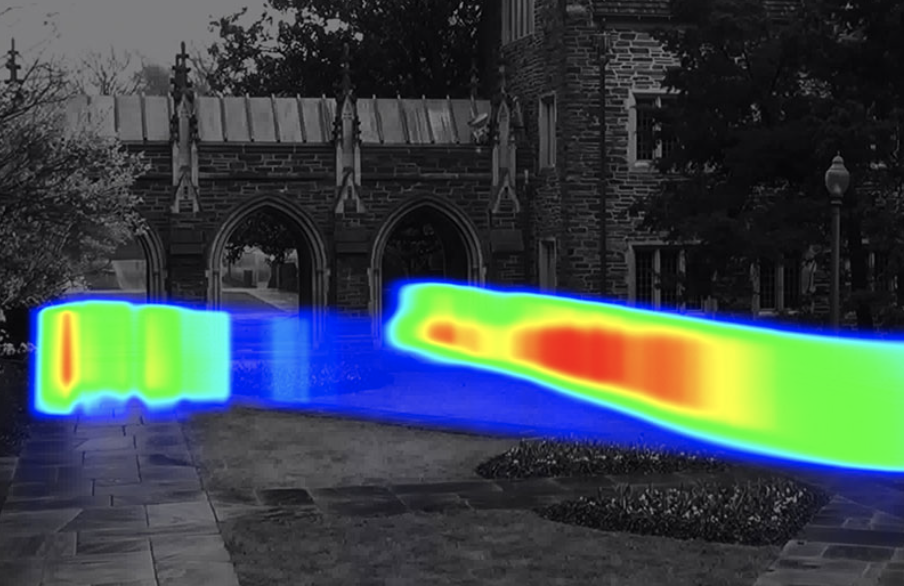
Adam Harvey is an artist based in Berlin. He graduated from the ITP program at NYU and before that, he majored in engineering and photojournalism at Penn State. His work focuses on computer vision, digital imaging technologies and he often gives talks about data and computer vision. Many of his works center around the idea that the collection of images of people has become normalized, however it is still largely unregulated and problematic because they may not know what their images are being used for or even if images of them are being captured. I find his works interesting because they explore implications of invasions of privacy and with his work, how visualizations and reports can allow people to understand how images are being used to power the facial recognition industry. One project in particular, Researchers Gone Wild, showcases discoveries made during his other research project, MegaPixels, but it makes the information more visual. Additionally, when looking at how he presents his research projects, I noticed that there was not a lot of text on the screen and was more visual which is something that I could incorporate into my presentations because it is more engaging for viewers.
Project 07: Composition with Curves
function setup() {
    createCanvas(400, 400);
    background(220);
}

function draw() {
    background(0);
    //moves epicycloid to center
    translate(width / 2, height / 2);
    epicycloid();
}

function epicycloid() {
    // https://mathworld.wolfram.com/EpicycloidInvolute.html
    var x;
    var y;
    var a = map(mouseX, 0, width, 300, 80);
    var b = map(mouseY, 0, height, 100, 10);
    strokeWeight(2); //line weight
    stroke(10, mouseX, mouseY); // color of epicycloid
    noFill();

    //epicycloid
    beginShape();
    for (var i = 0; i <= 500; i ++) {
        var theta = map(i, 0, 500, 0, TWO_PI);
        x = (a + b) * cos(theta) - b * cos((a + b / b) * theta);
        y = (a + b) * cos(theta) - b * sin((a + b / b) * theta);
        vertex(x, y);
    }
    endShape();
}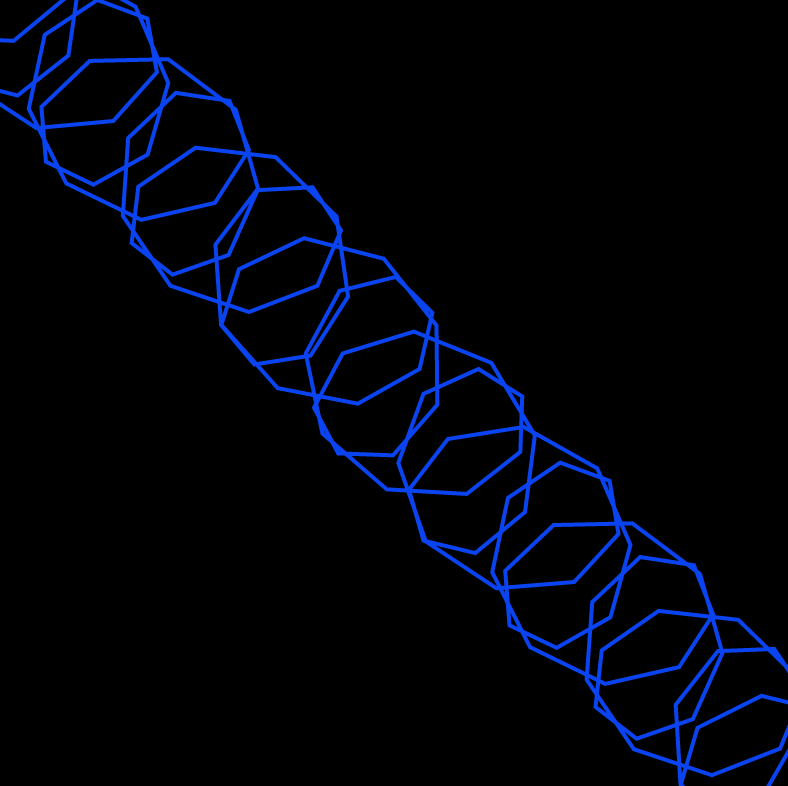
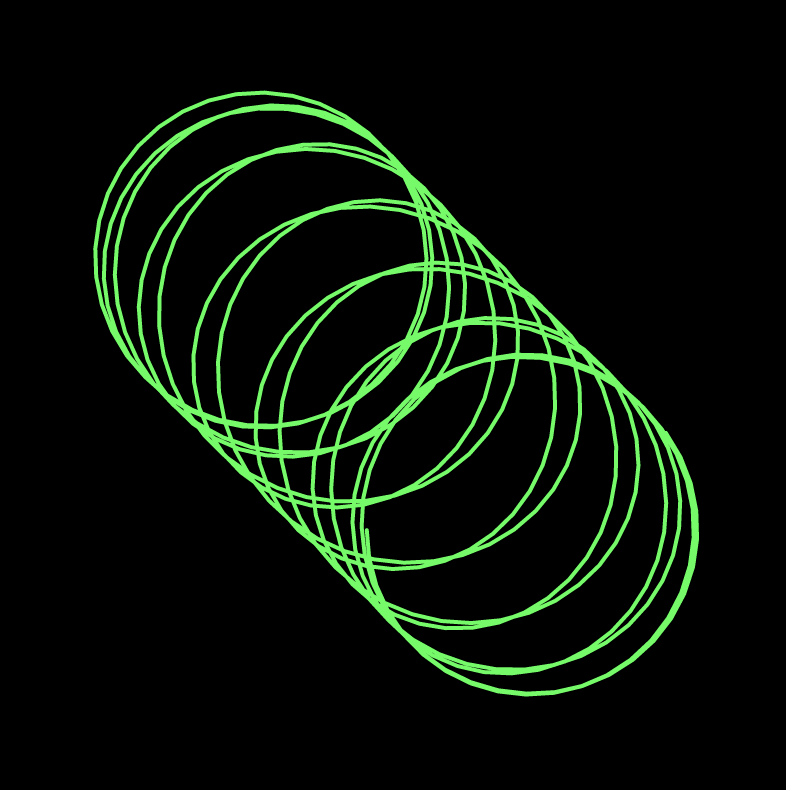
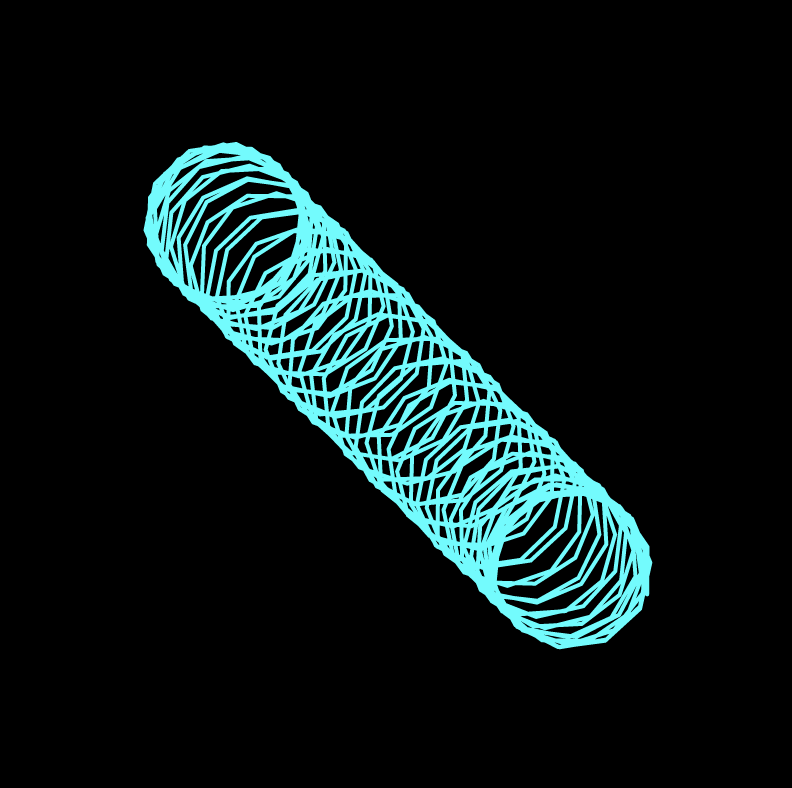
I think that the hardest part of this project was trying to find a curve on the website that was in parametric form. Figuring out how to make that formula more dynamic in this composition was also difficult. The curve that I ended up choosing was an epicycloid. In the way that I wrote the code, I like how it can be very simple with just a few circles but as the user moves the mouse, it create more interesting shapes which is really fun.
LO 7: Information Visualization
Title: WHO Immunization Progress Reports
Year: 2020
Artist: Stamen
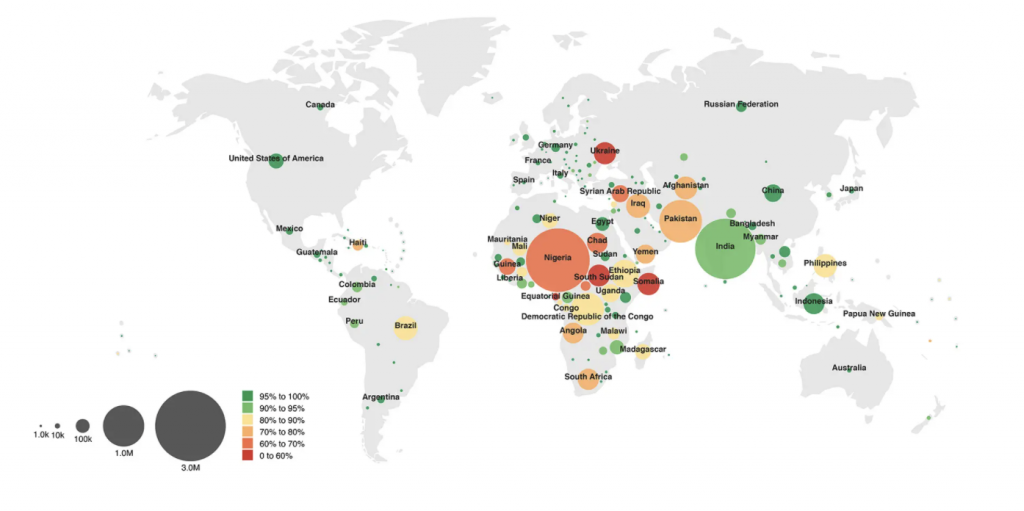
Stamen is a data visualization design agency that combines creativity and fun with utility. I also think that information can also be shown in creative ways which is why I wanted to look into a project that they created. One that I think is cool is the World Health Organization immunization Progress Report in which Stamen created data visualization of the world and their immunization progress. The compelling visualizations that they created tell a story of countries that have made significant progress in their immunizations. Data, especially data that involves other countries should be visualized because they are an easy way for people who speak different languages to understand information. Because Stamen is working with WHO, I think that their visualization was a smart and creative way to visually tell this story in a way that is accessible for everyone to see. Although these visualizations don’t solve the problem of increasing immunizations in countries, designing a way that people can see that these countries are struggling can lead to more solutions.
Project 6: Clock
function setup() {
    createCanvas(350, 350);
}

function draw() {
    background(225, 213, 197);
    var s = second();
    var h = hour();
    var m = minute();
    mini(m); //blue circles (minute)
    horse(h); // black rectangle (hour)
    circ(s); // yellow circle (seconds)
}

//yellow circle grows according to seconds and red rectangle gets longer
function circ(s) {
    noStroke();
    fill("orange")
    ellipse(175, 175, s * 3, s * 3);
    fill(209, 54, 48)
    rect(50, 0, 30, s * 6)
    //rect(300, 0, 30, s * 6)
}

//blue circles grow according to the minute
function mini(m) {
    noStroke();
    fill(37, 105, 193)
    ellipse(0, 175, m * 6, m * 6)
    ellipse(350, 175, m * 6, m * 6)
    //triangle(0, 350, m * 5, m * 5, 0, 0)
}

//hour is represented by black rectangle, width and height grow every hour
function horse(h) {
    noStroke();
    rectMode(CENTER);
    fill("black")
    rect(175, 80, h * 5, h * 5)
}
This project was a doozy. I decided to make it in the style of Bauhaus because to me that it was abstract design encompasses. With this design that I made, the circle in the middle and the reed line correspond to the seconds, the square in the center corresponds to the hour, and the blue circles represent the minutes.
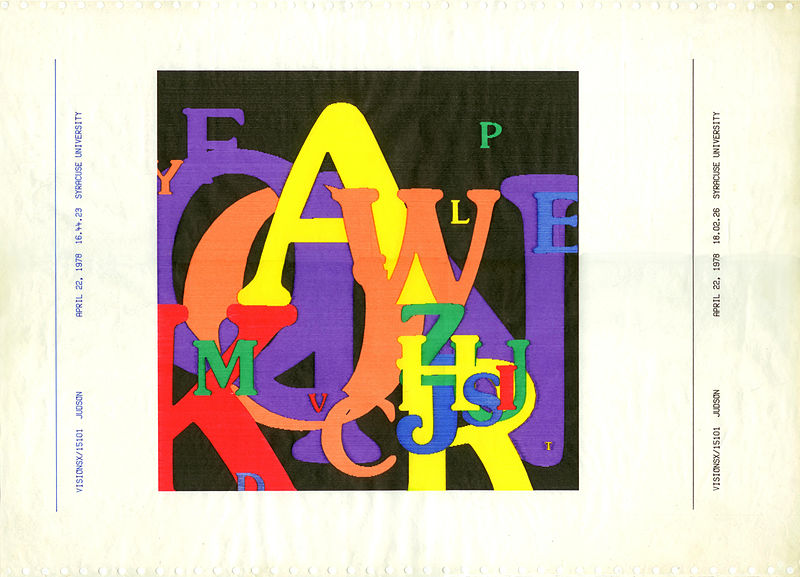
LO 6
Letterfield by Judson Rosebush was created in 1978. It was created by using a random number generator that had numbers that corresponded to the letter size, color, and position of the type that appeared. It was then outputted to a plotter and then physically printed. I think what intrigues me most about this piece is how it played with randomness computationally, and then a tangible item was produced from it. This allows the artist to use randomness and their creativity to not only have art exist in a digital format, but also in a physical way that could be used as a piece for historical study years to come which is almost exactly what I am doing right now. I think how this was done computationally was that variables were assigned to different things such as size, color, and position and then when calling that variable, a random function was used, generating very different compositions every single time.
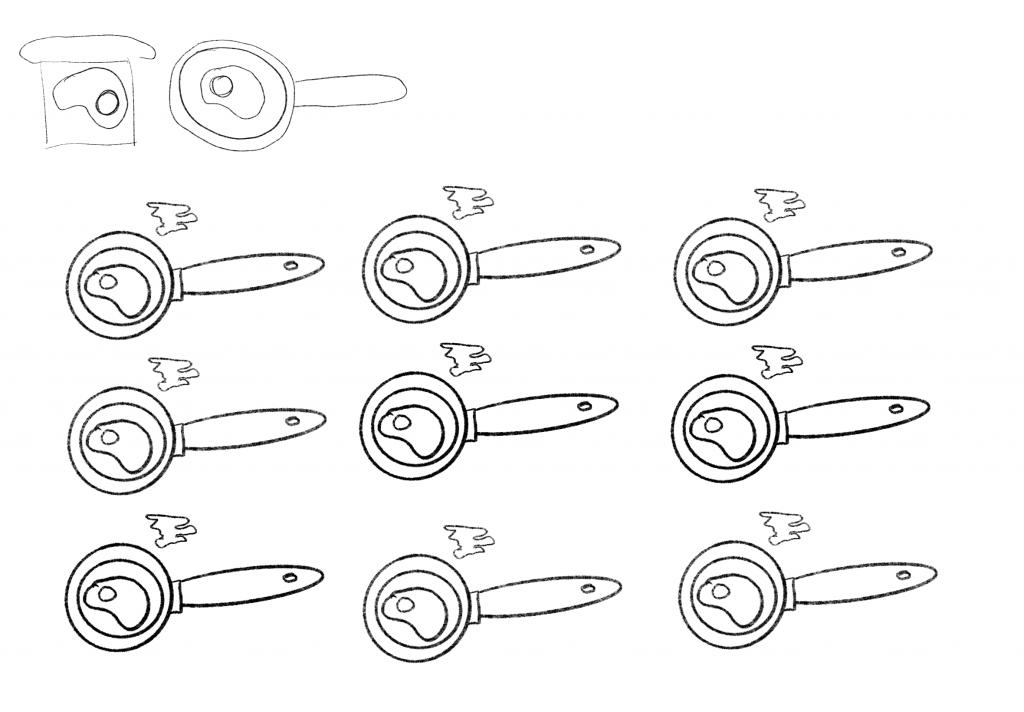
Project 5: Wallpaper
function setup() {
    createCanvas(600, 540);
}

function draw() {
    background(195, 230, 241);

    //steam
    for (var yUp = 85; yUp <= 500; yUp += 127) {
        for (var xUp = 75; xUp <= 600; xUp += 148) {
            steam(xUp, yUp);
        }
}

    //pan
    for (var yYah = 43; yYah <= 450; yYah += 128) {
        for (var xYah = 24; xYah <= 580; xYah += 148) {
            pan(xYah, yYah);
        }
    }

    //egg
    for (var y = 80; y <= 500; y += 128) {
        for (var x = 47; x <= 550; x += 148) {
            egg(x, y);
        }
    }

    //handle
    for (var yUp = 85; yUp <= 500; yUp += 127) {
        for (var xUp = 94; xUp <= 600; xUp += 148) {
            handle(xUp, yUp);
        }
}

function egg(x, y) {
    //whites
    noStroke();
    fill("white")
    circle(x + 3, y, 35)
    circle(x + 8, y + 5, 35)
    circle(x + 2, y + 7, 30)

    //shadow on whites
    //gray
    noStroke();
    fill(215, 215, 215)
    circle(x + 11.5, y + 8.5, 17)
    //white
    fill("white")
    circle(x + 8.5, y + 5.5, 21)

    //yolk shadow
    fill(222, 181, 67)
    circle(x - 2, y - 3, 13)

    //yolk
    noStroke();
    fill(237, 193, 72)
    circle(x -3, y - 3, 11)

    //yolk highlight
    noStroke();
    fill("white")
    circle(x - 4, y - 5, 3)
}

function pan (x, y) {
    //outer
    fill(161, 161, 161)
    circle(x + 30, y + 40, 76.5)

    //inner
    fill(0)
    circle(x + 30, y + 40, 72)

    //most inner
    fill(80, 80, 80)
    circle(x + 30, y + 40, 54)
}

function handle(x, y) {
    push();
    //translate(x,y)
    rectMode(CENTER);
    //rotate(radians(40))
    //handle
    fill(0)
    rect(x + 26, y, 55, 13, 10)
    //connector
    fill(196, 196, 196)
    rect(x, y, 6, 18, 2)
    pop();
    //hole
    fill(195, 230, 241)
    ellipse(x + 42, y, 10, 5)
}
}

function steam(x, y) {
    noStroke();
    //positive space
    fill(245, 250);
    ellipse(x + 5, y - 40, 35, 15)
    ellipse(x - 5, y - 50, 35, 14)
    ellipse(x - 3, y - 59, 30, 10)

    //negative space
    fill(195, 230, 241)
    ellipse(x - 3, y - 39, 28, 10)
    ellipse(x + 6, y - 50.5, 28, 9)
    ellipse(x - 13, y - 60, 28, 8)
}
This project was really fun. The hardest part was understanding what details should be added to make the wallpaper seem more dimensional and dynamic. The process was very additive in that I had to iterate a few times to see what was missing in the wallpaper compositionally.
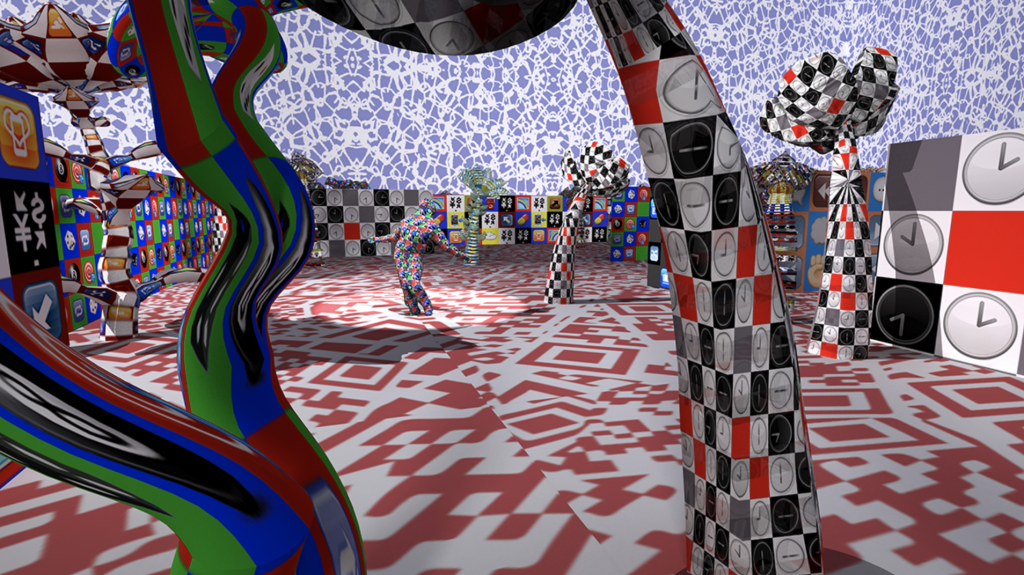
LO 5: 3D Computer Graphics
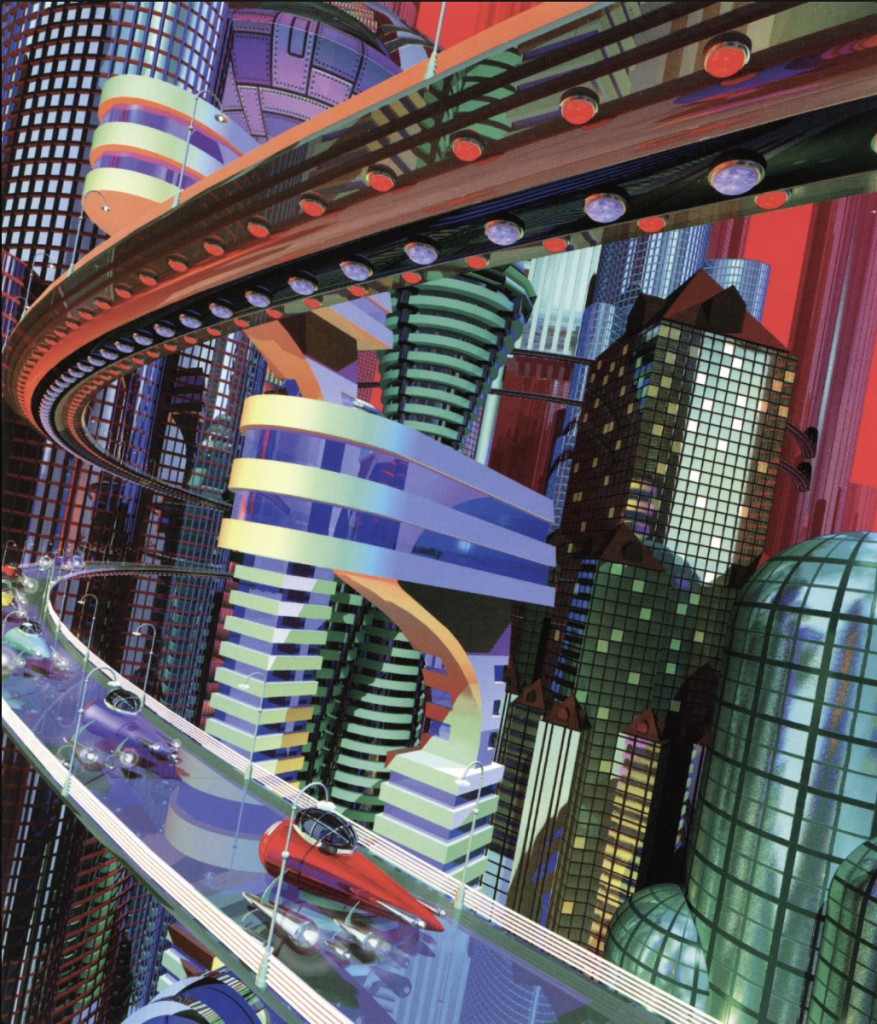
Link: https://y2kaestheticinstitute.tumblr.com/post/623999407028862976/collection-of-works-by-digital-artist-paul-wiley
Artist: Paul Wiley
Year: 1990s-2000s
Although I was not able to find titles to any specific pieces, the collection of 3D computer graphics that Paul Wiley created titled “FuturoCity” throughout the 1990s and 2000s. The scenes that he creates are vibrant and fantastical and creates a sense of fun and excitement. The art that is created with code is fun and although its style is considered outdated now, I think they are still interesting to look at now because of how quickly the world of computer generated images have changed. Wiley’s artistic style is captured well in this medium because it allows for relatively quick generations of fantastical landscapes that would take much longer if done by hand as it would have back then.