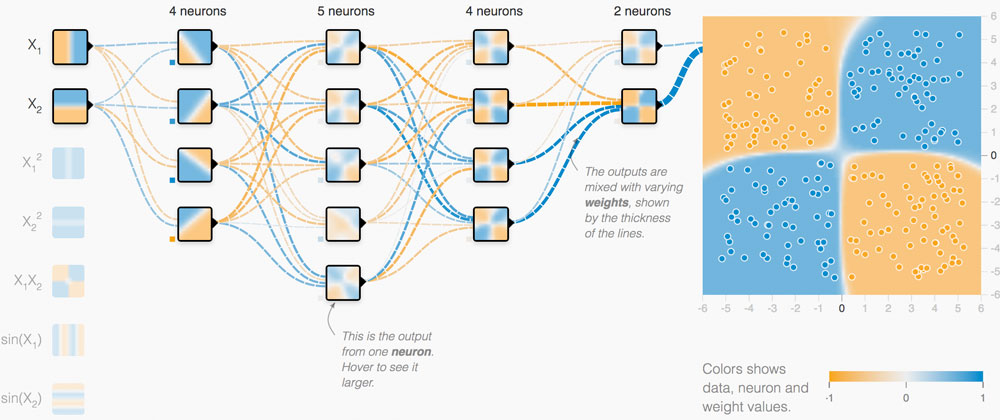
One of the projects I found very interesting has to be the ones done by “Martin Wattenberg” to help better visualize the information being processed by machine learning. One of the scariest things about machine learning is the idea of separating the human from the machine. In a way, the concept of “self-learning” machines is a scary one too many people, and often is portrayed as the end of humanity in various movies and TV shows. However, using the visualizations by Wattenberg, we are able to better understand what goes on inside the machine learning code and what kinds of decisions are being made. On top of helping us better understand the inner workings of machine learning code, Wattenberg also created a way for engineers and scientists to learn about machine learning systems. The future of automation and the tech industry seems to revolve around machine learning; however, it takes a lot of prior computer science knowledge to fully understand it. With this visualization, Wattenberg has made it much easier to visualize and conceptualize the powers of machine learning.
Category: SectionA
Project 07 Curves
When I saw the bean curve on the website, I knew i had to do it since it was pretty cute. After coding it in, I realized my bean did not look like a bean, and it turns out its becuase I had to be careful translating the math equations in way that the code would understand. After, I figured it out, I realized just drawing one bean was too simple, so I had to draw alot of them. Taking inspiration from the spots on canvas example, I was able to create the project below.
var ex = [];
var ey = [];
var points = 100;
function setup() {
createCanvas(480, 480);
frameRate(10);
text("p5.js vers 0.9.0 test.", 10, 15);
}
function draw() {
//Picked the bean curve to do the project
background("green");
//translate(width/2,height/2);
for (var i = 0; i < ex.length; i++){
push();
translate(ex[i], ey[i]);
drawBeanCurve();
pop();
}
}
function mousePressed(){
ex.push(mouseX);
ey.push(mouseY);
}
function drawBeanCurve(){
var x;
var y;
var a = mouseX;
var t = mouseY;
fill("purple");
beginShape();
for (var i = 0; i < points; i++){
t = map(i,0,points,0,TWO_PI);
x = a*(cos(t)*((sin(t)**3)+(cos(t)**3)));
y = a*(sin(t)*((sin(t)**3)+(cos(t)**3)));
vertex(x,y);
}
endShape(CLOSE);
}
LO7
Link of the project:https://benfry.com/genomevalence/
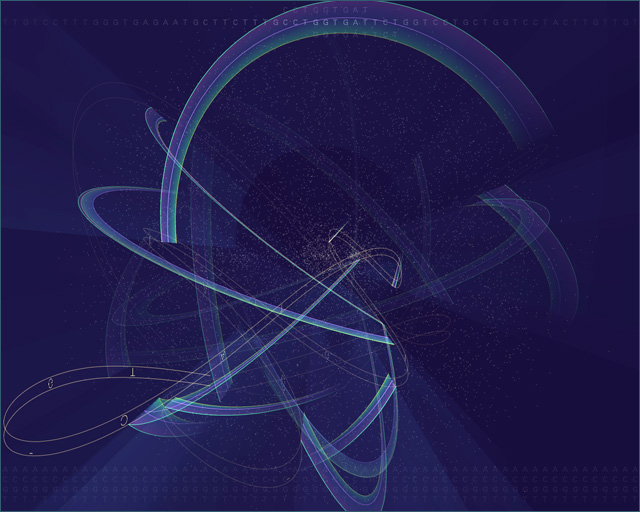
This project is called genome valence by Ben Fry, which is a visual representation of the algorithm most commonly used for genome searches.
The genome of an organism is made up of thousands of genes (34,000 for the human, 20,000 for the mouse, and 14,000 for the fruitfly). A gene is made up of a sequence of As, Cs, Gs, Ts that averages 1000 to 2000 letters apiece. To handle this amount of information, the BLAST algorithm breaks each sequence of letters into 9 letter parts. Every unique nine-letter set is represented as a point on the screen. I’m very surprised by the complexity of the project. The creator’s artistic sensibilities are manifest through the integration of biology, computer science, and art.
Project 7
var nPoints = 500
function setup() {
createCanvas(400, 400);
background(220);
text("p5.js vers 0.9.0 test.", 10, 15);
frameRate(100)
}
function draw() {
//background color varies with mouse X and mouse Y
background(map(mouseX,0,width,0,144),map(mouseY,0,width,0,122),255)
translate(25,25)
//draw the 16 devil's curves
for (x = 25; x < width; x += 100){
for (y = 25; y < height; y += 100){
push()
translate(x,y)
drawDevilCurve()
pop()
}
}
}
function drawDevilCurve(){
//Devil's Curve
//https://mathworld.wolfram.com/DevilsCurve.html
var x;
var y;
var a = mouseX/15;
var b = constrain(mouseY/5, 0, a*100);
fill(max(min(0,width),mouseX/2),max(min(0,width),mouseY/2),255);
beginShape();
for (var i = 0; i < nPoints; i++) {
var t = map(i, 0, nPoints, 0, TWO_PI);
x = cos(t) * sqrt((sq(a) * sq(sin(t)) - sq(b) * sq(cos(t))) / (sq(sin(t)) - sq(cos(t))));
y = sin(t) * sqrt((sq(a) * sq(sin(t)) - sq(b) * sq(cos(t))) / (sq(sin(t)) - sq(cos(t))));
vertex(x, y);
}
endShape(CLOSE);
}
I used Devil’s curve because i was intrigued by its name, and the demonstration of devil’s curve on the website is really fancy so i wanted to try it out. I made one devil’s curve first, and played with how the mouse would affect the shape of it. After having that one devil’s curve, i thought that i might be able to make a kaleidoscope using devil’s curves. So I wrote an for loop, and I changed the mouse X mouseYs to make sure that there would be significant changes when we move mouse X and mouse Y no matter where the mouse is ( i’m saying this because previously some manipulations of mouse X and mouse Y may not greatly impact the picture).
Looking Outwards 07
A particular work that I find very interesting is ‘FORMS – String Quartet’ by Playmodes. It is a “live multimedia performance for a string quartet, electronic music and panoramic visuals, in the field of visual sonification”(Visnjic 2021). They are able to create performances that are visually appealing that are controlled by the sound they were creating. In a sense, it was such a great experience watching them because it was so cool how the lights and images were adding to the meaning of the song. It is done by a generative system that creates endless, unrepeatable graphic scores that are immediately transformed into sound. The software that’s used is “coded in processing where the image sonification was done in Max/MSP. Hardware in this performance is comprised of a 3840*1080 pixels LED screen, aMacbook Pro with RME Fireface UCX soundcard, stereo sound system + subwoofers, a series of DPA 4099 microphones and two violins, one viola and a cello”(Visnjic 2021).Overall, I really enjoyed their performances.
Website: https://www.creativeapplications.net/maxmsp/forms-string-quartet/
LO-06
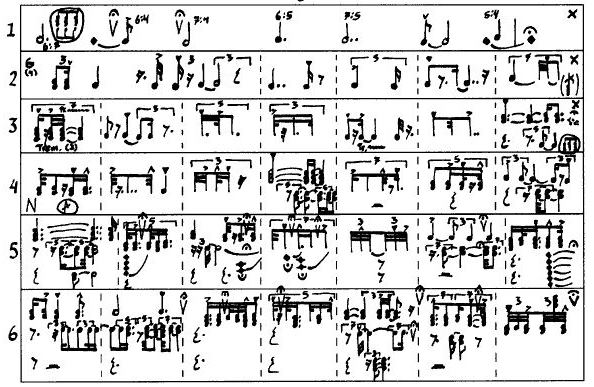
Karlheinz Stockhausen’s KLAVIERSTÜCK XI
I chose to write about German composer Karlheinz Stockhausen’s KLAVIERSTÜCK XI for this week’s Looking Outward assignment. Klavierstück XI consists of 19 fragments spread over a single, large page. The performer may begin with any fragment, and continue to any other, proceeding through the labyrinth until a fragment has been reached for the third time, when the performance ends. This means that there is an almost unimaginable number of versions. This huge number of options stems from the fact that it is an “open-form” composition. The nineteen fragments are then distributed over the single, large page of the score in such a way as to minimize any possible influence on spontaneity of choice and promote statistical equality. While this is not completely “truly” random, it still is similar to randomness. I think this piece by Karlheinz Stockhausen is extremely interesting and think you should look in to it more, as there is lots to learn!
Project-06
/* Nami Numoto
* Section A
* mnumoto@andrew.cmu.edu
* Project 06 - Abstract Clock
*/
var x = [];
var y = [];
var s = 25;
var side = 10
var s;
var m;
var h;
//160, 160, 160
function setup() {
createCanvas(480, 480);
rectMode(CENTER);
frameRate(1);
stroke("white");
}
function circles(x, y) {
fill(3,122,118); //squid game green
ellipse(x, y, 10);
}
function triangles(x, y) {
fill(237, 27, 118); //squid game pink
triangle(x - side / 2, y - side * sqrt(3) / 2, x - side, y - 0, x - 0, y - 0);
}
function squares(x, y) {
fill(255);
rect(x, y, 30, 30);
}
function draw() {
clear();
background(0); //black background
s = second();
m = minute();
h = hour();
for (i = 0; i < h; i++) { // draw same # of shapes as hrs, mins, sec
x[i] = random(10, 150);
y[i] = random(10, 470);
squares(x[i], y[i]);
}
for (j = 0; j < m; j++) {
x[j] = random(170, 330);
y[j] = random(10, 470);
triangles(x[j], y[j]);
}
for (k = 0; k < s; k++) {
x[k] = random(340, 470);
y[k] = random(10, 470);
circles(x[k], y[k]);
}
}
I made a clock inspired by the Netflix show “Squid Game” – I used the colour palette of the outfits they wear as well as the shapes that represent ranks of the people running the game.
No spoilers 🙂
The circles (lowest rank symbol) represent seconds, triangles (soldiers) minutes, and squares (managers) hours.
I decided to make all of the shapes move at random within certain bounds to indicate controlled chaos, which pretty much sums up the dystopian narrative of Squid Game.
I haven’t watched it all yet, so PLEASE DON’T TELL ME ANYTHING ABOUT IT YALL
Looking Outwards 06
I found a generative computational artist named Anders Hoff (aka inconvergent) – he uses circles and convergent points to create an algorithm that mimics branches of a tree, all encompassed in a circular canvas.
The program ‘decides’ whether to collide or create a new branch, thus creating both intersection and deviation points to simulate a natural-looking plant.
The size of the branches also impacts the variability as well as the form, as the smaller branches have to respond to the larger branches that have already been drawn.
I think this is a cool way to bring computing and art together, and the detail that the artist includes (smaller branches are more concentrated and have comparable ‘mass’ to larger branches) is indicative of his dedication to making his algorithm match realities of the natural world.
Project 6
I used the rotation of the hexagons and pointer to represent second hand; smallest circles also represent second hand, middle size circles represent minute hand, and largest circles represent hour hand. The background changes from dark to white every 24 hours representing a day. It is fun to think of various representations of time.
function setup() {
createCanvas(480, 480);
background(220);
text("p5.js vers 0.9.0 test.", 10, 15);
frameRate(1)
angleMode(DEGREES)
rectMode(CENTER)
}
var s = [100,20,100]
var angles = 0
var angles1 = 150
var angles2 = 150
var radius = 0
var colorBackground = 0
var angleEllipse1 = 0
var angleEllipse2 = 0
var angleEllipse3 = 0
function draw() {
background(colorBackground)
//background color changes from black to white and resets every day
if(colorBackground <= 255){
colorBackground += 255/24/3600
}
if(colorBackground >= 255){
colorBackground = 0
}
//background strings
stroke(200,200,220);
strokeWeight(.4)
for (var x = 0; x <= 50; x += .3) {
line(480, 50, 480/50 * x - 3, 0); //right upwards lines
}
for (var x = 20; x <= 80; x += .3) {
line(480, 50, 480/40 * x, 480); //right downwards lines
}
for (var x = 0; x <= 30; x += .3) {
line(0, 430, 480/60 * x, 0); //left upwards lines
}
for (var x = 0; x <= 30; x += .3) {
line(0, 430, 480/30 * x, 480); //left downwards lines
}
//draw bottom hexagon and rotates clockwise
push()
translate(240,320)
rotate(angles2)
noStroke()
fill(255)
hexagon(s[2])
angles2 +=10
pop()
//draw second hand and rotates anticlockwise
push()
translate(240,320)
fill(102,91,169)
noStroke()
rotate(angles)
hexagon(s[1])
strokeWeight(7)
stroke(200,200,220)
line(0,0,0,-50)
pop()
//draw upper hexagon and rotates anticlockwise
push()
translate(240,150)
noStroke()
fill(0)
rotate(angles1)
hexagon(s[0])
angles1 -= 10
pop()
//draw second hand and rotates clockwise
push()
translate(240,150)
fill(102,91,169)
noStroke()
rotate(angles)
hexagon(s[1])
strokeWeight(7)
stroke(200,200,220)
line(0,0,0,-50)
angles += 6
pop()
//draw circles that rotate once every minute, hour, and day
push()
//rotate once every minute
translate(240,240)
fill(100,200,220)
rotate(angleEllipse1)
ellipse(0,-180,10,10)
ellipse(0,180,10,10)
ellipse(180,0,10,10)
ellipse(-180,0,10,10)
angleEllipse1 += 6
pop()
push()
//rotate once every hour
translate(240,240)
fill(50,100,110)
rotate(angleEllipse2)
ellipse(0,-200,15,15)
ellipse(0,200,15,15)
ellipse(200,0,15,15)
ellipse(-200,0,15,15)
angleEllipse2 += 0.1
pop()
push()
//rotate once every day
translate(240,240)
fill(10,50,55)
rotate(angleEllipse3)
ellipse(0,-220,20,20)
ellipse(0,220,20,20)
ellipse(220,0,20,20)
ellipse(-220,0,20,20)
angleEllipse3 += 0.1/24
pop()
print(colorBackground)
}
//set up hexagon
function hexagon(s){
beginShape()
vertex(s,0)
vertex(s/2,s*sqrt(3)/2)
vertex(-s/2,s*sqrt(3)/2)
vertex(-s,0)
vertex(-s/2,-s*sqrt(3)/2)
vertex(s/2,-s*sqrt(3)/2)
endShape(CLOSE)
}
LO6
Link of the project:
https://news.harvard.edu/gazette/story/2021/01/harvard-scientist-turns-space-images-into-music/
date:January 25, 2021
creators: researchers from Harvard University (names not specified)
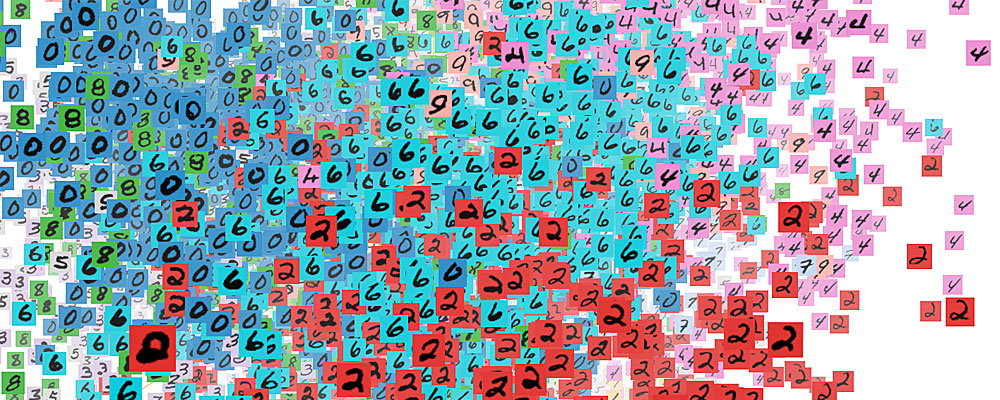
This projects is called “music of the spheres” created by Harvard’s researchers. This project uses a technique called data sonification that takes the information captured from space telescopes and translates it into sound, which involves the computer to transform visual elements to waves that produce sounds. The mechanism of audio interpretation is about linking visual variables to audio variables. This involves a lot of randomness, since the process of assigning different visual elements with different musical elements can be very random. For example, linking brightness to volumes, distance to pitches. The creator’s artistic sensibilities are shown through the transcribing process from visual to audio.