var nPoints = 100;

function setup() {
	createCanvas(480, 480);
}

function draw() {
	background(153,0,76);

	//centered in the middle of the canvas
	translate(240, 240);
	rotate(mouseX/50);

	//drawing the functions created
	strokeWeight(4);
	noFill();
	stroke(255);
	drawHypotrochoidCurve();
	stroke(40,63,141);
	drawEpitrochoidCurve();
}

//Hypotrochoid Curve
function drawHypotrochoidCurve() {

	var x;
	var y;
	var a = map(mouseX, 0, width, 0, 100);
	var b = a / 10;
	var h = constrain(mouseY, 0, height, 0, 250);

	//curve formula
	beginShape();
	for (var j = 0; j < nPoints; j ++) {
		  var t = map(j, 0, nPoints, 0, TWO_PI);
		  x = (a - b) * cos(t) + h * cos(((a - b) / b) * t);
		  y = (a - b) * sin(t) - h * sin(((a - b) / b) * t);
		  vertex(x, y);
	}
	endShape();
}

//Epitrochoid Curve
function drawEpitrochoidCurve() {

	var x;
	var y;
	var a = map(mouseX/5, 0, width, 0, 100);
	var b = a / 10;
	var h = constrain(mouseY/5, 0, height, 0, 250);

	//curve formula
	beginShape();
	for (var j = 0; j < nPoints; j ++) {
		  var t = map(j, 0, nPoints, 0, TWO_PI);
		  x = (a + b) * cos(t) - h * cos(((a + b) / b) * t);
		  y = (a + b) * sin(t) - h * sin(((a + b) / b) * t);
		  vertex(x, y);
	}
	endShape();
}
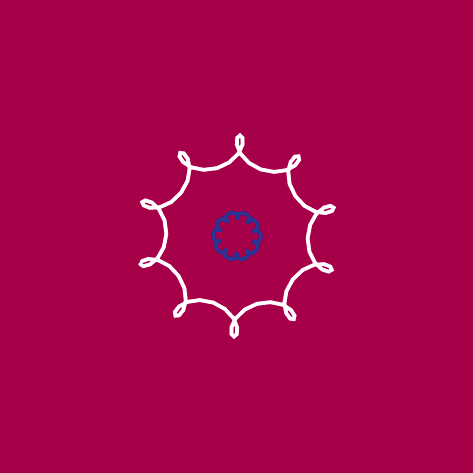
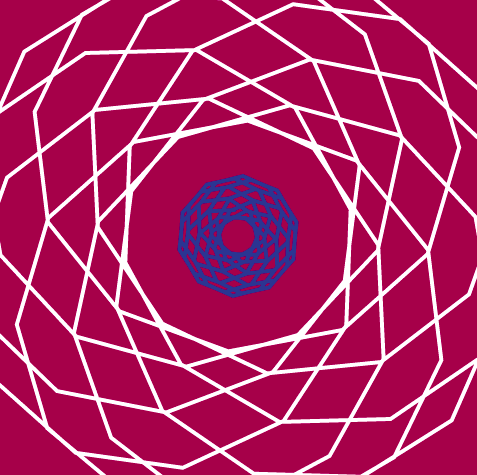
I enjoyed the straightforward nature of this assignment. For the two curves I chose, the Mathworld website provided clear formulas to use. It was interesting to play around with the constrain and map functions and see how the alterations of my curves changed as I, for instance, divided the width by 10 or multiplied the mouseX by 5. I also added in some rotation. In the project, as you move the mouse from left to right, the curves become more compressed. As you change the mouseY value, the curves become smaller and change in shape. I wanted to have the curves look smooth at some points (such that they look like two squiggly lines) and then more angular at other positions.


![[OLD SEMESTER] 15-104 • Introduction to Computing for Creative Practice](wp-content/uploads/2023/09/stop-banner.png)