Project 10: Sonic Story

project 10 sketch copy


var windowOpen = true;
var pane;
var bird;
var windowNoise;
var alarm;
var framee = 0;
var cx;
var cy;
var secRadius;
var minRadius;
var hrRadius;
var cDiam;


function preload() {
    alarm=loadSound("http://localhost:8000/clock-ticking.wav");
    pane=loadSound("http://localhost:8000/star.wav");
    windowNoise=loadSound("http://localhost:8000/creaking.wav");
    bird=loadSound("http://localhost:8000/bird.wav");
}

function setup() {
    createCanvas(480, 480);
    useSound();
    frameRate(1);
}

function soundSetup() {
    alarm.setVolume(0.2);
    pane.setVolume(0.2);
    windowNoise.setVolume(0.3);
    bird.setVolume(0.2);
}

function draw() {
    background(225,207,166);
    drawScene();
    
    if (framee>7 & framee<=10) {
        drawBird();
        bird.play();
    }

    if (framee>1 & framee <=2) {
        alarm.play();
    }
    
    push();
    translate(354, 315);
    scale(0.15);
    drawAlarm();
    
    if (framee>1 & framee <=2) {
        pane.play();
    }

    noStroke();
    fill(255);
    drawPane();
    pop();

    //when window noises occur
    drawWindow();
    if (framee>6 & framee<=12){
        windowOpen=false;
    }
    if (framee==7){
        windowNoise.play();
    }
    if (framee>11){
        windowOpen=true;
    }
    if (framee==14){
        windowNoise.play;
    }

    framee++;
    if (framee>=22){
        framee=0;
    }
  
}

function drawAlarm() {
  
    //this alarm clock is from the p5js ref website
    var radius = min(width, height) / 2;
    secRadius=radius*0.71;
    minRadius=radius*0.6;
    hrRadius=radius*0.5;
    cDiam=radius*1.7;
  
    cx=width/2;
    cy=height/2;
  
    noStroke();
    fill(0);
    ellipse(cx, cy, cDiam+25, cDiam+25);
    fill(220);
    ellipse(cx, cy, cDiam, cDiam);
  
    var s=map(second(), 0, 60, 0, TWO_PI)-HALF_PI;
    var m=map(minute()+norm(second(), 0, 60), 0, 60, 0, TWO_PI)-HALF_PI;
    var h=map(hour()+norm(minute(), 0, 60), 0, 24, 0, TWO_PI*2)-HALF_PI;
  
    stroke(0);
    strokeWeight(1);
    line(cx, cy, cx+cos(s)*secRadius, cy+sin(s)*secRadius);
    strokeWeight(2);
    line(cx, cy, cx+cos(m)*minRadius, cy+sin(m)*minRadius);
    strokeWeight(4);
    line(cx, cy, cx+cos(h)*hrRadius, cy+sin(h)*hrRadius);
  
    strokeWeight(2);
    beginShape(POINTS);
    for (var i=0; i<360; i+=6){
         var angle=radians(i);
         var x=cx+cos(angle)*secRadius;
         var y=cy+sin(angle)*secRadius;
         vertex(x, y);
  }
  
  endShape();
}

function drawScene() {
    //window
    noStroke();
    fill(51,0,25);
    square(25, 25, 300);
    fill(153,204,255);
    square(50, 50, 250);
    
    //table
    fill(181,137,34);
    rect(330,390,150,50);
    
    //alarm clock stand
    fill(0);
    triangle(370,390,410,390,390,370);
  
    //cloud
    fill(255);
    ellipse(100, 100, 70, 60);
    ellipse(125, 125, 70, 50);
    ellipse(140, 110, 60, 55); 
    ellipse(160, 115, 60, 50); 

}

function drawPane() {
    var paneX = [50, 61, 83, 69, 71, 50, 29, 31, 17, 39];
    var paneY = [18, 37, 43, 60, 82, 73, 82, 60, 43, 37];
    var nPoints = paneX.length;

}

function drawBird() {
    fill(153,0,0);
    circle(227,175,20);
    rect(226,168,20,7);
    rect(226,175,20,7);    
}

function drawWindow() {
    stroke(51,0,25);
    strokeWeight(10);
    noFill();
    if (windowOpen == true) {
        line(175, 30, 175, 320);
        line(30, 175, 320, 175);
  }
    
    if (windowOpen == false) {
        line(175, 30, 175, 320);
        line(30, 175, 170, 175);
        line(210, 80, 320, 40);
        line(210, 80, 210, 360);
        line(210, 360, 320, 320);
        line(210, 220, 320, 180);
  }

}

The fours sounds I used were the clock ticking, the alarm ringing, the window opening and the birds chirping. I wanted to create a scene of how my mornings go, as I’m always awaken by an alarm clock and hear a lot of birds outside my window.

Project 09: Computational Portrait (Custom Pixel)

project 09 sketch copy

var compportraitImg;

function preload() {
    ImageURL = "https://i.imgur.com/ZTxOcmt.jpg";
    compportraitImg = loadImage(ImageURL);
}

function setup() {
    // canvas proportional to image size
    createCanvas(400, 480);
    compportraitImg.loadPixels();
    background(220);
    frameRate(300);

}

function draw() {
    //have the correct color show at right location 
    var kx = floor(random(compportraitImg.width));
    var ky = floor(random(compportraitImg.height));
    var colorLoc = compportraitImg.get(kx, ky);
    noStroke();
    fill(colorLoc);

    //scale to size of canvas
    x = map(kx, 0, compportraitImg.width, 0, width);
    y = map(ky, 0, compportraitImg.height, 0, height);
    var j = dist(width/2, height/2, x, y);
    j = j % 20;
    bubble(x, y, j, 4);

}

function bubble(x, y, radius, npoints) {
  angle = PI / npoints;
  
  beginShape();
  for (let a = 0; a < PI; a += angle) {
      sx = x + cos(a) * radius;
      sy = y + sin(a) * radius;
      vertex(x + cos(a) * radius, y + sin(a) * radius);
  }
  endShape();
  
}

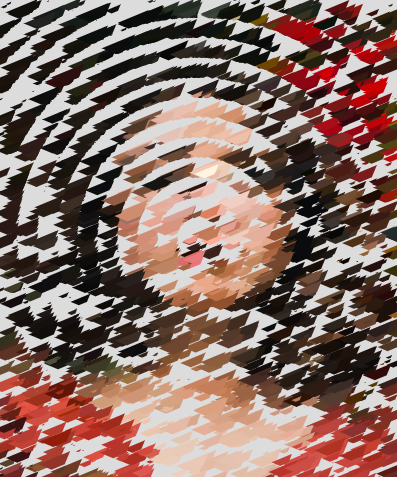
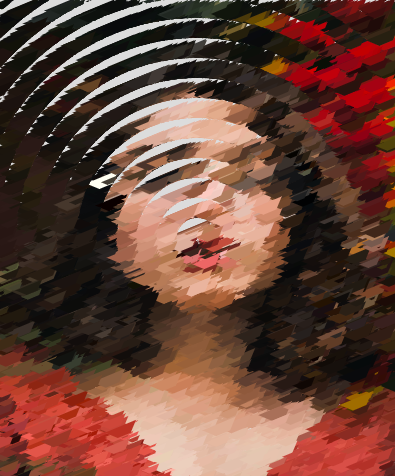
I made my “custom pixel” in the shape of half of a hexagon and made it such that they populate the canvas in a circle pattern and leave some of the background peeking through.

Looking Outwards 09: A Focus on Women and Non-binary Practitioners in Computational Art

Project Title: Revealing the hidden emotional data contained in videos of U.S. Presidential speeches

Artists: Kim Rees

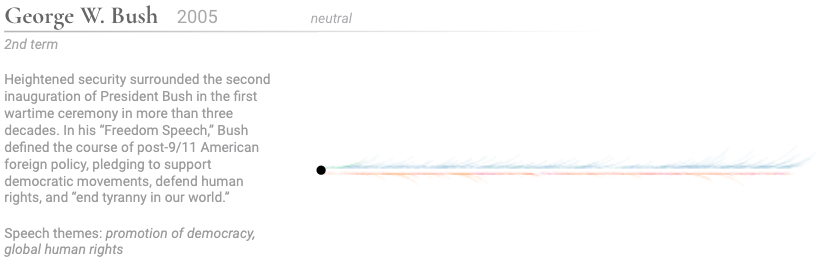
The feather is quite straight indicating neutrality and the barbs are short indicating relatively more calmness when speaking.

The creators first used the Microsoft Emotion API and then pulled out the second-ranked emotion for each event where ‘neutral’ was first-ranked. I admire the universality of this project, as they chose to focus on emotions that are understood cross-culturally (happiness, fear, etc); I admire this project because it enables even more people to connect with the data in a meaningful way and also takes what some don’t often immediately relate with distinct feelings (besides perhaps hope and pride) and connects the two. I admire how they compared inaugural addresses, not just focusing on one president. I admire this because it’s fascinating to see how some speak with such intensity, which is represented by the length of each barb, and it got me thinking about the speeches I’ve listened to and if I find such information representations to align with my perspective. Rees studied computer science. Rees co-founded Periscopic, which is a data-visualization company and worked there for over a decade. Broadly speaking, Rees focuses on human-centered data and she helped companies and organizations promote information transparency and public awareness by telling their data stories and matching algorithms to values.

Looking Outwards 08: The Creative Practice of an Individual

Stefanie Posavec is a freelance designer focused on data-related design and her work includes data visualization. Her personal work often uses a hand-crafted approach to representations of data derived from language, literature, or scientific topics. Posavec is based in London, England and studied graphic and communication design. Posavec describes herself as a designer and artist whose practice focuses on finding experimental approaches for the communication of information.

I admire how her work makes data more accessible and how the way she works is through the idea that observing is creating. I admire this because it’s important that relevant information be shared with as wide an audience as possible and because she’s able to add visual beauty and humanity to objective realities. I admire her art.park.data project because the result’s pictorial format fits its data collectors (children) and setting well (it’s bold yet simple). I also admire her Writing Without Words project because the final form looks like random tree structures but it is actually displaying quantifiable data that helps the audience look at the subject differently and emphasizes hidden complexities.

To present their work effectively, Posavec provides numerous anorak examples, some personal and some historical, some complex and others quite straightforward; after doing this she makes sure to note the connections between these despite the first-glance differences. I can learn to remember to tie things back to a general theme, as she did during her presentation when relating back to her theme of making (make sense, make a connection, make a memory).

Lecture from 2018 Eyeo Festival
One of the projects I admire: art.park.data

Project 07: Composition with Curves

project 07 sketch copy

var nPoints = 100;

function setup() {
	createCanvas(480, 480);
}

function draw() {
	background(153,0,76);
	
	//centered in the middle of the canvas 
	translate(240, 240);
	rotate(mouseX/50);
	
	//drawing the functions created 
	strokeWeight(4);
	noFill();
	stroke(255);
	drawHypotrochoidCurve();
	stroke(40,63,141);
	drawEpitrochoidCurve();
}

//Hypotrochoid Curve
function drawHypotrochoidCurve() {

	var x;
	var y;
	var a = map(mouseX, 0, width, 0, 100);
	var b = a / 10;
	var h = constrain(mouseY, 0, height, 0, 250);

	//curve formula
	beginShape();
	for (var j = 0; j < nPoints; j ++) {
		  var t = map(j, 0, nPoints, 0, TWO_PI);
		  x = (a - b) * cos(t) + h * cos(((a - b) / b) * t);
		  y = (a - b) * sin(t) - h * sin(((a - b) / b) * t);
		  vertex(x, y);
	}
	endShape();
} 

//Epitrochoid Curve
function drawEpitrochoidCurve() {

	var x;
	var y;
	var a = map(mouseX/5, 0, width, 0, 100);
	var b = a / 10;
	var h = constrain(mouseY/5, 0, height, 0, 250);

	//curve formula 
	beginShape();
	for (var j = 0; j < nPoints; j ++) {
		  var t = map(j, 0, nPoints, 0, TWO_PI);
		  x = (a + b) * cos(t) - h * cos(((a + b) / b) * t);
		  y = (a + b) * sin(t) - h * sin(((a + b) / b) * t);
		  vertex(x, y);
	}
	endShape();
}

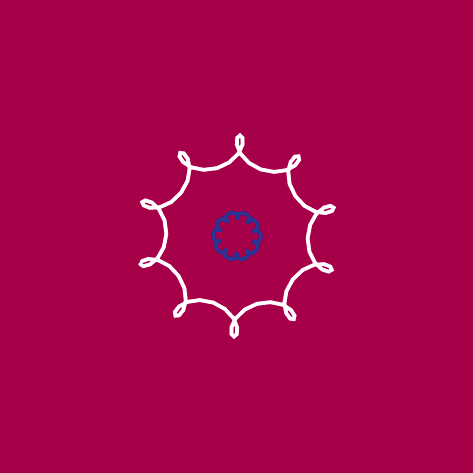
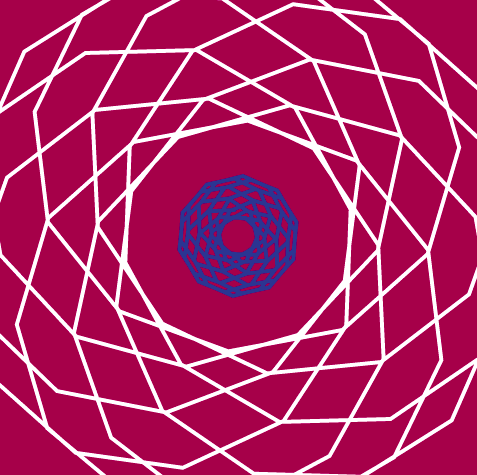
I enjoyed the straightforward nature of this assignment. For the two curves I chose, the Mathworld website provided clear formulas to use. It was interesting to play around with the constrain and map functions and see how the alterations of my curves changed as I, for instance, divided the width by 10 or multiplied the mouseX by 5. I also added in some rotation. In the project, as you move the mouse from left to right, the curves become more compressed. As you change the mouseY value, the curves become smaller and change in shape. I wanted to have the curves look smooth at some points (such that they look like two squiggly lines) and then more angular at other positions.

This is what the curves look like when the mouse is in the upper right hand corner.
This is what the curves look like when the mouse is in the middle right side.

Looking Outwards 07: Information Visualization


Project Title: Peak Spotting

Year of Creation: 2017

Artists: Moritz Stefaner

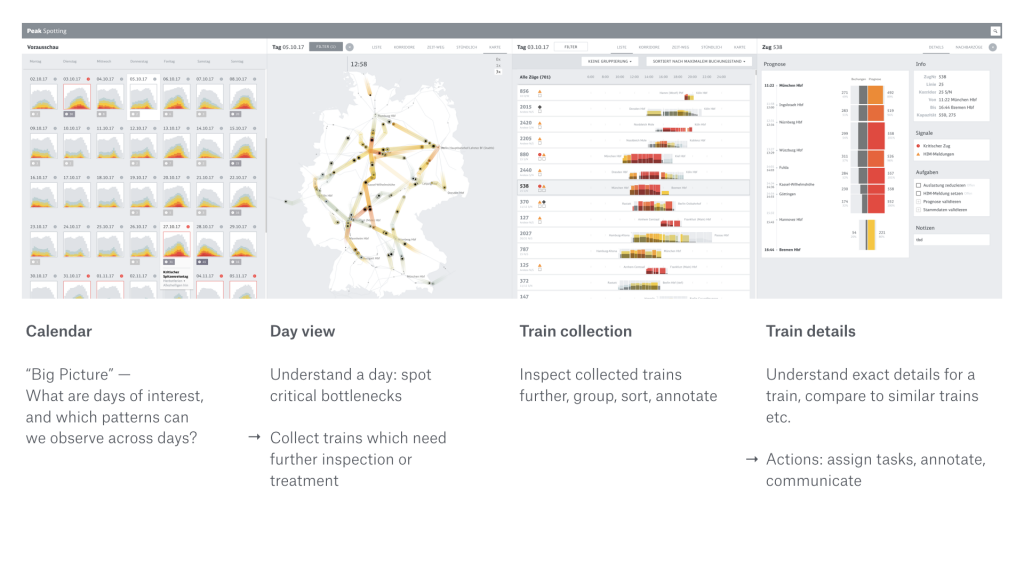
As the user moves from left to right, the data becomes more specific.

This project is an application that integrates data points which allows users to inspect data on custom developed visual tools, such as animated maps. I admire this project because it provides actionable information that can be used to make improvements with regards to passenger loads in trains; for example, there are features that allow users to spot traffic bottlenecks. I admire the aesthetics, because it is coherent and straight to the point. I admire this because the data is readable with distinct colors and organization is such that the process of finding information is streamlined. I know that the creator did some prototyping with Tableau to see what forms would be useful for each specific feature. Then Stefaner began prototyping with d3 and through this was able to compare different rendering techniques to select the most effective representation. The creator’s work is focused on balancing analytical and artistic aspects to support data-driven decision making. The final form of Peak Spotting perfectly encapsulates such sensibilities; it is largely due to his creative prioritization that the data is able to be as useful as it is. He aims to create work that draws people’s attention quickly, and this does just that by drawing people into the graphics and then keeping them interested with the content.

Project 06: Abstract Clock

project 6 sketch copy

var beginday;
var seconds;
var minutes;
var hours;
var bloomx = []; 
var bloomy = [];

function setup(){
    createCanvas(460, 300);
    
    //flower per each passing second
    for (i = 0; i < 60; i ++) {
        bloomx[i] = random(20,440);
        bloomy[i] = random(20,280);
   }
}

function draw(){
    hours = hour();
    minutes = minute();
    seconds = second();
    beginday = 270;
    angleMode(DEGREES);
    
    //daytime background or nightime background 
    if (hours < 7 || hours > 18){
        background(31, 47, 71);
        
    } else{
        background(102, 178, 255);
        
    }
    
    //clock lines
    noFill();
    strokeWeight(15);
    
    //hours measure
    stroke(255, 102, 102, 175);
    arc(230, 150, 240, 240, beginday, beginday + hours * 30);
    
    //minutes measure
    stroke(255, 128, 0, 190);
    arc(230, 150, 200, 200, beginday, beginday + minutes * 6);
    
    //seconds measure
    stroke(255,255,0, 125);
    arc(230, 150, 160, 160, beginday, beginday + seconds * 6);

    for (i = 0; i < seconds; i ++) {
        strokeWeight(10);
        fill(255);
        ellipse(bloomx[i], bloomy[i], 6, 6);
    }

    //determines whether sun or moon is shown and whether the star is present 
    if (hours < 7 || hours > 18){
        
        //moon
        noStroke();
        fill(160,160,160);
        circle (230, 150, 125);
        fill(192,192,192);
        ellipse(270, 115, 10, 10);
        ellipse(235, 110, 30, 30);
        ellipse(270, 150, 40, 40);
        ellipse(230, 175, 20, 20);
        ellipse(205, 140, 40, 40);

        //star that appears every OTHER second
        noStroke();
        fill(255);
        translate(300, 70);
        triangle(25 * (seconds % 2), 0, 0, 4, 0, -4);
        triangle(-4, 0, 4, 0, 0, 25 * (seconds % 2));
        triangle(-4, 0, 4, 0, 0, -25 * (seconds % 2));
        triangle(-25 * (seconds % 2), 0, 0, 4, 0, -4);

        } else{

        //sun
        noStroke();
        fill(249, 228, 95);
        circle (230, 150, 125);
        
        //cloud that appears every OTHER second
        fill(255);
        noStroke();
        ellipse(330, height/2-70, 50, 50 * (seconds % 2));
        ellipse(360, height/2-80, 80, 80 * (seconds % 2));
        ellipse(390, height/2-70, 80, 80 * (seconds % 2));
        ellipse(420, height/2-70, 50, 50 * (seconds % 2));
        
    }
}

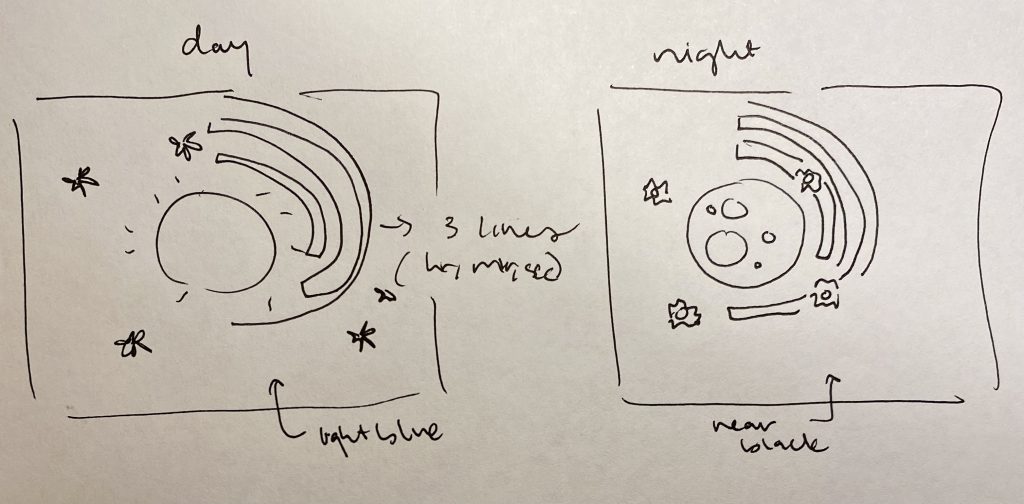
I wanted to use lines and play around with transparency, so that’s what I did with the three seconds, minutes and hours lines. Besides the inner yellow line that extended each second, I also added yellow flowers/stars that would randomly populate the canvas per second. In the code you can see that when the hour of day is less than 7 (before 7am) or greater than 18 (after 6pm), the background color and the different parts (sun and cloud) will change into its night version (moon and star). Since there were now two elements measuring seconds, I had the cloud and star appear every other second for a bit of variety.

Paper sketch of clock

Looking Outwards 06: Randomness

Project Title: Arcs04-01

Year of Creation: 2011

Artists: Marius Watz

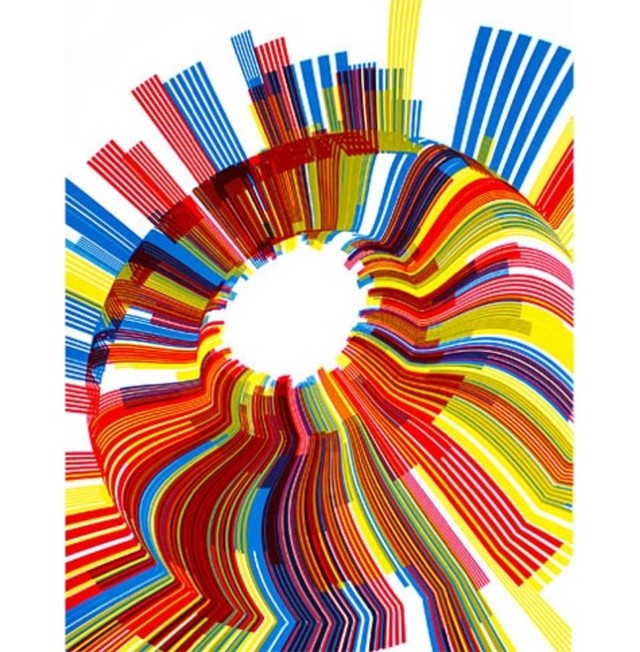
Arcs04-01 is part of the Random Number Multiples collection that takes computer produced visuals and translates them to prints.

I admire the vibrant colors used in this project and how the shapes of the lines flow such that it looks like the 2D print just stopped the art midway through. I admire this because it feels like the art was in motion and the audience just happened to catch a snapshot of an ongoing thing. The placement of each of the red, blue and yellow lines are random but I like how the colors are kept within these three. The creator didn’t use just any colors and I admire this artistic decision because it brings some overall cohesion to the project. The work uses “pseudo-random compositions” of branching out shapes that are distorted by a 3D surface to mimic a sense of movement while maintaining a central focal point. Watz uses software to produce a computational image and then places in aspects of randomness either through the colors or shapes. The creator connects generative art with “dynamic processes,” so in the final form of the work it gives the impression of never being static. The artist’s logic borrows from biomimicry so his art form seems to be in the process of developing and being undone.

Project 05: Wallpaper

project 5 sketch copy


function setup() {
    createCanvas(400, 400);
    background(204, 229, 255);
}

function draw() {
  //criss cross line background
  for (y = 0; y < height + 25; y += 50) {
        for (x = 0; x < width + 25; x += 50) {
            var llength = 25;
            strokeWeight(4);
            stroke(102, 178, 255);
            line(x - llength, y - llength, x + llength, y + llength);
            line(x - llength, y + llength, x + llength, y - llength);
        }
    }
    //ice cream cones
    noStroke();
    for(var a = 25; a < width; a += 50) {
        for(var b = 25; b < width; b += 100) {
            drawcone(a, b);
        }
    }
    //rasberry ice cream scoops
    for(var c = 25; c < width; c += 50) {
        for(var d = 30; d < height; d += 100) {
            rasberryscoop(c,d);
        }
    //chocolate ice cream scoops
     for(var e = 75; e < width; e += 100) {
        for(var f = 30; f < height; f += 100) {
            chocolatescoop(e,f);
        }
     }
     
    //white dots 
      for (var y = 0; y < 6; y++) {
        for (var x = 0; x < 6; x++) {
            fill(255);
            circle(x * 100 + 50, y *100 + 50, 7);
            noLoop();
      }
    }
  }
}

function drawcone(a, b) {
    fill(255, 204, 153);
    triangle(a - 7, b + 10, a, b + 30, a + 7, b + 10);
}

function rasberryscoop(c, d) {
    fill(255, 102, 178);
    circle(c, d, 18);
}

function chocolatescoop(e, f) {
    fill(102, 51, 0);
    circle(e, f, 18);
}


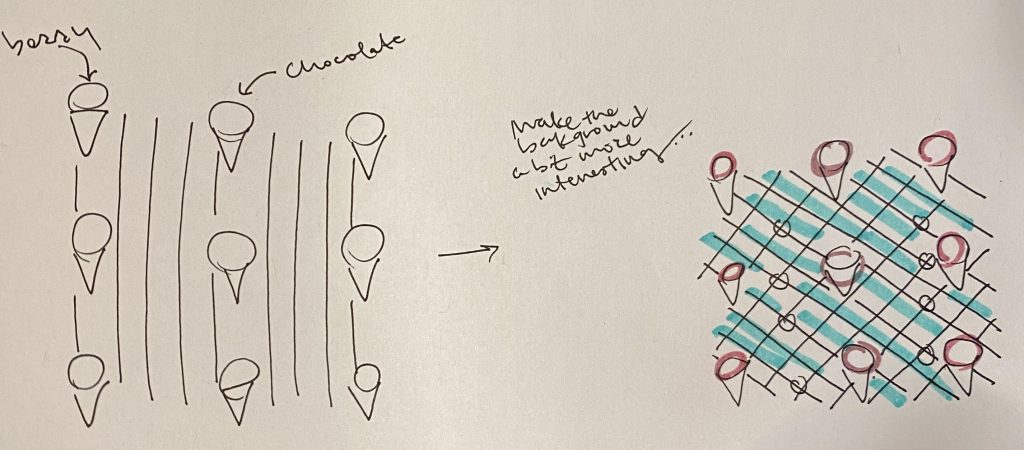
When I began thinking of a design to create, I was pretty hungry so naturally I had my main pattern be a dessert. Originally my background was going to be vertical straight lines but I ended up making them diagonal to create a criss-cross look. I knew I wanted to incorporate alternating color scoops, and since we have had a good amount of practice with this it wasn’t hard to code. I thought having dots at some of the intersections of the blue lines would be nice, so I added that.

Paper sketch of wallpaper

Looking Outwards 05: 3D Computer Graphics


Project Title: WarNymph

Year of Creation: 2020

Artists: Dylan Kowalski

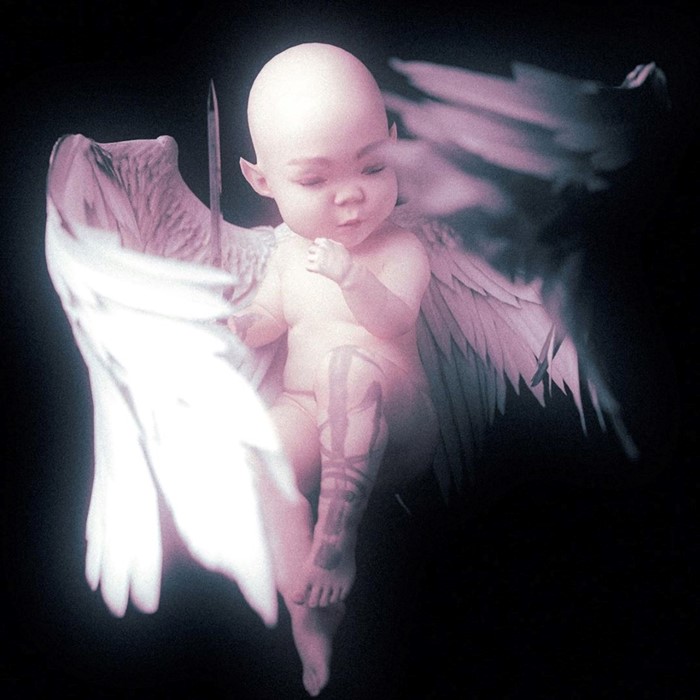
The digital persona is Grimes’ “de-aged clone.”

I admire how the project allows Grimes to have a digital version of herself because I feel like the virtual world is the exact place where people can be who they “truly are” without the confinements of real world expectations or circumstances. Though the character is kind of scary, I admire how genuinely eerie the 3D baby looks because it aligns well with the grim messages it speaks (in some videos, WarNymph talks of the end of the world). I know that Kowalski did the 3D sculpting partly on his “home desktop” and with ZBrush (digital sculpting application), but I can’t find much else on the algorithms or mechanisms that generated the work. Kowalski’s artistic focus lies in making incredibly detailed 3D characters, which is clearly exemplified by the baby’s intricate wings and leg tattoo, which accurately matches Grimes’ tattoo.