var nPoints = 100;
var x;
var y;


function setup() {
    createCanvas(680, 620);
}


function draw() {
    background(106,187,244); //blue background
    peach(60, 190, 100); //top left peach
    peach(80, width-200, 100); //top right peach
    peach(90, 200, height-270); //bottom left peach
    peach(70, width-190, height-240); //bottom right peach
}

//a general function that will draw a peach with given variables
function peach(a, shiftX, shiftY) {
    push();
    translate(shiftX, shiftY);
    rotate(radians(270));
    var a;
    var b = a / 2;
    var h = constrain(mouseY/8, 0, b);
    var ph = mouseX/50;
    beginShape();
    for (var i = 0; i < nPoints; i++) {
        var t = map(i, 0, nPoints, 0, TWO_PI);
        x = a * cos(t) * (1-cos(t)) - h * cos(ph + t * a);
        y = a * sin(t) * (1-cos(t)) - h * sin(ph + t * a);
        fill(244,148,106);
        vertex(x, y);
    }
    endShape(CLOSE);
    pop();
}
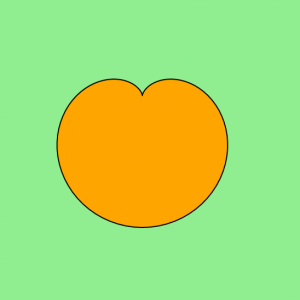
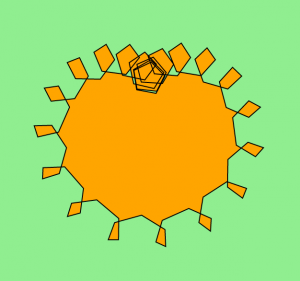
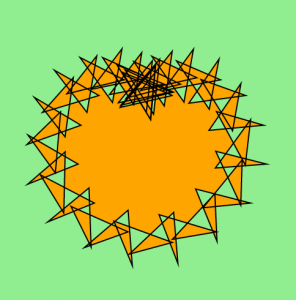
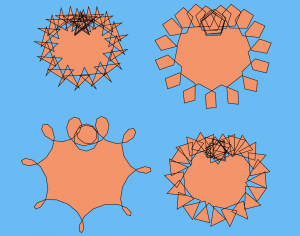
For this project, I made a bunch of “peaches” that start off looking like normal peaches while your mouse is at the top of the canvas. Once your mouse goes down the canvas, the edges of each of the peaches creates a new shape. Moving your mouse left or right changes the rotation of those edge shapes. The original curve that I found on the MathWorld website was called a “Cardioid”. I rotated it 270˚ in order to look more like a peach. Then while playing around with the values set in my curve equation, I found that I could create different-looking edge shapes, like how the top left curve’s edges seem to make star shapes, and the bottom left curve’s edges create more of a loop shape.
I started off with the peach shape:
I then played around with making edge shapes that grow and rotate based on mouse location:

And then changed the colors and created a grid of varying peaches, with varying edge shapes!
![[OLD – FALL 2016] 15-104 • COMPUTING for CREATIVE PRACTICE](wp-content/uploads/2020/08/stop-banner.png)