//Sadie Johnson
//section C
//sajohnso@andrew.cmu.edu
//project 07

var nPoints = 100;


function setup() {
    createCanvas(400, 400);
    frameRate(10);
}


function draw() {
    background(255);
    push();
     //centers design
     translate(width / 2, height / 2);
        drawCurve();
    pop();
}

function drawCurve() {
    var x;
    var y;
    //size is linked to mouse's distance from center
    var a = int((dist(width/2,height/2,mouseX,mouseY))/2);
    var h = mouseY/50;
    var ph = constrain(mouseX / width, 30, 400);

    fill('#98ddde'); //light blue
    beginShape();
    for (var i = 0; i < nPoints; i++) {
     var t = map(i, 0, nPoints, 0, TWO_PI);
     //equation of the curve
      x	= a*(h*cos(t)-cos(h*t*ph))
	  y	= a*(h*sin(t)-sin(h*t*ph))
        vertex(x, y);
    }
    endShape(CLOSE);

}
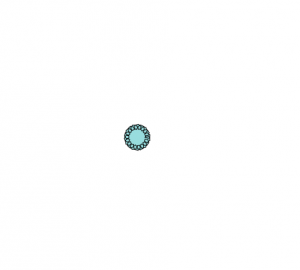
The hardest part of this assignment was finding a function that made sense to me and looked interesting. After I found the correct function, I had a pretty tough time scaling it appropriately so the user could see all the complex designs that were formed when the X position and Y position of the mouse changed. In the first picture, my design was far too small. In the second, it looked bland because the image was so large it enveloped the whole screen. However, I think I have found a happy medium between the two extremes.


![[OLD – FALL 2016] 15-104 • COMPUTING for CREATIVE PRACTICE](../../wp-content/uploads/2020/08/stop-banner.png)