Kyle Leve-LO-Week-08

Jake Barton is one of the founders of the company Local Projects which is a media-design firm for museums and public spaces. Barton’s company has worked on various projects around the world such as the Beijing 2008 Olympics, media designs for the New York City Visitors Information Center, and the World Trade Center. However, the video that I watched discusses his project titled “Like Falling in Love.” Throughout his discussion, Barton talks about the different ways people view things especially if it is for the first time. This translates into what Local Projects does in that it strives to create an atmosphere that all people can find comforting and enjoyable. Barton mentions how artwork is a language used to communicate a message and an atmosphere to people. I feel that this can be applied to all forms of art. No matter the art form, whether it be music, design, architecture or anything else, it strives to convey a certain feeling or emotion. One slide that was shown in the presentation that caught my attention was the quote “Styles change but human emotions are timeless and universal.” This quote inspires me to continue down my path, because as a musician, even though job opportunities look bleak, there will always be human emotions and there will always be an audience that wants to feel something.

https://vimeo.com/channels/eyeo2012

http://localprojects.com/about


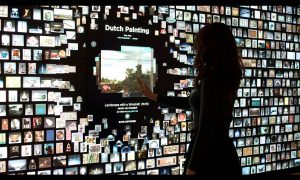
Gallery One, found at the Cleveland Museum of Art, is an interactive project conducted my Local Projects that made the art exhibit more technological and interactive.

Alice Fang – Looking Outwards – 08

Eyeo 2014 – Mike Bostock from Eyeo Festival on Vimeo.

Mike Bostock is a data-visualization specialist, and was an interactive graphics designer for The New You Times. He is also a developer of D3.js, which is a javascript library that is used for visualizing data. He graduated in 2000 with a BSE in computer science from Princeton University.

Many of the projects on his portfolio website are visualizations of data for The New York Times, with topics ranging from “Mapping every Path to the N.F.L Playoffs” to “Drought and Deluge in the Lower 48.” He combines his interest and passion for interactive visualization and animation with his knowledge of coding, to create very visually compelling images that aim to make learning and teaching abstract concepts more intuitive. I admire the simplicity in a lot of its work, and the consideration he has for human factors, like how people intake and react to the information, something which translates in his presentation as well.

Visualization of QuickSort, from his Eyeo Talk in 2014
His presentation on “Visualizing Algorithms” helped me understand different types of sorting algorithms through quick animation, in a way that just looking at code would have made difficult. He also addresses some tricky questions: how much visualization is too much, to the point where it overwhelms the viewer? I think his work is very applicable to design, where similar considerations have to be made about the best way to communicate ideas.

Carley Johnson Looking Outwards 08

These are the women whose art I got inspired by this week. They are Mouna and Melissa, the founders of Daily Tous Les Jours, which works in connection, physicality and pushing people to act past social boundaries (ie, dancing in the streets). They are both from Montreal but do work all over the United States and Canada, both indoors and outdoors. My favorite project of there’s is called Choreographie pour humans et les etoiles (Choreography for humans and stars) wherein the goal was to get people to dance and become celestial bodies. A camera gave them instructions (hold hands and lean out while spinning in a circle as fast as you can) and then captured the motion and translated it into a beautiful universe graphic on the screen. It was cool to see strangers getting together and laugh at themselves being silly. I feel like the world needs more of that. Their presentation was alright. The footage of their projects and them projects themselves were really interesting, but they weren’t that engaging. They tried to inject a few jokes in there that were really dry, and even though there were two of them, they didn’t play off of each other very well. Really fun and sweet projects though!

Website link:

http://www.dailytouslesjours.com/

Joanne Lee – Looking Outward 07

Flight Visualizations over 24 Periods, Institution: NATS (2014)

NATS is an air traffic control services provider and in this particular video, they visualized the air traffic coming and going to European airspace over the course of 24 hours on a summer day in 2014. Despite the fact that there is not much information available on it, I chose this work because after I graduated high school, my parents moved to Germany for 3 years. During those 3 years, I had the privilege of making many trips to, from, and within Europe. Throughout the countless delayed flights, time spent on the runway, and in the air, I became increasingly aware of the sheer number of flights that there are in a day and wondered how air traffic was managed and controlled.

It is particularly fascinating and meaningful to me to see this visualization. In terms of creating this visualization, I image that NATS has access to all of the flight routes of any given day and they carefully compiled these routes onto a 3D model of the Earth. I really like that they used a dark background for the Earth and used an eye-catching neon color while also making it slightly opaque — so that we can see places where many of the routes overlap.

(* Note: This assignment was submitting using one grace day.)

Robert Oh-Looking Outwards 07

Word Associations Visualization by Chris Harrison

For this Looking Outwards, I chose to study the word association art of Chris Harrison. I really admire this kind of art because I’ve taken multiple classes that show the importance of words and their similarities. This project shows which words are used more frequently with the two base words, “hot” and “cold”.  I really admire how simple and clear it is to look at this graph. You can see clearly which words are more frequently used with either of the base words.

In other to make this graph, Harrison went through many different processes. Words were bucketed into one of 25 different rays. Each of these represented a different tendency of use (ranging from 0 to 100% in 4% intervals). Words were sorted by decreasing frequency within each ray. Finally they rendered as many words as could fit onto the canvas.

You can see how methodological and clear the artist is through this piece. This art is really all about data and applying that data, and so I would claim that you can see Harrison’s logical artistic style in this art.


http://www.chrisharrison.net/index.php/Visualizations/WordAssociations

Joanne Lee – Project 07

Project-07

// Joanne Lee
// Section C
// joannele@andrew.cmu.edu
// Project-07

var nPoints = 100;
var colorR = 167;
var colorG = 168;
var colorB = 212;
var div = 0;
var w = 0;
var h = 0;

function setup() {
  createCanvas(480,480);
}

function draw() {
  background (240);
  push();
  translate(0,0);
    for (var c = 0; c < 6; c ++) {
      h = c * 96; // shifts height of flower
      for (var d = 0; d < 7; d ++) {
        w = d * 80; // shift width of flower
        drawEpitrochoidCurve(colorR, colorG, colorB, div, w, h);
      }
    }
    if (mouseY > 0){
        div = (mouseY / 15.0) + 5; // flower size scales to mouseY position
    }
  pop();
}

function drawEpitrochoidCurve(colorR, colorG, colorB, div, w, h) {
    // Epicycloid:
    // http://mathworld.wolfram.com/Epicycloid.html    
  var x;
  var y;
    
  var a = 80.0;
  var b = a / 2.0;
    
  fill(colorR, colorG, colorB);
  beginShape();
  for (var i = 0; i < 100; i++) {
    var t = map(i, 0, nPoints, 0, TWO_PI);
    x = a * (6 * cos(t) - cos(6 * t)) / div + w;
    y = a * (6 * sin(t) - sin(6 * t)) / div + h;
    vertex(x, y);
  }
  endShape(CLOSE);
    
}

function mouseClicked() { // petal color changes upon mouseClick
  var colNum = int(random(1,4));
    if (colNum == 1) {
      colorR = 167;
      colorG = 168;
      colorB = 212;
    }
    else if (colNum == 2) {
      colorR = 207;
      colorG = 61;
      colorB = 160;
    }
    else if (colNum == 3) {
      colorR = 90;
      colorG = 76;
      colorB = 181;
    }
}

Image result for flower color

For this week’s project, I first thought of flower petals when I was looking at the possible curves. I looked up flower petals and liked the colors and shapes of these, so I used ranuncloid curves to create them. Ranuncloid curves are essentially epicycloids with 5 cusps. For interactivity, I thought it would be interesting to make the flower “grow” using the mouseY position as well as randomly alternate between the flower colors depicted above with mouse clicks. I purposely had the flowers overlap with each other at its largest size because I thought that it formed an interesting pattern.

Lan Wei-Project -07-Curves

my-sketch.js

//Lan Wei
//Section D
//lanw@andrew.cmu.edu
//Project-07

function setup() {
    createCanvas(450, 450);
    strokeWeight(2);
    noFill();
}

//http://mathworld.wolfram.com/LogarithmicSpiral.html
var nPoints = 1000;
function draw() {
    background(0);
    push();
    var red = map(mouseX, 0, width, 255, 0);
    var green = map(mouseX, 0, width, 20, 150);
    var blue = map(mouseX, 0, width, 0, 150)
    var col = color(red, green, blue); //change the color
    stroke(col);
    translate(mouseX, mouseY); //draw  with the mouse
    logarithmicSpiral();
    pop();
    push();//another logarithmicSpiral
    var red = map(mouseX, 0, width, 0, 200);
    var green = map(mouseX, 0, width, 100, 50);
    var blue = map(mouseY, 0, width, 0, 150)
    var col = color(red, green, blue); //change the color
    stroke(col);
    translate(width - mouseX, height - mouseY); //draw  with the mouse
    logarithmicSpiral();
    pop();
    stroke(255);
}

function logarithmicSpiral(){
    var a = 0.1;
    var b = 0.1;
    beginShape();
    for (var i = 0; i < nPoints; i++) {
        var t = map(i, 0, nPoints, - 16 * PI, 8 * PI);
        var x = 1000 * a * cos(t) * pow(Math.E, b * t);
        var y = 1000 * a * sin(t) * pow(Math.E, b * t);
        vertex(x, y);
        rotate(atan(mouseY/mouseX)); //rotate with the tangent of the mouse
    }
    endShape();
}

In the project I try to create rotating spirals that change angles and color with mouse movement. I struggled with it at first, having problems figuring out the relationships between the parameters. But finally it works.

Xiaoying Meng – Project 07 Curves

sketch

//Xiaoying Meng
//xiaoyinm@andrew.cmu.edu
//Project 7
function setup(){
    createCanvas(480,480);
    frameRate(10);
}

function draw(){
    background(220);
//top curve
    push();
    translate(width/3,height/3);
    rotate(PI - mouseY/40);
    drawCurve();
    pop();
//middle curve
    push();
    translate(width/2,height/2);
    rotate(PI + mouseY/40);
    drawCurve2();
    pop();
//bottom curve
    push();
    translate(width- width/3, height- height/3);
    rotate(PI - mouseY/40);
    drawCurve3();
    pop();

   
}

//regular Crv
function drawCurve(){
    var nPoints = 200;
    var a = (mouseX-100)/3*2;
    var b = (mouseY-100)/3*2;
    fill(0);
    noStroke();
    beginShape();
    for (var i=0; i < nPoints; i++ ){
        var angle = map ( i, 0, mouseX, 0, 2*PI);
        var x = a* (1/cos(angle));
        var y = b * tan(angle);
        vertex(x,y);
    }
    endShape();
}

//wiggly Crv
function drawCurve2(){
    var nPoints = 200;
    var a = (mouseX-100)/3*2;
    var b = (mouseY-100)/3*2;
    fill(255);
    noStroke();
    beginShape();
    for (var i=0; i < nPoints; i++ ){
        var angle = map ( i, 0, mouseX, 0, 2*PI);
        var x = a* (1/cos(angle));
        var y = b * tan(angle);
        vertex(x + random(-5,5),y + random(-5,5));
    }
    endShape();
}
//dotted Crv
function drawCurve3(){
    var nPoints = 200;
    var a = (mouseX-100)/3*2;
    var b = (mouseY-100)/3*2;
    fill(150);
    noStroke();
    beginShape();
    for (var i=0; i < nPoints; i++ ){
        var angle = map ( i, 0, mouseX, 0, 2*PI);
        var x = a* (1/cos(angle));
        var y = b * tan(angle);
        ellipse(x, y, 10, 10);
    }
    endShape();
}


I chose hyperbola curves. I created three different type of representation of the curves as surfaces and lines. By rotating them to different directions, interesting abstract composition start to occur.

Robert Oh- Project 07 – Curves

curves

//Robert Oh
//Section C
//rhoh@andrew.cmu.edu
//Project-07-Curves

//assigning variables
var nPoints = 100;
var angle1 = 0;
var adj1 = 10;
var angle2 = 0;
var adj2 = 0;
var angle3 = 0;
var adj3 = 0;

function setup() {
    createCanvas(400, 400);
    frameRate(60);
}

function draw() {
    background(0);
    
    //drawing the white circle
    ellipse(mouseX, mouseY, 170, 170);

    //drawing the red Quadrifolium 
    push();
    fill(255, 0, 0);
    translate(mouseX, mouseY + 45);
    rotate(radians(angle1));
    drawQuadrifolium();
    angle1 = (angle1 + adj1) % 360;
    pop();

    //drawing the green Quadrifolium
    push();
    fill(0, 255, 0);
    translate(mouseX + 39, mouseY - 20);
    rotate(radians(angle2));
    drawQuadrifolium();
    angle2 = (angle2 + adj2) % 360;
    pop();

    //drawing the blue Quadrifolium
    push();
    fill(0, 0, 255);
    translate(mouseX - 39, mouseY - 20);
    rotate(radians(angle3));
    drawQuadrifolium();
    angle3 = (angle3 + adj3) % 360;
    pop();

    //adjusting speed of rotation for only blue and green Quadrifoliums
    adj2 = (15 * (mouseX / width)) + (15 * (mouseY / height));
    adj3 = (15 * (width - mouseX) / width) + (15 * (width - mouseY) / height);
}

//formula taken from: http://mathworld.wolfram.com/Quadrifolium.html
function drawQuadrifolium() {
    var a = 40;
    
    beginShape();
    for (var i = 0; i < nPoints; i++) {
        var t = map(i, 0, nPoints, 0, TWO_PI);
        r = a * sin(2 * t);
        x = r * cos(t);
        y = r * sin(t);
        vertex(x, y);
    }
    endShape(CLOSE);
    
}

When I first started this assignment, I was looking around for inspiration. One morning, when I started shaving with my electric razor, I realized that my blades were in the shape similar to that of a quadrifolium. Thus, I created the three quadrifoliums in the same shape as my razor. I adjusted the speed of the top two “razors” to speed up/slow down if they are near the edges of the canvas.

my attempt to make a quadrifolium

Elena Deng-Project 7-Curves

sketch
This project was quite difficult for me to execute. With the link provided I was able to look at different algebraic functions and graphs; however, once I looked at the mathematical
functions themselves I got really confused. Overall, I am not really proud of this project and hope to be able to incorporate mathematical functions into my code in the future.

/*Elena Deng
Section E
  edeng1@andrew.cmu.edu
  Project-07
}
*/

var nPoints=100

function setup() {
    createCanvas(480, 480);
}

function draw() {
    background(0,50,50);
    var mX = mouseX; //establishes mouseX and mouseY function
    var mY = mouseY;
    noFill();
    strokeWeight(1);


//mouse position is constrained to the canvas size
    mouseX=constrain(mX, 0, width);
    mouseY=constrain(mY, 0, height);

    mPos=dist(mX,mY,width/2,height/2);
    a= map(mPos,0,width,0,480);

    eight(); //draws first eight loop
    circleOne(); //draws ellipse

//draws second eight loop
    push();
    rotate(HALF_PI);
      for(var i=0;i<nPoints;i++){
        var r = map(mouseX,0,width,100,255);
        var g = map(mouseX,0,width,100,200);
        var b = map(mouseY,0,height,100,100);
        stroke(r/2,g*3,b)
        // stroke(r,g,b)
          strokeWeight(1.5);

          var t = map(i,0,nPoints,0,TWO_PI);

          x=a*sin(t);
          y=a*sin(t)*cos(t);

          rotate(PI); //rotates figure
          x2=a*sin(t*2)*PI;
          y2=a*sin(t*2)*cos(t)*PI;

        vertex(x2,y2)

      endShape(CLOSE);
    pop();
    }
}
function eight(){ //draws first eight loop
  var r = map(mouseX,0,width,255,100); //changes color based on where mouseX and Y is
  var g = map(mouseX,0,width/10,200,100);
  var b = map(mouseY,0,height,80,100);
  stroke(r,g,b)

    strokeWeight(3);
    // stroke(r,g,b)
    var x;
    var y;

    beginShape();

      translate(width/2,height/2);

      for(var i=0;i<nPoints;i++){
        var t = map(i,0,nPoints,0,TWO_PI);

        x=a*sin(t);
        y=a*sin(t)*cos(t);
      vertex(x,y);

    endShape(CLOSE);
}
}
function circleOne(){ //draws the circle
  strokeWeight(1)
  var r = map(mouseX,0,width/4,100,300);
  var g = map(mouseX,0,width/4,180,200);
  var b = map(mouseY,0,height*6,100,200);
  for(var i=0;i<nPoints;i++){ //draws the loop of ellipse
    ellipse(0,0,a*i,a*i)
  }
}

mouse X and mouse Y at the maximum width/height of canvas
mouse X and mouse Y at the minimum width and height of canvas