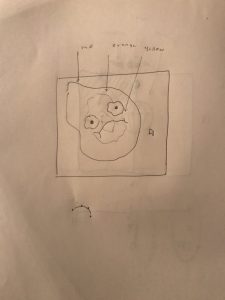
Sean Meng – Project 7

sketch

function setup() {
    createCanvas(480, 480);
    frameRate(10);
}


function draw () {
    background(0)
    noFill()
    stroke(255)
    var nPoints = 20;
    var radius = 50;
    var separation = 125;
    var R1 = mouseX/2
    var R2 = mouseY/2

//the color of the pattern changes slowly from bluee to red as the mouse moves along the diagnal of canvas  
//the first set of rectangle loop
    stroke(mouseX, 10, 10)
    push();
    translate(2*separation, height / 2);
    for (var i = 0; i < nPoints; i++) {
        var theta = map(i, 0, nPoints, 0, TWO_PI);
        var px = R1 * cos(theta);
        var py = R2 * sin(theta);
        rect(px - 5, py - 5, 10, 10);
    }
    pop();

//the second set of rectangle loop
    stroke(mouseX, 30, 30)
    push();
    translate(2*separation, height / 2);
    for (var i = 0; i < nPoints; i++) {
        var theta = map(i, 0, nPoints, 0, TWO_PI);
        var px = R1 * cos(theta);
        var py = R2 * sin(theta);
        rect(px - 10, py - 10, 20, 20);
    }
    pop();

//the third set of rectangle loop
    stroke(mouseX, 50, 50)
    push();
    translate(2*separation, height / 2);
    for (var i = 0; i < nPoints; i++) {
        var theta = map(i, 0, nPoints, 0, TWO_PI);
        var px = R1 * cos(theta);
        var py = R2 * sin(theta);
        rect(px - 15, py - 15, 30, 30);
    }
    pop();

//the fourth set of rectangle loop
    stroke(mouseX, 70, 70)
    push();
    translate(2*separation, height / 2);
    for (var i = 0; i < nPoints; i++) {
        var theta = map(i, 0, nPoints, 0, TWO_PI);
        var px = R1 * cos(theta);
        var py = R2 * sin(theta);
        rect(px - 30, py - 30, 60, 60);
    }
    pop();

//the fifth set of rectangle loop
    stroke(mouseX, 90, 90)
    push();
    translate(2*separation, height / 2);
    for (var i = 0; i < nPoints; i++) {
        var theta = map(i, 0, nPoints, 0, TWO_PI);
        var px = R1 * cos(theta);
        var py = R2 * sin(theta);
        rect(px - 50, py - 50, 100, 100);
    }
    pop();

//the sixth set of rectangle loop
    stroke(mouseX, 110, 110)
    push();
    translate(2*separation, height / 2);
    for (var i = 0; i < nPoints; i++) {
        var theta = map(i, 0, nPoints, 0, TWO_PI);
        var px = R1 * cos(theta);
        var py = R2 * sin(theta);
        rect(px - 90, py - 90, 180, 180);
    }
    pop();

//the seventh set of rectangle loop
    stroke(mouseX, 140, 140)
    push();
    translate(2*separation, height / 2);
    for (var i = 0; i < nPoints; i++) {
        var theta = map(i, 0, nPoints, 0, TWO_PI);
        var px = R1 * cos(theta);
        var py = R2 * sin(theta);
        rect(px - 95, py - 95, 190, 190);
    }
    pop();

//the eighth set of rectangle loop
    stroke(mouseX, 170, 170)
    push();
    translate(2*separation, height / 2);
    for (var i = 0; i < nPoints; i++) {
        var theta = map(i, 0, nPoints, 0, TWO_PI);
        var px = R1 * cos(theta);
        var py = R2 * sin(theta);
        rect(px - 100, py - 100, 200, 200);
    }
    pop();

//the nineth set of rectangle loop
    stroke(mouseX, 220, 220)
    push();
    translate(2*separation, height / 2);
    for (var i = 0; i < nPoints; i++) {
        var theta = map(i, 0, nPoints, 0, TWO_PI);
        var px = R1 * cos(theta);
        var py = R2 * sin(theta);
        rect(px - 105, py - 105, 210, 210);
    }
    pop();

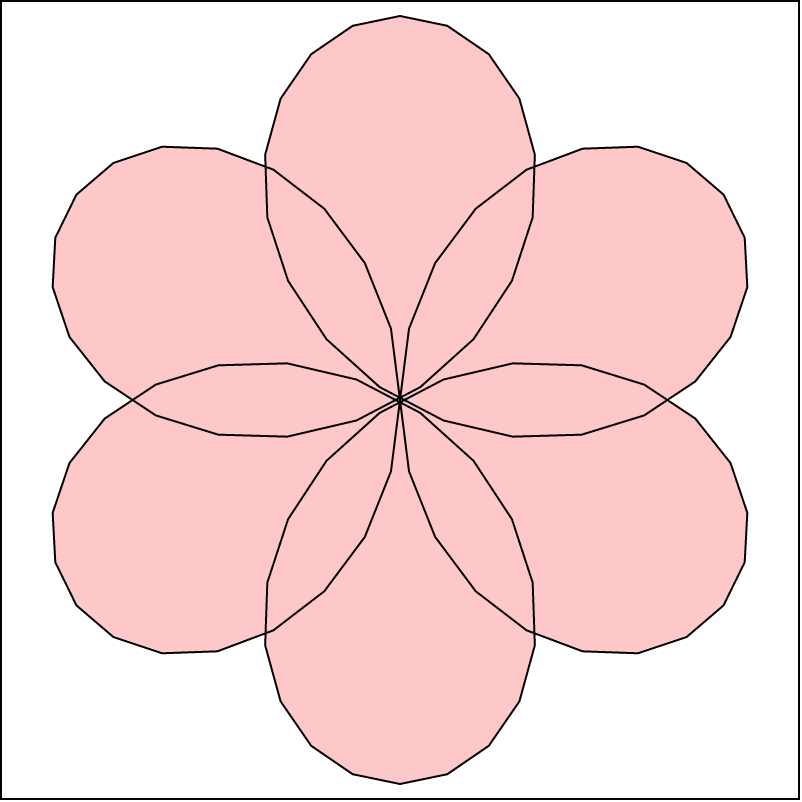
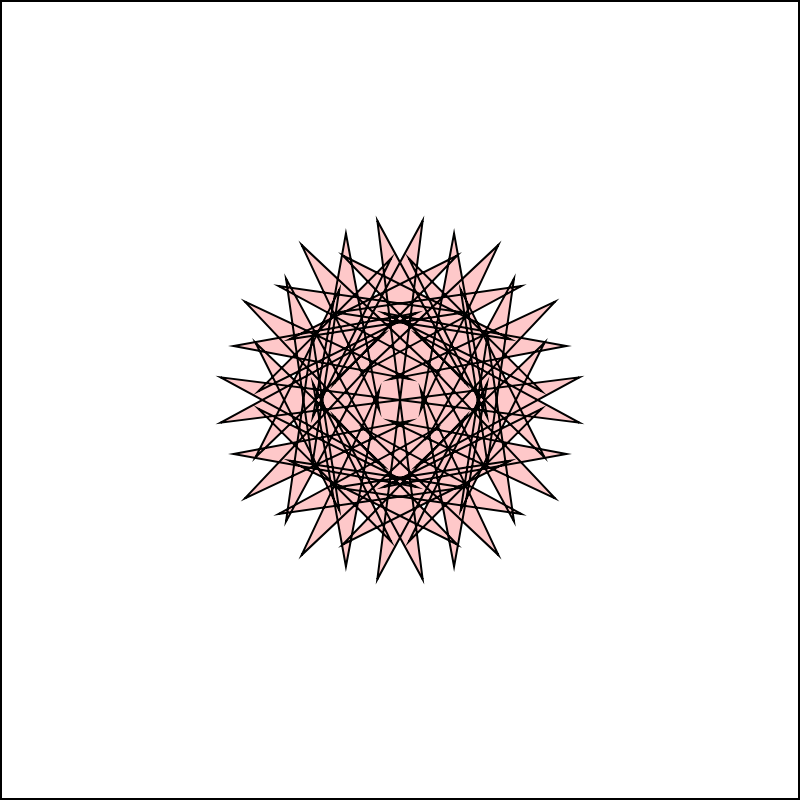
}    

In this project, I wanna design a floral pattern that can change colors using repeating geometries. The flower’s color changes to blue to read as the mouse moves diagonally on the canvas. The change of color also represents blossom.

Katherine Hua – Project-07 – Curves

sketch

/* Katherine Hua
Section A
khua@andrew.cmu.edu
Project-07-Curves */

function setup() {
    createCanvas(480, 480);
    frameRate(10);
}

function draw() {

	var r1 = map(mouseX, 0, width, 230, 250); // making variables to make the background dependent on mouseX or mouseY
	var g1 = map(mouseY, 0, height, 220, 230);
	var b1 = map(mouseX, 0, width, 225, 250);
    background(r1, g1, b1); // setting background color
    var nPoints = 200; // setting number of points on shape
    var radius;

// legs
	strokeWeight(5); 
	bezier(random(195, 205), 320, 150, 320, 240, 400, random(165, 175), 400); // left leg
	bezier(random(275, 285), 320, 320, 320, 240, 400, random(300, 310), 400); // right lelg

// body
	strokeWeight(5);
	fill(50, 50, 50);
	push();
    translate(width/2, height/2);
    beginShape();
    radius = 200;
    for (var i = 0; i < nPoints; i++) {
        var theta = map(i, 0, nPoints, 0, TWO_PI);
        var a = map(mouseX, 0, 480, 90, 110); //body will change sizes based on position of mouseX
        var n = map(mouseX, 0, 480, 40, 90);
        var px = (a/n)*(((n-1)*cos(theta))-(cos((n-1)*theta)));
        var py = (a/n)*(((n-1)*sin(theta))-(sin((n-1)*theta)));
        vertex(px + random(-5, 5), py + random(-5, 5));
    } endShape(CLOSE);
    pop();

// eyes	
	strokeWeight(1);
	fill(255);
	nPoints = 10;
	// whites of left eye
    push();
    translate(width/2 - 40, height/2 + 10);
    beginShape();
    radius = 30;
    for (var i = 0; i < nPoints; i++) {
        var theta = map(i, 0, nPoints, 0, TWO_PI);
        var px = radius * cos(theta);
        var py = radius * sin(theta);
        vertex(px + random(-5, 5), py + random(-5, 5));
    } endShape(CLOSE);
    pop();
    // whites of right eye
    push();
    translate(width/2 + 40, height/2 + 10);
    beginShape();
    radius = 30;
    for (var i = 0; i < nPoints; i++) {
        var theta = map(i, 0, nPoints, 0, TWO_PI);
        var px = radius * cos(theta);
        var py = radius * sin(theta);
        vertex(px + random(-5, 5), py + random(-5, 5));
    } endShape(CLOSE);
    pop();
    // pupil of left eye
    fill(0);
    nPoints = 4;
    push();
    translate(width/2 - 40, height/2 + 10);
    beginShape();
    radius = 10;
    for (var i = 0; i < nPoints; i++) {
        var theta = map(i, 0, nPoints, 0, TWO_PI);
        var px = radius * cos(theta);
        var py = radius * sin(theta);
        vertex(px + random(-5, 5), py + random(-5, 5));
    } endShape(CLOSE);
    pop();
    // pupil of right eye
    push();
    translate(width/2 + 40, height/2 + 10);
    beginShape();
    radius = 10;
    for (var i = 0; i < nPoints; i++) {
        var theta = map(i, 0, nPoints, 0, TWO_PI);
        var px = radius * cos(theta);
        var py = radius * sin(theta);
        vertex(px + random(-5, 5), py + random(-5, 5));
    } endShape(CLOSE);
    pop();
    
//arms
	noFill();
	strokeWeight(5);
	//making arms grabbing hand curve different depending if arms are reaching below or above the midpoint
	if (mouseY > width/2) {
		bezier(random(145, 155), 240, random(115, 125), 240, mouseX - 80, mouseY + 40, mouseX-50, mouseY-50); //left arm
		bezier(random(325, 335), 240, 360, random(235, 245), mouseX + 80, mouseY - 40, mouseX+50, mouseY-50); //right arm
	} else if (mouseY < width/2) {
		bezier(150, 240, 120, 240, mouseX - 80, mouseY + 40, mouseX-50, mouseY+50); //left arm
		bezier(330, 240, 360, 240, mouseX + 80, mouseY - 40, mouseX+50, mouseY+50);	//right arm
	}

	//star
	rectMode(CENTER);
	push();
	translate(mouseX, mouseY); //star will follow position of the mouse
	var r2 = map(mouseY, 0, height, 200, 230);
	var g2 = map(mouseY, 0, height, 150, 180);
	var b2 = map(mouseX, 0, width, 125, 175);
	fill(r2, g2, b2);
	stroke(r2, g2, b2);
    rect(0, 0, 20, 20);
    push();
    rotate(PI/4);
    rect(0,0, 20, 20);
    pop();
	pop();
}

My design is based off of one of my favorite childhood movies, “Spirited Away.” The character I created is supposed to be one of the coal spirit (or soot ball). Below is an image of how they look like:

Spirited Away coal spirits

These sootballs are constantly moving and really like to eat these star candies so made a star candy follor the mouse and the sootball’s arms try to reach for the candy.

Alessandra Fleck – Project 07

sketch

//Name: Alessandra Fleck 
//Class Section : B
//Email: afleck@andrew.cmu.edu
//Project-07


var Points = 500; //more points makes smoother curves
var Epitrochoid = 0; 

var x;
var y;


function setup() {
    createCanvas(480, 480);
    frameRate(40); //more frames = clearer motion
}

function draw() {
    background(0); // set background to black
    // draw the Epitrochoid

    push();
    translate(300, height / 2); //locate at upper left corner
    drawEpitrochoidCurve_01();
    //move second curve to lower right corner
    translate(width / 10, height/10);
    drawEpitrochoidCurve_02();
    //move second curve to lower right corner
    translate(width / 60, height/60);
    drawEpitrochoidCurve_03();
    pop();
}


function drawEpitrochoidCurve_01() { // for the curve on the top left corner
    
    
    var a =  40.0;
    var b = a / 0.2;
    var h = constrain(mouseY / 10.0, 0, b);
    var t;
    var mX = mouseX / 100.0; // mouse move over moves shape slower as value is larger
    var r = map(mouseX,0,width/0.8,0,1); //pulsing movement
    
    beginShape();
    fill(40,41,35);
    for (var i = 0; i < Points; i++) {

        stroke('red'); //add red to vibration lines
        strokeWeight(3);
        vertex(x, y);
        var t = map(i, 0, Points, 0, TWO_PI*3); // mess with curves within shapes

        //Parametric equations for Epitrochoid Curve
        x = r* ((a + b) * cos(t) - h * cos((t * (a + b) / b) + mX));
        y = r* ((a + b) * sin(t) - h * sin((t * (a + b) / b) + mX));
        
    }
    endShape(CLOSE);
    
}

function drawEpitrochoidCurve_02() { //for the curve on the bottom corner


    var a =  55.0;
    var b = a / 0.25; //degree of displacement
    var h = constrain(mouseY / 20.0, 0, b);
    var t;
    var mX = mouseX / 50.0;
    
    
    beginShape();
    fill(0);
    for (var i = 0; i < Points; i++) {
        stroke('red'); //add red to vibration lines
        strokeWeight(3);
        vertex(x+200, y+200);//set center point for the epitrochoid
        var t = map(i, 0, Points, 0, TWO_PI*3); // mess with curves within shapes
        
        //Parametric equations for Epitrochoid Curve

        x = (a + b) * cos(t) - h * cos((t * (a + b) / b) + mX);
        y = (a + b) * sin(t) - h * sin((t * (a + b) / b) + mX);
        
    }
    endShape(CLOSE);
    
}

function drawEpitrochoidCurve_03() { //for the curve on the bottom corner
    
    //light white line curves
    
    var a =  40.0;
    var b = a / 0.25; //degree of displacement
    var h = constrain(mouseY / 10.0, 0, b);
    var t;
    var mX = mouseX / 50.0;
    
    
    beginShape();
    fill(40,41,35);
    for (var i = 0; i < Points; i++) {
        stroke(255); //add red to vibration lines
        strokeWeight(1);
        vertex(x+200, y+200);
        var t = map(i, 0, Points, 0, TWO_PI*3); // mess with curves within shapes
        
        //Parametric equations for Epitrochoid Curve

        x = (a + b) * cos(t) - h * cos(mX + ((a + b) / b) + mX);
        y = (a + b) * sin(t) - h * sin(mX + ((a + b) / b) + mX);
        
    }
    endShape(CLOSE);
    
}

//http://mathworld.wolfram.com/Epitrochoid.html

For this project I just wanted to play with using the “b” variable in the parametric equation for an epitrochoid and using that variable as the axis for the degree of change in the movement. I did struggle a bit with the vertex parameter so if I continue this project that is what I would look to refine.

project 07

sketch,js

/* Arden Wolf
Section B
ardenw@andrew.cmu.edu
Project 07
*/


var nPoints = 20;
var radius = 50;
var separation = 125;

function setup() {
    createCanvas(480, 480);
    frameRate(10);
}

function draw() {
    background(0);
    noStroke();
    //magenta
    fill (50);
    ellipse(125,120,100,100);
    fill (80);
    ellipse(125,120,80,80);
    fill (100);
    ellipse(125,120,50,50);
    fill (120);
    ellipse(125,120,30,30);


    //yellow
    fill (50);
    ellipse(377,240,100,100);
    fill (80);
    ellipse(377,240,80,80);
    fill (100);
    ellipse(377,240,50,50);
    fill (120);
    ellipse(377,240,30,30);


    //calls light beam
    LightBeam(); 
    //calls wiggle
     wiggle();
    //call square
     square();


}

function LightBeam() {
  for(var h = 0; h < 100; h++) //allows for thicker lines
    {
        //yellow
         push();
        translate(3 * separation, height / 2);
        for (var i = 0; i < nPoints; i++) {
        var theta = map(i, mouseX, nPoints, mouseY, TWO_PI);
        var px = radius * cos(theta);
        var py = radius * sin(theta);
        stroke (255,255,0);
        line(-375, 238, px, py);
        }
        pop();

         push();
        translate(3 * separation, height / 2);
        for (var i = 0; i < nPoints; i++) {
        var theta = map(i, mouseX, nPoints, mouseY, TWO_PI);
        var px = radius * cos(theta);
        var py = radius * sin(theta);
        stroke (255,255,0);
        line(0, 238, px, py);
        }
        pop();


        //magenta
         push();
        translate( separation, height / 4);
        for (var i = 0; i < nPoints; i++) {
        var theta = map(i, mouseX, nPoints, mouseY, TWO_PI);
        var px = radius * cos(theta);
        var py = radius * sin(theta);
        stroke (255,0,255);
        line(360, 365, px, py);
        }
        pop();

         push();
        translate( separation, height / 4);
        for (var i = 0; i < nPoints; i++) {
        var theta = map(i, mouseX, nPoints, mouseY, TWO_PI);
        var px = radius * cos(theta);
        var py = radius * sin(theta);
        stroke (255,0,255);
        line(360, 0, px, py);
        }
        pop();
    }

}
function wiggle(){
    stroke(4);

    //first
    fill(255,165,0);
    push();

    translate(separation, height/1.7);
    beginShape();
    for (var i = 0; i < nPoints; i++) {
        var theta = map(i, mouseX, nPoints, mouseY, TWO_PI);
        var px = radius * cos(theta);
        var py = radius * sin(theta);
        vertex(px + random(-5, 5), py + random(-5, 5));
    }
    endShape(CLOSE);
    pop();

    //second
    fill(255,100,10);
    push();
    translate(separation, height/1.7);
    beginShape();
    for (var i = 0; i < nPoints; i++) {
        var theta = map(i, mouseX, nPoints, mouseY, TWO_PI);
        var px = radius * cos(theta)/2;
        var py = radius * sin(theta)/2;
        vertex(px + random(-5, 5), py + random(-5, 5));
    }
    endShape(CLOSE);
    pop();

}

function square(){
//first
    fill(255,100,10);
    push();
    translate(2*separation+40, height/1.18);
    beginShape();
    for (var i = 0; i < nPoints; i++) {
        var theta = map(i, mouseX, nPoints, mouseY, TWO_PI);
        var px = radius * cos(theta);
        var py = radius * sin(theta);
        vertex(px + random(-5, 5), py + random(-5, 5));
    }
    endShape(CLOSE);
    pop();

//second
    fill(255,165,0);
      push();
    translate(2*separation+40, height/1.18);
   beginShape();
    for (var i = 0; i < nPoints; i++) {
        var theta = map(i, mouseX, nPoints, mouseY, TWO_PI);
        var px = radius * cos(theta)/2;
        var py = radius * sin(theta)/2;
        vertex(px + random(-5, 5), py + random(-5, 5));
    }
    endShape(CLOSE);
    pop();
}

I was inspired by commits and stars in space and used the equations, mouseX and mouseY to make it interactive.

Sophie Chen – Project 07 – Curves

sketch

var x;
var y;

function setup() {
    createCanvas(480, 480);
    frameRate(25);
}

function draw() {
	background(0, 0, 0, 57);
	noFill();
	drawDeltoid();
	drawDeltoid2();
	drawDeltoid3();
}

// Outermost circle
function drawDeltoid(){

    var nPoints = 50;
	var radius = 50;
	var separation = 60;
	strokeWeight(1);
	stroke(150, 205, 255);
    push();
    translate(4 * separation, height / 2);
    beginShape();
    for (var i = 0; i < nPoints; i++) {
        var range = map(mouseX, 0, width, 0, 200)
        var px = range * cos(i) + cos(2 * i);
        var py = range * sin(i) - sin(2 * i);
        vertex(px + random(-mouseX / 30, mouseX / 80), py + random(-mouseX / 30, mouseX / 80));
    }
    endShape(CLOSE);
    pop();
}

// Middle circle
function drawDeltoid2(){

    var nPoints = 50;
    var radius = 50;
    var separation = 60;
    push();
    translate(4 * separation, height / 2);
    beginShape();
    for (var i = 0; i < nPoints; i++) {
        var px = mouseX / 4 * cos(i + mouseY / 50) + cos(2 * i);
        var py = mouseX / 4 * sin(i) - sin(2 * i);
        vertex(px + random(-5, 5), py + random(-5, 5));
    }
    endShape(CLOSE);
    pop();
}

// Inner circle

function drawDeltoid3(){

	var nPoints = 50;
    var radius = 50;
    var separation = 60;
    
    push();
    translate(4 * separation, height / 2);
    beginShape();
    for (var i = 0; i < nPoints; i++) {
        var px = mouseX / 4 * cos(i + mouseY / 50) + cos(2 * i);
        var py = mouseX / 4 * cos(i) - sin(2 * i);
        vertex(py + random(-5, 5), px + random(-5, 5));
    }
    endShape(CLOSE);
    pop();

}

At first I was a bit overwhelmed by all the mathematical equations for different curves, but once I settled on one and started playing around with it everything made a lot more sense. I really enjoyed the process of this project and changing every value in the equations to see and understand what they did.

Kevin Thies – Project 7 – Curves

sketch
Pretty early on I went through the site of curves, and I found the heart curves and decided I anted to do one. Conveniently, the one I thought looked best was straightforward to make. I was interested if JavaScript would take unicode as strings, and fortunately it does. Unfortunately, it’s plagued by an issue shared with many unicode sets – emoji. I had to make sure the unicode I wanted wouldn’t render as an emoji, because that just doesn’t look as crisp. In hindsight, it ould have been cool if I had used the function to generate a path for a moving heart like Lab 6, but there’s time for that in the future.

This was when I first got the points to work with the unicode
// Kevin Thies
// kthies@andrew.cmu.edu
// Section C
// Project 07 - Curve Composition

var pointNum = 100; // number of points in the heart
var bigScale = 20; // scale value of the largest heart
var smallScale = 2; // scale step of the iterations
var rotAngle = 1; // rotation angle of hearts
var rotIncrement = .02; // increment of rotation per frame in radians
var xScale; // mouse X - dependant scaling value of heart
var yScale; // mouse y - dependant scaling v alue of heart
var iterations = 10; // number of hearts drawn


function setup() {
  createCanvas(480,480);
}


function draw() {
    // style
    background(211,141,196);
    stroke(255,155,233);
    fill(0);

    // constrain the scaling of the X and Y of hearts
    xScale = constrain(map(mouseX, 0, width, 0, 1), .2, 1);
    yScale = constrain(map(mouseY, 0, height, 0, 1), .2, 1);

    // increment rotation
    rotAngle = rotAngle += rotIncrement;

    push();
    // move hearts to center of canvas
    translate(width/2, height/2);
    // rotate around center of canvas by the rotation angle
    rotate(rotAngle);

    // draw heart iterations
    for(var i = 0; i < iterations; i++) {
        // sizes decrease based on iteration number
        textSize(2 * (iterations - i));
        strokeWeight(.2 * (iterations - i));
        heartPoints(bigScale - i * smallScale, xScale, yScale);
    }
    pop();
}


function heartPoints(s, xS, yS) {
    // from http://mathworld.wolfram.com/HeartCurve.html
    // x = 16sin^3(t)
    // y = 13cos(t) - 5cos(2t) - 2cos(3t)- cos(4t)
    var x;
    var y;

    // grab x and y coords for pointNum amount of points
    for(var j = 0; j < pointNum; j++) {
        var t = map(j, 0, pointNum, 0, TWO_PI);

        // calculate x and y of asterisks
        x = xS * s * (16 * pow(sin(t), 3));
        y = yS * s * (13 * cos(t) - 5 * cos(2 * t) - 2 * cos(3 * t) - cos(4 * t));

        // place a unicode heart at the point, counter-rotate it
        push();
        translate(x, y);
        rotate(-rotAngle);
        text("♥", 0, 0);
        pop();
    }
}

Project 07 – Curves

sketch

function setup() {
    createCanvas(480, 480);
    frameRate(15);
}

function draw() {
	background(255, 200, 200);
    fill(255, 255, 255, 64);
    var nPoints = 30;
    var radius = 30;

    //fire body
    //red fire
    push();
    translate(width / 2 - 30, height / 2);
    beginShape();
    noStroke();
    fill(201, 75, 56);
    beginShape();
    for (var i = 0; i < nPoints ; i++) {
        var theta = map(i, 0, nPoints, 0, TWO_PI);
        var px = 5.5 * radius * cos(theta);
        var py = 5.5 * radius * sin(theta);
        if (i > 15 & i < 24) {
        	vertex(px + random(-2, 2), py + random(-2, 2) - 50);
        } else {
        	vertex(px + random(-2, 2), py + random(-2, 2));
        }
    }
    endShape();
    pop();

    //red-orange fire
    push();
    translate(width / 2 - 30, height / 2);
    beginShape();
    noStroke();
    fill(230, 112, 84);
    beginShape();
    for (var i = 0; i < nPoints ; i++) {
        var theta = map(i, 0, nPoints, 0, TWO_PI);
        var px = 5 * radius * cos(theta);
        var py = 5 * radius * sin(theta);
        if (i > 15 & i < 24) {
        	vertex(px + random(-2, 2), py + random(-2, 2) - 50);
        } else {
        	vertex(px + random(-2, 2), py + random(-2, 2));
        }

    }
    endShape();
    pop();

    //orange fire
    push();
    translate(width / 2 - 30, height / 2);
    beginShape();
    noStroke();
    fill(235, 173, 78);
    beginShape();
    for (var i = 0; i < nPoints; i++) {
        var theta = map(i, 0, nPoints, 0, TWO_PI);
        var px = 3.5 * radius * cos(theta);
        var py = 3.5 * radius * sin(theta);
        if (i > 13 & i < 22) {
        	vertex(px + random(-4, 4), py + random(-4, 4) - 40);
        } else {
        	vertex(px + random(-4, 4), py + random(-4, 4));
        }

    }
    endShape();
    pop();

    //yellow fire
    push();
    translate(width / 2 - 30, height / 2);
    beginShape();
    noStroke();
    fill(240, 209, 90);
    beginShape();
    for (var i = 0; i < nPoints; i++) {
        var theta = map(i, 0, nPoints, 0, TWO_PI);
        var px = 1.5 * radius * cos(theta);
        var py = 1.5 * radius * sin(theta);
        if (i > 14 & i < 24) {
        	vertex(px + random(-5, 5), py + random(-5, 5) - 30);
        } else {
        	vertex(px + random(-5, 5), py + random(-5, 5));
        }

    }
    endShape();
    pop();

    //left cheek
    beginShape();
    smooth();
    noFill();
    curveVertex(width / 4 + 5 + random(-2, 2), height / 2 + 60 + random(-2, 2));
    curveVertex(width / 4 + 5 + random(-2, 2), height / 2 + 50 + random(-2, 2));
    curveVertex(width / 4 + 10 + 10 + random(-2, 2), height / 2 + 50 - 10 + random(-2, 2));
    curveVertex(width / 4 + 10 + 20 + 5 + random(-2, 2), height / 2 + 50 - 5 + random(-2, 2));
    curveVertex(width / 4 + 10 + 20 + 8 + random(-2, 2), height / 2 + 50 + 14 + random(-2, 2))
    curveVertex(width / 4 + 10 + 20 + random(-2, 2), height / 2 + 50 + 20 + random(-2, 2))
    endShape();

    //right cheek
    beginShape();
    smooth();
    noFill();
    curveVertex(width / 2 + 60 + random(-2, 2), height / 3 + 40 + random(-2, 2));
    curveVertex(width / 2 + 40 + random(-2, 2), height / 3 + 20 + random(-2, 2));   
    curveVertex(width / 2 + 40 - 12 + random(-2, 2), height / 3 + 20 + 15 + random(-2, 2));
    curveVertex(width / 2 + 40 + random(-2, 2), height / 3 + 20 + 30 + random(-2, 2));
    curveVertex(width / 2 + 40 + 10 + random(-2, 2), height / 3 + 20 + 30 + random(-2, 2))
    curveVertex(width / 2 + 80 + random(-2, 2), height / 3 + 30 + random(-2, 2))
    endShape();

    //mouth
    beginShape();
    smooth();
    noFill();
    curveVertex(width / 4 + 10 + 20 + 5 + random(-2, 2) - 20, height / 2 + 50 - 5 + random(-2, 2) + 50);
    curveVertex(width / 4 + 10 + 20 + 5 + random(-2, 2), height / 2 + 50 - 5 + random(-2, 2));
    curveVertex(width / 4 + 10 + 20 + 30 + random(-2, 2), height / 2 - 25 + random(-2, 2));
    curveVertex(width / 2 + random(-2, 2) - 20, height / 2 - 30 + random(-2, 2));
    curveVertex(width / 2 + 40 - 12 + random(-2, 2), height / 3 + 20 + 15 + random(-2, 2));
    curveVertex(width / 2 + 40 - 12 + random(-2, 2) + 30, height / 3 + 20 + 15 + random(-2, 2));
    endShape();

	//left eye
    push();
    fill(255);
    translate(width / 4, height / 2);
    beginShape();
    for (var i = 0; i < nPoints; i++) {
        var theta = map(i, 0, nPoints, 0, TWO_PI);
        var px = radius * cos(theta);
        var py = radius * sin(theta);
        vertex(px + random(-1, 1), py + random(-1, 1));
    }
    endShape(CLOSE);

    //left pupil

    push();
    fill(0);
    var mouseXeyes = map(mouseX, 0, 1000, -10, 10);
    var mouseYeyes = map(mouseY, 0, 800, -10, 10);
    ellipse(mouseXeyes, mouseYeyes, 20, 20);
    pop();

   	//right eye
    translate(width / 4,  -height / 6);
    beginShape();
    for (var i = 0; i < nPoints; i++) {
        var theta = map(i, 0, nPoints, 0, TWO_PI);
        var px = radius * cos(theta);
        var py = radius * sin(theta);
        vertex(px + random(-1, 1), py + random(-1, 1));
    }
    endShape(CLOSE);

    //right pupil
    push();
    fill(0);
    var mouseXeyes = map(mouseX, -500, 1000, -10, 10);
    var mouseYeyes = map(mouseY, -500, 1000, -10, 10);
    ellipse(mouseXeyes, mouseYeyes, 20, 20);
    pop();

    pop();

  	//bottom text
  	stroke(0);
  	fill(0);
  	textFont("Georgia");
  	textSize(22);
  	text("calcifer.", width / 2 - 30, height / 10 * 9 + 10);

    //egg
    push();
    noStroke();
    fill(255);
    beginShape();
    smooth();
    ellipse(mouseX, mouseY, 50, 60)
  	endShape(CLOSE);
  	stroke(0);
  	beginShape();
  	vertex(mouseX - 23, mouseY - 10)
   	vertex(mouseX - 15, mouseY - 2)
	vertex(mouseX - 5, mouseY - 10)
  	vertex(mouseX + 5, mouseY - 2)
	vertex(mouseX + 15, mouseY - 10)
	vertex(mouseX + 25, mouseY - 2)
	endShape();
  	pop();

}

For this project, I was inspired by the moving circle in the example given. I used this to attempt to recreate one of my favorite characters from Studio Ghibli, Calcifer. The moving points give Calcifer the feel of a live fire.

Miranda-Luong-Project-07-Curves

sketch

/* Miranda Luong
Section E
mluong@andrew.cmu.edu
Project-07
*/


var nPoints = 100;


function setup() {
    createCanvas(400, 400);
    frameRate(10);
}


function draw() {
    background(255);
    
    // draw the frame
    fill(0); 
    noStroke();

    stroke(0);
    noFill(); 
    rect(0, 0, width-1, height-1); 
    
    translate(width / 2, height / 2);
    drawEpicycloidCurve();
}

//--------------------------------------------------
function drawEpicycloidCurve() {
    // Epicycloid:
    // http://mathworld.wolfram.com/Epicycloid.html
    
    var x;
    var y;
    
    var a = 80.0;
    var b = a / 2.0;

    //Uses mouseX and mouse Y to define the number of petals and overall scale of curve
    var n = round(dist(mouseX,mouseY,width/2,height/2)/5);
    
    fill(255, 200, 200);
    beginShape();
    for (var i = 0; i < nPoints; i++) {
        var t = map(i, 0, nPoints, 0, TWO_PI);
        
        x = (n + 2) * (cos(t) - cos((n + 1) * t));
        y = (n + 2) * (sin(t) - sin((n + 1) * t));

        vertex(x, y);
    }
    endShape(CLOSE);    
}

This was a really hard project to complete. It was hard translating the functions into code, seeing as I don’t really know much math anymore. It took lots of trial and error trying to navigate which variables controlled what in my function. I’m quite happy with the results though, I think it is a very pretty display.

Miranda-Luong-Looking-Outwards-07


Above: Rhythm of Food-Selected Animations sourced from Truth & Beauty’s website.

Google News Lab and Truth & Beauty‘s Rhythm of Food (uses Google search interest to reveal food trends over the years. At first, they compiled this data in a normal line graph specific for every kind of trend in food. However, realizing the potential to dig deeper and better analyze this data, they collected weekly Google Trends data for hundreds of dishes and ingredients, over twelve years and plotted the results on a one year clock. What I find intriguing is this decision to plot the data on a one year clock, considering they had collected 12 years worth of data. It seems their rationale was to harrow in and have viewers see the correlation between seasons and food trends, in addition of time, versus only seeing the difference over time. I admire their decision to do this because it took the extra step of thinking of a new way to visualize food trends that people are most familiar with. The changing of seasons is something that is very prominently linked to food trends, a hidden trend we didn’t realize in terms of data. In addition, the decision to shape and orient the graph in such a way similar to a clock is interesting as it reminds us of the cyclical nature of this data, while still effectively demonstrating the scale of the number of these searches. According to Truth & Beauty, the project was built using  ES2015, webpackreactMaterial UI, and d3 v4. The color scale used for the years is viridis.

Sophie Chen – Looking Outwards – 07

Melting Memories by Refik Anadol Studio

Melting Memories on display

Melting Memories is a series of multi-dimensional digital artworks that explore the materiality of remembering through different ways of representing EEG data collected on the neural mechanisms of cognitive control. What viewers experience are aesthetic interpretations of motor movements inside a human brain. I was immediately drawn to the level of abstraction of the human mind that this project was able to visually achieve. The Neuroscape Laboratory at the University of California, San Francisco gathers data and changes in brain wave activity which are the building blocks for the algorithms that the artists need. The team was able to use a composite design pattern to quickly iterate the project, and this way of working allowed them to explore many different complex functions while maintaining a modular graphics pipeline. I really admire the level of integration between data and visuals that this project was able to achieve.

Data capture & abstraction process