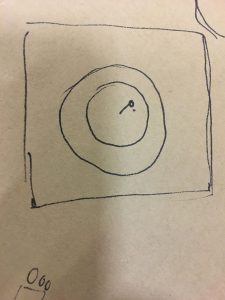
LO7 Liz Maday

The 9/11 memorial in NYC

Jer Thorpe – 9/11 Memorial

The 9/11 memorial displays about 3,000 names inscribed into bronze panels surrounding two pools of water. The placement of these names may seem to be random, but they are actually specifically arranged according to an algorithm that was created by data artist Jer Thorpe.

The algorithm was built in Processing, and was made to accommodate requests by family members to have names meaningfully placed adjacent to other names, reflecting the relationships and connections between the victims. For example, the investment bank Cantor Fitzgerald was devastated by the attack, losing more than 700 employees and people associated with the company. On the memorial, all these names are listed together, encompassing large portion of the memorial. Even within this section, certain names are placed next to each other to indicate close relationships.

Visualization of the algorithm.

The algorithm works by first putting names into large clusters based on the adjacency requests. Then it figures out where to place these large clusters of names on the memorial, filling in the spaces.

I think this is an amazing example of how a program is able to reflect very human emotions and intentions while also utilizing a precision and complexity that is above human ability.

Lan Wei-Looking Outwards-03

Design Miami Pavilions: Flotsam & Jetsam

The project was designed by SHoP Architects in 2016.  What is amazing about the project is the completely digital design and the 100% 3D-printing. As a designer, I feel very excited about the power of machine to achieve what human cannot achieve, which sets free designer’s imagination and has potential to bring more exciting works to our physical world. As an architecture student, I was tortured by endless repetitive work in design process but now I believe computational fabrication will take all the job in the future and designers can focus on the intellectual work.

The material used in the prpavilion is carbon fiber, which has both high strength and the flexibility and thus can be used in 3D printing. The design can be achieved using Rhino and Grasshopper. Another thinking of mine is that the design can be integrated with ecological features such as having plants in its structure.

The view inside of the pavilion

http://www.shoparc.com/projects/design-miami-flotsam-jetsam/

KadeStewart-Project-06-AbstractClock


sketch

//Kade Stewart
//Section B
//kades
//Project-05


function setup() {
    createCanvas(480, 480);
    background(255);

    noStroke();
}

var m;
var sec;
var hr;
var min;


function draw() {
    background(255,255,153);
    sec = second();
    min = minute();
    if ((min / 10) < 1) {
    	min = "0" + min;
    }
    hr = hour() % 12;
    if (hr == 0) {
    	hr = 12;
    }


    noStroke();
    fill(30,144,255);
    textSize(45);
    text(min, width/2 - 25, height - 5);
	fill(255,255,153);
	noStroke();
	rect(width/2 - 30, height - 60 - ((height/60)*sec), 60, (hr * 20) + 40);


	//draw the waterlines for each hour
    for (y=0; y < hr; y++) {
    	//this draws the entire length of the window
        for (i=0; i < width; i++) {
            noStroke();
            if (y % 2 == 0) {
            	fill(255); 			//draw in white and blue, alternating every line
            } else {
            	fill(230, 230, 255);
            }
            //the line is composed of circles
            ellipse(i, ((height + (y*20)) - (height/60)*sec) + sin(i/6), 6, 6);	
        }
    }


    //draw the lines of the face
    noFill();
    stroke(0);
    strokeWeight(3);
    arc(width/2, height/2 + 60, 30, 20, PI/2, (5/4) * PI);
    arc(width/2, height/2 + 40, 30, 30, (3/4) * PI, PI);
    line(width/2 - 8, height/2 + 52, width/2 + 2, height/2 + 56);
    arc(width/2, height/2 + 64, 16, 16, (3/2) * PI, (7/4) * PI);
    arc(width/2 - 15, height/2 + 25, 30, 30, 0, PI/2);
    arc(width/2, height/2, 50, 50, PI/2, (3/2) * PI);
    arc(width/2, height/2 - 55, 10, 60, (3/2) * PI, PI/2);

    //draw the tear
    push();
    translate(width/2, height/2 - 25);
    
    m = floor(millis()) % 1000;
    m = map(m, 0, 1000, 0, height - (height/2 - 25));


    fill(30,144,255);
    ellipse(0, m, 12, 12 + m * .025);

    pop();

}

I was listening to my sad song playlist, and to me it seemed that tears were pretty rhythmic. I used them to create the second “hand”, while creating the illusion that the tears were filling up the page with the waterlines. Each line (technically a sine wave) represents an hour on the clock. The minutes are simply show, but only when the water rises above the bottom of the page.

Min Jun Kim- Project 7 Curves

Try clicking and dragging!
sketch

/*
Min Jun Kim
minjunki@andrew.cmu.edu
15104-B
Project 7
*/

//This project draws a 3D model of spherial spiral

//how many points there are
var nPoints = 500;
//used for dragging
var dragging = false;

function setup() {
    createCanvas(480, 480, WEBGL);
    frameRate(100);
}


function draw() {
    background(0);
    // draw the frame
    stroke(255);
    noFill(); 
    rect(-width/2+3, -height/2+3, width-6, height-6); 
    //a circle that follows the mouse
    ellipse(mouseX-width/2,mouseY-height/2, 50,50);


    // draws the curve
    push();
    //rotate on z axis automatically, rotate x and y when clicked
    rotateZ(millis() / 8000);
    if (dragging == true) {
    	rotateX((mouseX-width/2) / 500);
	    rotateY((mouseY-height/2) / 500);
    }
    //calls drawing function.
    drawSphericalSpiral();
    pop();
}

//--------------------------------------------------
function drawSphericalSpiral() {
    // Spherical Spiral
    // http://mathworld.wolfram.com/SphericalSpiral.html
    //initialize points
    var x;
    var y;
    var z;
    //complexity depends on mouse
    var ph = mouseX / 10000.0;
    stroke(255);
    //transparent fill
    fill(255, 200, 200,3);
    beginShape();
    for (var i = 0; i < nPoints; i++) {
        var t = map(i, 0, nPoints, 0, TWO_PI);        
        x = 80*cos(i)/Math.pow(1+ph*ph*t*t,1/2);
        y = 80*sin(i)/Math.pow(1+ph*ph*t*t,1/2);
        z = 80*-ph*i/Math.pow(1+ph*ph*t*t,1/2);
        vertex(x, y, z);
    }
    endShape(CLOSE);
 	
}

function mousePressed() {
	dragging = true;
}

function mouseReleased() {
	dragging = false;
}

At first, I didn’t quite understand how to use mathematical functions to draw, but after messing around with the vertices, I learned the basics of it. I messed around with various functions, but I wanted to use a more complex curve. I then tried to implement a 3D function and the one that I liked the most was a spherical spiral. I thought that the shape was interesting in the drawings I found online. I realized that it doesn’t look exactly like that image I found online, which can possibly partly be attributed to the lack of negative values available in the functions, but I think that it still looks very interesting. The constant rotation made me dizzy so I implemented a dragging function so that it looks much simpler from one side. From the z axis, it looked like a regular circle so I made the coloring of it more transparent so that the planes are more see-through. I think the project turned out great and it taught me a lot about how to draw in javascript.

Here are some iterations where I was messing around with the numbers and variables in the function.

Process documentation 1.
Process documentation 2.

Jisoo Geum Project – 06

sketch

// Jisoo Geum
// Section B
// jgeum@andrew.cmu.edu 
// Project-06
var prevSec;
var millisRolloverTime;
var sx =[];
var sy =[];
var gx = [];
var gy = [];
var pr = 0;
var pg = 0;

function setup() {
    createCanvas(480, 480);
    millisRolloverTime = 0; 
    angleMode(DEGREES);
}

function draw() {
    background(188,236,235);
    var H = hour();
    var M = minute();
    var S = second();
    
    //shadow 
    noStroke();
    fill(148,219,217);
    ellipse(240,400,350,50);
    

    // top part of the pomegranate 
    var colR = map (H,0,24,82,224);
    var colG = map (H,0,24,193,0);
    fill(colR,colG,86);
    triangle(240,53,260,115,220,115);
    triangle(260,85,270,115,250,115);
    triangle(220,85,230,115,210,115);
    
    //body of the pomegranate 
    strokeWeight(10);
    stroke(colR,colG,86);// outer layer color changes every hour (from green to ) 
    fill(255,242,205); // inner layer color 
    rect(90,120,297,280,120); 
    noStroke();
    fill(165,0,70); // darker part inside the pomegranate  
    rect(111,140,256,241,100);
    fill(255,242,205); 
    rect(222,113,35,23,50); // tip part 
    rect(230,128,20,262); // the line that divides the pomegranate 
    
    // seeds 
    for(var i = 0; i < M; i++){
        // number of seeds change depending on the current minute 
        sx =[212,193,272,214,269,214,269,214,269,214,269,214,269,214,269,212,272,191,293,193,290,290,193,290,193,290,193,290,193,290,192,291,171,312,172,311,172,311,172,311,172,311,172,311,170,313,150,333,150,334,150,334,148,335,151,333,130,353,130,353];
        sy =[166,219,166,194,194,220,220,246,246,298,272,271,298,324,324,350,350,167,167,193,193,219,245,245,270,271,297,297,323,323,349,349,181,181,207,207,233,233,259,259,285,285,311,311,337,337,198,198,230,230,260,260,287,287,318,318,239,239,265,265];
        gx = [210,195,269,213,271,213,270,213,271,213,271,213,271,213,271,210,273,192,297,195,293,293,197,292,195,297,197,297,195,297,196,298,174,319,175,318,175,318,173,318,175,318,174,318,174,310,153,340,154,340,153,340,151,342,154,339,133,360,133,360];
        gy = [162,217,163,193,191,217,217,243,243,295,268,268,295,321,321,347,347,167,167,191,191,216,243,242,267,273,299,299,320,325,351,351,183,183,209,209,235,235,256,261,282,287,308,313,339,339,200,200,232,232,261,261,289,289,320,320,241,241,267,267];
        
        // to make the seeds rotate by seconds 
        push();
        var tilt = (S*(30));
        translate(sx[i], sy[i]);
        rotate(tilt); 
        fill(255, 63, 113);
        ellipse(0,0, 15, 22); 
        pop();

        //the white glow 
        fill(255);
        ellipse (gx[i],gy[i],5,5);
     
    }
}

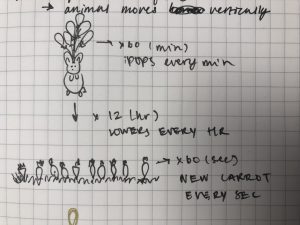
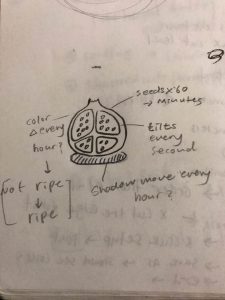
I decided to use the seeds in a pomegranate to describe minutes and then make them rotate to represent seconds. The color of the pomegranate changes every hour, turning from green to red.

The most challenging part of this assignment was putting all the coordinates for the seed values. I knew that there would be a way to use ratio and for loop to avoid the tedious part, but I could not figure out how to use it with the minute () function.

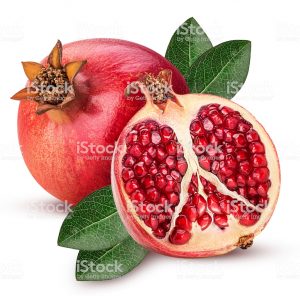
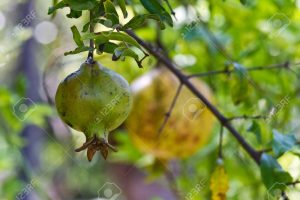
The reason why I chose to make the colors change from green to red is to show how a pomegranate’s color changes over time as it becomes ripe.

Project 6 Liz Maday

final liz maday 6

var r;
var g;
var b;
var array = [];
var array2 = [];
var array3 = [];

function setup() {
	createCanvas(415, 210);
}
 function draw() {
 	background('lightblue');
 	strokeWeight(1.5);
 	var s = second();
 	var m = minute();
 	var h = hour();

    //lines
    for (var i = 0; i < 7; i += 1) {
    	var space = 60;
    	var x = (i * space) + 20;
    	var y = 0;
    	line(x, y + 50, x, (y + 65));
    	array = ['0s', '10s', '20s', '30s', '40s', '50s', '60s'];
    	array2 = ['0m', '10m', '20m', '30m', '40m', '50m', '60m'];
        textSize(15);
        fill('red');
        text(array[i], x - 10, y + 20);
        fill('green');
        text(array2[i], x - 10, y + 40);
    }
    
    //second boxes
    for (var i = 0; i < s; i += 1) {
    	var x = (i * (space/10)) + 15;
    	var y = 80;

    	fill('red');
    	rect(x, y, 5, 5);

    }

    //minute boxes
    for (var i = 0; i < m; i += 1) {
    	var x = (i * (space/10)) + 15;
    	var y = 90;
    	fill('green');
    	rect(x, y, 5, 15);
    }

    //hour boxes
    for (var i = 0; i < h; i += 1) {
    	var x = (i * 10) + 15;
    	var y = 110;
    	fill('yellow');
    	rect(x, y, 10, 25);

    }

    //hour lines
    for (var i = 0; i < 5; i += 1) {
    	var space = 40;
    	var x = (i * space * 1.5) + 20;
    	var y = 150;
    	line(x, y, x, (y + 15));
    	textSize(15);
    	array3 = ['0hrs', '6hrs', '12hrs', '18hrs', '24hrs'];
    	text(array3[i], x - 10, y + 40);
    	
    }    

 }

I liked how this project made me think about how time can be efficiently displayed in a more simplistic way than a typical clock. My concept for this project had to adjust a few times, as I was still figuring out how to manipulate the time functions.

Yingying Yan – Project 06 – Abstract Clock

sketch

/*
Yingying Yan
Section E
yingyiny@andrew.cmu.edu
Project-06
*/

function setup() {
    createCanvas(480, 480);
    angleMode(DEGREES);
}

function draw() {

    background(13, 18, 54)

	translate(240,240)
    //change hour, min and sec into variables
	var hr = hour();
    var min = minute();
    var sec = second();

    //rotate the entire canvas so people can read it as a clock

    rotate(-90);
    noFill();

    //remap hour into 360 degree angles and draw an
    //arc that keeps track of the hours
    var mappedHr = map(hr % 12, 0, 12, 0, 360);
    push();
    stroke(5, 167, 221);
    strokeWeight (20);
    arc(0,0,300,300, 0, mappedHr);
    pop();
    //remap min into 360 degree angles and draw an
    //arc that keeps track of the minutes
    var mappedMin = map(min, 0, 59, 0, 360);
    push();
    stroke(223, 230, 244);
    strokeWeight(10);
    arc(0,0,200,200, 0, mappedMin);
    pop();

    //remap second into 360 degree angles
    var mappedSec = map(sec, 0, 59, 0, 360);

    //re rotate the circlces or planets
    push()
    rotate(-45)

    //planet one which follows the hour
    push()
    rotate(mappedHr);
    noStroke()
    fill(42, 51, 127, 100);
    ellipse(100, 100, 50, 50);
    pop();

    //planet two which follows the minutes
    push()
    rotate(mappedMin);
    noStroke()
    fill(181, 175, 215);
    ellipse(70, 70, 25, 25);
    pop()
    
    //planet three which follows the seconds
    push();
    rotate(mappedSec);
    strokeWeight(2);
    fill(38, 13, 52);
    ellipse(50, 50, 10, 10);
    line(0,0,47.5,47.5);
    pop();
    pop();

}

For this project, I wanted to make a simple clock without hands or number. But something similar to how one planet rotates around another in a certain amount of time. So I choose to keep track of hour, minutes and sections with a circle similar to the shapes of the planets. I began with something very complicated but I could not figure out how to do that, so I changed my mind to make something simple and abstract.

Romi Jin – Project-05-Abstract Clock

sketch

/*
Romi Jin
Section B
rsjin@andrew.cmu.edu
Project-06
*/

var hr;
var min;
var sec;

var secMap;
var minMap1;
var minMap2;
//var hrMap;

function setup() {
    createCanvas(480, 900);
    background(255, 228, 225);
    angleMode(DEGREES);

    //carrots redraw
    for(var i = 0; i < second(); i++) {
        push();
        carrots(i*(width/60));
        pop();
    }
}

function draw() {

    hr = hour();
    min = minute();
    sec = second();

    secMap = map(sec, 0, 60, 0, width);
    minMap1 = map(min, 0, 60, 50, height-100);
    minMap2 = map(min, 0, 60, 101, height-50);
    //hrMap = map(hr % 12, 0, 12, 0, height);

    push();
    balloons(minMap1);
    pop();
    push();
    bunny(minMap2);
    pop();
    push();
    carrots(secMap);
    pop();
    grass();

    //redraw canvas after one minute so the carrots begin at 0 again
    if (sec==59) {
        background(255,228,225);
        push();
        balloons(50+min+10);
        pop();
        push();
        bunny(101+min+10);
        pop();
        grass();
    }

}

function carrots(xpos) {

    translate(xpos+5, height-13);
    noStroke();

    //left stem 
    push();
    rotate(-20);
    fill(114, 173, 101);
    ellipse(2, -10, 2, 4);
    pop();

    //right stem
    push();
    rotate(20);
    fill(114, 173, 101);
    ellipse(-2, -10, 2, 4);
    pop();

    //middle stem
    fill(114, 173, 101);
    ellipse(0, -10, 3, 6);

    //carrot body
    fill(249, 181, 118);
    ellipse(0, 0, 6, 18);

}

function grass() {

    translate(2, height);
    stroke(203, 232, 189);
    strokeWeight(2);

    //vertical
    var x = 0; //spacing
    for (i = 0; i < width; i++) {
        line(i + x, 0, i + x, -15);
        x += 5; 
    }

    //diagonal
    var x = 0; //spacing
    for (i = 3; i < width; i++) {
        line(i + x, 0, i + x + 3, -15);
        x += 5; 
    }

}

function balloons(ypos) {

    var vals = [240, 220, 210, 265, 235, 255];
    var balloonD = 30;

    //strings
    push();
    stroke(0);
    strokeWeight(0.25);
    line(vals[0], ypos+17.5, width/2, ypos+100);
    line(vals[1], ypos+17.5, width/2, ypos+100);
    line(vals[2], ypos+17.5, width/2, ypos+100);
    line(vals[3], ypos+17.5, width/2, ypos+100);
    line(vals[4], ypos+17.5, width/2, ypos+100);
    line(vals[5], ypos+17.5, width/2, ypos+100);
    pop();

    //balloons
    push();
    noStroke();

    fill(255, 250, 165);
    ellipse(vals[1], ypos+10, balloonD, balloonD+5);
    fill(255, 250, 200);
    ellipse(vals[2], ypos-10, balloonD, balloonD+5);
    fill(190, 240, 235);
    ellipse(vals[3], ypos+10, balloonD-5, balloonD);
    fill(190, 250, 200);
    ellipse(vals[4], ypos-20, balloonD, balloonD+5);
    fill(190, 225, 200);
    ellipse(vals[5], ypos-15, balloonD, balloonD+5);
    fill(255, 221, 165);
    ellipse(vals[0], ypos, balloonD, balloonD+5);
    pop();

}

function bunny(ypos) {

    fill(255);
    stroke(0);
    strokeWeight(0.75);
    //right ear
    push();
    translate(width/2+4, ypos);
    rotate(10);
    ellipse(0, 0, 5, 15);
    pop();
    //left ear
    push();
    translate(width/2-4, ypos);
    rotate(30);
    ellipse(0, 0, 5, 15);
    pop();
    //tail
    ellipse(width/2-15, ypos+41, 8);
    //right foot
    push();
    translate(width/2-10, ypos+49);
    rotate(-45);
    ellipse(18, 15, 8, 12);
    pop();
    //body
    ellipse(width/2, ypos+27, 40, 50);
    //left foot
    push();
    translate(width/2-10, ypos+49);
    rotate(-45);
    arc(3, 4, 8, 12, -10, 260, OPEN);
    pop();
    //left cheek
    push();
    noStroke();
    fill(255, 228, 225);
    ellipse(width/2-7, ypos+19, 6);
    pop();
    //right cheek
    push();
    noStroke();
    fill(255, 228, 225);
    ellipse(width/2+14, ypos+18, 6);
    pop();
    //left eye
    push();
    strokeWeight(3);
    point(width/2-5, ypos+17);
    pop();
    //right eye
    push();
    strokeWeight(3);
    point(width/2+12, ypos+16);
    pop();
    //nose
    line(243, ypos+18, 244, ypos+19);
    line(244, ypos+19, 245, ypos+18);
    //left hand
    push();
    translate(width/2-10, ypos+31);
    rotate(-45);
    arc(3, 4, 6, 8, -10, 250, OPEN);
    pop();
    //right hand
    push();
    translate(width/2-10, ypos+33);
    rotate(-45);
    arc(18, 15, 6, 8, -10, 250, OPEN);
    pop();

}


For my clock, I illustrated a bunny floating down on balloons as time passes. The carrots at the bottom indicate the seconds passed, the bunny moves down as each minute passes, and the bunny resets (goes back to the top) after 12 hours. I wanted to do a lot more with this project (i.e. make the balloons different colors and disappear after each minute went by (it would begin with 60 balloons) and the bunny moving down every hour instead of ever minute), but I ran out of time and was more difficult than I thought it’d be. However, I had so much fun making this project and loved coming up with ideas to make a non-conventional clock! (also, it looks like an iPhone wallpaper I would use!!)

Philip Gates – Project 06 – Abstract Clock

sketch

function setup() {
    createCanvas(400, 400);
}

function draw() {
    
    //fetches increments of time
    var H = hour();
    var M = minute();
    var S = second();
    var totalSec = ((H * 3600) + (M * 60) + S); //calculates total # seconds in day so far

    //maps increments of time to circle size
    var mappedH = map(H, 0, 23, 0, 200); 
    var mappedM = map(M, 0, 59, 0, 150); 
    var mappedS = map(S, 0, 59, 0, 100);

    //maps increments of time to color values
    var colorH = map(H, 0, 23, 255, 0); 
    var colorM = map(M, 0, 59, 255, 0); 
    var colorS = map(S, 0, 59, 255, 0); 
    
    //creates grayscale roughly in accordance with time of day
    var sky1 = map(totalSec, 0, 43200, 0, 255); //midnight-noon goes from black to white
    var sky2 = map(totalSec, 43201, 86400, 255, 0); //noon-midnight goes from white to black
    
    background(255);

    //draw background circle, fill according to time of day
    if (totalSec <= 43200) {
        fill(sky1);
    }   else {
        fill(sky2);
    }   ellipse(width/2,height/2,width,height);

    //draw circles that expand as increments of time grow
    //fill with colors that get more saturated as increments of time increase
    noStroke();
    fill(colorH,255,255);
    ellipse(150, 130, mappedH, mappedH); //hour
    fill(255,colorM,255);
    ellipse(260, 270, mappedM, mappedM); //minute
    fill(255,255,colorS);
    ellipse(135, 280, mappedS, mappedS); //second
}

I wanted to keep circles as an integral part of the design, because my own experience of time feels most attuned to cycles— the calendar, circadian rhythms, etc. The movement and color of the inner circles are tied to “human” time (hours, minutes, seconds), while the color of the background circle is tied (very approximately, using noon as the brightest point and midnight as the darkest) to the position of the sun in the sky. The map function came in very handy for this project.

Kai Zhang-Looking Outwards-06

Andrew Huang is a Youtuber/ musician who is known for his “Song Challenge” video series, which invites viewers to dare him in feats of musicianship, as well as for several viral videos feturing his music. The very unique talent of his is how he used unconventional recordings of pretty much everything as instruments to create his music pieces.

In this video of his, he challenged himself using random sounds that are sent from his Twitter followers to create a sound track. He didn’t specify any requirement of the sounds as long as they’re anywhere near useable for editing. And the sounds are recorded very randomly by his followers and used random recording devices. He explained in this video how he used various computational techniques to remix the sounds including pitch-shifting, pitch modulation, eqaulization, layering, etc.

What I appreciate the most is that despite how the sounds he picked are drastically different and totally random. His ability to manage all these sounds into a synchronized drop is very impressive. To his sensibility, there are quite much value from randomness, and things ignored by most people can often be picked up and become part of a great artwork. And it’s not only the sound, but also video editing part that really adds to the flavor of the whole experience.