Austin Treu – Final Project

atreu-final_project

How to run: download and unzip the folder, then open the index.html file in your browser of choice, mine being Firefox.

For my final project, I worked utilizing turtle graphics to create a game and drawing software. I used the turtles like a snake from the game of the same name. Thus, I decided on the name Snakle for my game. The main game is a two player competitive game in which each player is trying to make their snakle the longest by outlasting the other player. Player one is blue and player two is red. The game keeps track of score and displays the winner after each round, so the players can continue playing to a certain score. The drawing feature is based off of a similar concept to that of the game, where you control a single snakle in four directions with a color palette. It works very similarly to an Etch-A-Sketch, but you can click to move the snakle elsewhere.

Start screen:

Help Screen:

Game:

Etch-A-Sketch:


Austin Treu – Final Project Proposal

For my final project, I intend to  make a game utilizing the turtle code as my base for player characters. The game will be based on Snake, with changes that could include things such as maps, power ups, and passive enemies. I intend to include a multiplayer mode in which the players can compete in rounds to last the longest. Running into anyone’s trail will cause the player who does so to lose. Including a set of playable characters with different strengths and weaknesses is also a priority.

I am still considering some other interesting possibilities for the game, like having multiple control schemes (mouse, keyboard, controller if possible), or a continuous run mode in which the game functions with the players constantly moving in one direction having to avoid different obstacles as well as each other. This mode could increase in difficulty as the game progresses, allowing players to compete to beat their own top scores.

Austin Treu – Project 11

atreu-proj-11

/*Austin Treu
  atreu@andrew.cmu.edu
  Section B
  Project 11*/

var turt, mouseTurt, colCount = 0, revTurt, uLine = false,
    colArr = ['purple','orange','blue','yellow','green','red','pink'];

function setup() {
    createCanvas(480, 480);
    background(250);

    //display title
    textSize(48);
    fill("green")
    textAlign(CENTER);
    text("Turtle Draw!", width/2, 50);
    textSize(15);
    text('Click to draw, Press Space to clear,', width/2, 80);
    text('Press Enter to change color', width/2, 95);


    //make turtles
    turt = makeTurtle(width/4, 60);
    turtL = makeTurtle(0,0);
    turtR = makeTurtle(width,height);
    turtT = makeTurtle(width,0);
    turtB = makeTurtle(0,height);
    mouseTurt = makeTurtle(0,0);
    revTurt = makeTurtle(width, height);
}

function draw() {
    //turtle to draw underline/outline
    if(!uLine){
        turt.penDown();
        turt.setColor('blue');
        turt.setWeight(10);
        if(turt.x < 3*width/4)
            turt.forward(2);
        else
            uLine = true;
    }

    //turtle corresponding with mouse pos
    if(mouseIsPressed){
        mouseTurt.penDown();
        revTurt.penDown();
    }
    else{
        mouseTurt.penUp();
        revTurt.penUp();
    }
    mouseTurt.setWeight(5);
    mouseTurt.goto(mouseX, mouseY);
    var ind = colCount%colArr.length;
    mouseTurt.setColor(colArr[ind]);

    revTurt.setWeight(5);
    revTurt.goto(width-mouseX, mouseY);
    var ind = colCount%colArr.length;
    revTurt.setColor(colArr[ind]);

    keyPressed();
}

function keyPressed(){
    //reset the screen 
    if(keyCode === 32){
        background(255);
        //display title
        textSize(48);
        fill("green")
        noStroke();
        textAlign(CENTER);
        text("Turtle Draw!", width/2, 50);
        uLine = false;
        turt.goto(width/4,60)
    }

    //cycle colors
    if(keyCode === 13)
        colCount++;

    keyCode = -1;
}

//TURTLE CODE
function turtleLeft(d) {
    this.angle -= d;
}


function turtleRight(d) {
    this.angle += d;
}


function turtleForward(p) {
    var rad = radians(this.angle);
    var newx = this.x + cos(rad) * p;
    var newy = this.y + sin(rad) * p;
    this.goto(newx, newy);
}


function turtleBack(p) {
    this.forward(-p);
}


function turtlePenDown() {
    this.penIsDown = true;
}


function turtlePenUp() {
    this.penIsDown = false;
}


function turtleGoTo(x, y) {
    if (this.penIsDown) {
      stroke(this.color);
      strokeWeight(this.weight);
      line(this.x, this.y, x, y);
    }
    this.x = x;
    this.y = y;
}


function turtleDistTo(x, y) {
    return sqrt(sq(this.x - x) + sq(this.y - y));
}


function turtleAngleTo(x, y) {
    var absAngle = degrees(atan2(y - this.y, x - this.x));
    var angle = ((absAngle - this.angle) + 360) % 360.0;
    return angle;
}


function turtleTurnToward(x, y, d) {
    var angle = this.angleTo(x, y);
    if (angle < 180) {
        this.angle += d;
    } else {
        this.angle -= d;
    }
}


function setColor(c) {
    this.color = c;
}


function turtleSetWeight(w) {
    this.weight = w;
}


function turtleFace(angle) {
    this.angle = angle;
}


function makeTurtle(tx, ty) {
    var turtle = {x: tx, y: ty,
                  angle: 0.0, 
                  penIsDown: true,
                  color: color(128),
                  weight: 1,
                  left: turtleLeft, right: turtleRight,
                  forward: turtleForward, back: turtleBack,
                  penDown: turtlePenDown, penUp: turtlePenUp,
                  goto: turtleGoTo, angleto: turtleAngleTo,
                  turnToward: turtleTurnToward,
                  distanceTo: turtleDistTo, angleTo: turtleAngleTo,
                  setColor: setColor, setWeight: turtleSetWeight,
                  face: turtleFace};
    return turtle;
}

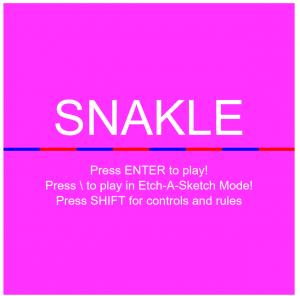
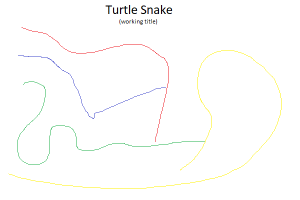
I didn’t quite have an idea for what to do with this project at first, so I just started experimenting with the turtles and the mouse. Ultimately, I thought this was a pretty solid design that was fun to use.

Austin Treu – Project 10

atreu-proj-10

/*Austin Treu
  atreu@andrew.cmu.edu
  Section B
  Project-10*/

var xStart = 0, buzz, buzzY;
var buzzLink = 'https://i.imgur.com/KfTOvVY.png?1';

function preload(){
    buzz = loadImage(buzzLink);
}

function setup() {
    createCanvas(480, 480);
    background(0,0,40);
    buzzY = height/2;
}

function draw() {
    background(0,0,40);
    //make the stars
    for(var x = xStart; x < width+xStart; x+=10){
            var y1 = noise(x)*height;
            var y2 = noise(x+10)*height/4;
            var y3 = noise(x+10)*3*height/4;
            var y4 = noise(x+10)*height*2;
            stroke(255);
            point(x-xStart, y1);
            point(x-xStart, y2);
            point(x-xStart, y3);
            point(x-xStart, y4);
    }

    //buzz rocketing through space
    imageMode(CENTER);
    image(buzz, width/5, (15*noise((width/5+xStart)))+height/2);

    /*create and move planets
    var py = int(random(height));
    var pSize = int(random(10,100));
    var r = int(random(0, 255));
    var g = int(random(0, 255));
    var b = int(random(0, 255));
    var pCol = 'rgb('+r+','+g+','+b+')';
    noStroke();
    fill(pCol);
    ellipse(width+100-xStart,py,pSize,pSize);*/

    //move screen
    xStart+=10;
}

I went into this project with an empty mind, searching for an idea. I opened up a new tab and went to a newsfeed and saw a headline about space. This took me in the direction I ultimately went. The stars were not too difficult to add, I just had to figure out how to utilize noise() to achieve what I wanted. After some trial and error, I decided that I wanted more on the screen, so I set out to find an image of a spaceship. That led me to a picture of an astronaut, which led me to the picture of Buzz Lightyear that I used. I intended to include some planets, but was unable to complete that, so this project is entitled ‘Buzz Flies Through Deep Space’.

Austin Treu – Project 09

atreu-proj-09

/*Austin Treu
    atreu@andrew.cmu.edu
    Section B
    Project-09*/

var underlyingImage, strtX = 0, strtY =0, iter = 0;

function preload() {
    var myImageURL = "https://i.imgur.com/gJg4CSd.jpg";
    underlyingImage = loadImage(myImageURL);
}

function setup() {
    createCanvas(240, 427);
    background(0);
    underlyingImage.loadPixels();
    frameRate(1000);
}

function draw() {
    var px = random(width);
    var py = random(height);
    var ix = constrain(floor(px), 0, width-1);
    var iy = constrain(floor(py), 0, height-1);
    var theColorAtLocationXY = underlyingImage.get(ix, iy);

    noStroke();
    fill(theColorAtLocationXY);
    ellipse(px, py, 6, 6);
}

I found this picture of my little brother in my files, thought it was an interesting snapshot, so I utilized it in this. It is interesting to watch the image be formed and try to figure out what it is before it is complete.

Final Image:

Original Image:

Austin Treu – Looking Outwards 07

This is an example of a visualization of the 2016 electoral map. I find these fascinating for a variety of reasons, not only because it makes clear what the population distribution in the US is, but it also shows which states had the most influence over the result.

http://www-personal.umich.edu/~mejn/election/2016/

This site has a variety of population based maps that represent the spread in different fashions, by county and percentages of the vote and such. In looking at the county maps, especially the one shaped normally, I find it fascinating how this representation shows the widespread red and how compacted the blue is.

If you look at this map adjusted for population density, you can see this clearly because of how much larger the blue areas become.

The implications of one voterbase being so widespread and the other being so condensed are many, but I’m not here to discuss politics other than remarking on these being interesting.

Austin Treu – Project 07

atreu-proj-07

/*Austin Treu
    atreu@andrew.cmu.edu
    Section B
    Project 07*/

var cX = 0, cY = 0, nPoints = 100,
    t = 0, up = 0, bot = 0, a = 0, b = 0;

function setup() {
    createCanvas(480, 480);
    frameRate(10);
}

function draw() {
    //fade the background
    background(255,255,0,20);

    //actual shape
    //shape is based upon the devil's curve
    //http://mathworld.wolfram.com/DevilsCurve.html
    fill('orange');
    push();
    //center the shape
    translate(width/2, height/2);
    //scale down to half size
    scale(0.5);

    //create the shape
    beginShape();
    //utilize mouse values for a and b
    a = mouseX;
    b = mouseY;
    for (var i = 0; i < nPoints; i++) {
        //map t around a full circle
        t = map(i, 0, nPoints, 0, TWO_PI);
        //calculate points
        up = pow(a,2)*pow(sin(t),2)-pow(b,2)*pow(cos(t),2);
        bot = pow(sin(t),2) - pow(cos(t),2);
        cX = cos(t)*(sqrt(up/bot));
        cY = sin(t)*(sqrt(up/bot));
        vertex(cX, cY);
    }
    endShape(CLOSE);
    pop();

    //accidental spiky thing
    stroke('red');
    push();
    //center the shape
    translate(width/2, height/2);
    //increase size
    scale(25);

    //create the shape
    beginShape();
    //utilize mouse values for a and b
    a = mouseX;
    b = mouseY;
    for (var i = 0; i < nPoints; i++) {
        //map t around a full circle
        t = map(i, 0, nPoints, 0, TWO_PI);
        //calculate points
        up = pow(a,2)*pow(sin(t),2)-pow(b,2)*pow(cos(t),2);
        bot = pow(sin(t),2) - pow(cos(t),2);
        //an incorrect parenthesis can change EVERYTHING!!
        cX = cos(t*(sqrt(up/bot)));
        cY = sin(t*(sqrt(up/bot)));
        vertex(cX, cY);
    }
    endShape(CLOSE);
    pop();
}

The devil’s curve is what I based this project on. I struggled through this project at the beginning, dealing with a variety of issues that prevented the program from functioning correctly. This was mainly due to two parentheses that were out of place in my math.

costsqrt((a^2sin^2t-b^2cos^2t)/(sin^2t-cos^2t))

I mistakenly read this as cosine of the quantity of t times the square root as opposed to cosine of t times the quantity of the square root. I did the same for both x and y values. This created the red ‘starburst’ that appears in the middle of the drawing. Once I corrected this, I made a shape correctly based upon the devil’s curve but decided to leave the starburst, as it adds some interesting randomness to the image. Believe it or not, both of the things you see on screen were created with the same equation, only differing by two parentheses and scale.

Austin Treu – Looking Outwards 06

jonathanmccabe.com

Jonathan McCabe’s work is very interesting as he utilizes Alan Turing’s research to create pieces of art from very minuscule levels such as pixels. In these projects, he starts with very small random variations in certain variables of the pixels. Once the project is generated it is filled with a wide variety of different features. His work helps to show that such randomness inherently imitates nature on every scale, particularly on a cellular level. The random projects tend to create shapes and colors that combine to form something reminiscent of nature. This is something that makes the uniqueness of nature seem even more fascinating, as it is all just as random as it may seem from the smallest level up, just like these projects.

Austin Treu – Project 06

atreu-proj-06

/*Austin Treu
	atreu@andrew.cmu.edu
	Section B
	Project-06*/

var hSize = 80, mSize = 40, sSize = 20
    hourX = 0, hourY = 150, 
    minX = 0, minY = 250,
    secX = 0, secY = 350, 
    wProp = 0, hProp = 0, 
    wPropH = 0, hPropH = 0;

//--------------------------
function setup() {
    createCanvas(480, 480);
    wProp = width/60;
    hProp = height/60;
    wPropH = width/12;
    hPropH = height/24;
}

//--------------------------
function draw() {

    /*TEST CODE - grid for measurement
    line(30*wProp, 0, 30*wProp, height);
    line(0, 30*hProp, width, 30*hProp);
    line(15*wProp, 0, 15*wProp, height);
    line(0, 15*hProp, width, 15*hProp);
    line(45*wProp, 0, 45*wProp, height);
    line(0, 45*hProp, width, 45*hProp);*/
    
    // Fetch the current time
    var H = hour();
    var M = minute();
    var S = second();
 

    //draw background, base upon time
    background((S+1)*2.125,int(255-(S+1)*2.125),255-S, (H+S)/4);

    //set current ellipse locs
    hourX = H*hPropH;
    hourY = ((pow(((hourX-width/2)),2)/16)+7*height)/16;
    minX = M*hProp;
    minY = (abs(pow((minX-height/2)/6,2)-height))/4;
    secX = S*hProp;
    secY = -(abs(pow((secX-height/2)/6,2)-height)-4*height)/4;

    //add trail lines every few seconds (pulsating effect)
    if(S%3 === 0){
		stroke(3*S,200-S, 200-S, 10);
	    strokeWeight(5);
	    for(var i = 0; i<width; i++){
	    	//H
	    	var y = -(abs(pow((i-height/2)/6,2)-height)-4*height)/4;
	    	point(i,y);
	    	//M
	    	y = (abs(pow((i-height/2)/6,2)-height))/4;
	    	point(i,y);
	    	//S
	    	y = ((pow(((i-width/2)),2)/16)+7*height)/16;
	    	point(i,y);
	    }
	    noStroke();
	}

    //draw ellipses for time
    fill('yellow');
    ellipse(hourX, hourY, hSize, hSize);
    fill(0,100,255);
    ellipse(minX, minY, mSize, mSize);
    fill(230);
    ellipse(secX, secY, sSize, sSize);
}

This clock assignment took a few different forms in my head, as I wanted to have a vague space/sky theme and also be as minimalist as possible while still getting the point across. I initially thought about utilizing orbital circles, but I ultimately decided that it would be more interesting to mess around with some other types of functions, with the ‘sun’ (hours) having a simple parabola to portray sunrise and sunset. The ‘planet’ (minutes) and ‘moon’ (seconds) actually mirror each other in their patterns, bouncing off of the bottom of the screen at 1/4 and 3/4 of the way through. This keeps things simple whilst allowing an onlooker to easily see quarter minutes and hours as well as days.

Austin Treu – Looking Outwards 05

In this post, I would like to highlight 3D graphics in general, referencing a few projects throughout. If you were to graph the speed of technological progress in the last century, I’m sure it would look like some sort of exponential function. Disney Pixar’s Toy Story was the world’s first animated movie featuring 3D graphics.  While it was technologically impressive for its time, the animation from that movie looks incredibly primitive today to anyone’s eyes. Compare that to something like Avengers: Infinity War. While it uses human actors with motion capture, nearly everything in that movie is animated using computer-generated graphics. The resolution, textures and shading are so good that they can make these extraordinary scenes and events seem as real as the movie’s actors. And this is just in a period of 23 years! I cannot imagine how far we’ll go in the next 23! Currently we can animate things to look real enough to trick our eyes into thinking something presented to us in a VR headset is real, but this is just the advent of VR. Progressing with these sorts of graphics capabilities presents a fascinating picture for the future. We could have movies that take place around us that are so realistic that it’s impossible to tell them from reality. Maybe they could even be able to generate graphics around the viewers and involve them in the action. Whatever happens, the result of the future of 3D graphics will be fascinating.