Universo de Emociones // PalauGea

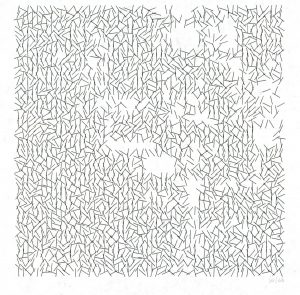
The Universe of Emotions project by PalauGea is a data visualization project based on the concept of emotions as a cosmic network of elements. By visualizing these emotions, PalauGea hopes to help people understand their moods. This graphic map teaches emotional intelligence.

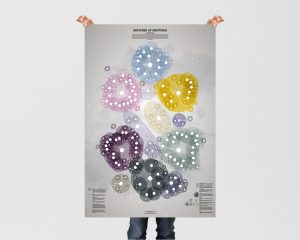
Graphic Map, Universo de Emociones, PaluaGea

There are a total of 307 emotions represented, as well as documented in their text, Dictionary of Affective Emotions and Phenomena. The emotions are then structured into four levels based on their degree of importance, starting largely with 6 main emotional basins.

The universe is the entirety of space, time and any form of substance and energy. – Eduard Punset

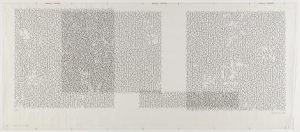
Not only is the project aesthetically beautiful, but it is rich in information. There are multiple layers at which the data begins to interact which in turn creates the possibility of more inferences or perspectives.

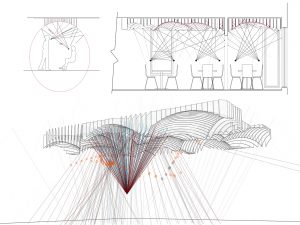
As these emotions begin to develop relationships between each other, they are grouped into trios, creating different triangulations. These relationships show their interrelated properties.

Detail: Graphic Map zoom, Universo de Emociones, PaluaGea

By using algorithms based on cosmic properties such as the idea of the circle and the halo, which are key qualities of our galaxy, the Milky Way. These networks, inspired by a system we are already familiar with, helps to create a salient visualization.

Read more about the project here!

cmhoward-project-07

sketch-131

function setup() {
  createCanvas(400, 400);
}

function draw() {
  background(0);
  fill(186, 85, 211, 100);
  strokeWeight(.25);
  stroke('black');
  drawHypocycloid();
}

function drawHypocycloid() {
  var x;
  var y;
  var theta;
  var nPoints = map(mouseY, 0, height, 50, 100);
    
  beginShape();

  for (var i = 0; i < nPoints; i++) {
    
    push();

    var a = map(mouseX, 0, width, 0, 50);
    var n = map(mouseY, 0, height, 0, 200);
    var d = map(mouseX, 0, width, 10, 20);

    theta = i;

    x = ((a / n) * (n - 1)*cos(theta)) - (d*(cos((n-1)*theta)));
    y = ((a / n) * (n - 1)*sin(theta)) + (d*(sin((n-1)*theta)));

    vertex(x + width/2, y + height/2);
    pop();
  }

  endShape(CLOSE);

  beginShape();

  for (var i = 0; i < nPoints; i++) {

    push();

    var a = map(mouseX, 0, width, 100, 0);
    var n = map(mouseY, 0, height, 400, 0);
    var d = map(mouseX, 0, width, 10, 20);

    theta = i;

    x = ((a / n) * (n - 1)*cos(theta)) - (d*(cos((n-1)*theta)));
    y = ((a / n) * (n - 1)*sin(theta)) + (d*(sin((n-1)*theta)));
    vertex(x + width/2, y + height/2);

    pop();
  }
  endShape(CLOSE);

  beginShape();

  for (var i = 0; i < nPoints; i++) {
    
    push();

    var a = map(mouseX, 0, width, 0, 100);
    var n = map(mouseY, 0, height, 0, 400);
    var d = map(mouseX, 0, width, 10, 20);

    theta = i;

    x = ((a / n) * (n - 1)*cos(theta)) - (d*(cos((n-1)*theta)));
    y = ((a / n) * (n - 1)*sin(theta)) + (d*(sin((n-1)*theta)));

    vertex(x + width/2, y + height/2);
    pop();
  }

  endShape(CLOSE);
}

For this project, I focused on the hypocycloid curve. 

http://mathworld.wolfram.com/Hypocycloid.html

The hypocycloid is based on the idea of a circle, of smaller radius, rolling along the inside of a larger circle, with a point drawing it’s curve throughout the rotation. For my project I first began exploring variations based on the number of points and how adding different variables to the equation could influence it’s shape.

I then began playing around graphically, adding in 3 layers of these hypocycloid curves, and filling in the curves, to almost recreate a flower in bloom. It’s quite interesting to me how these circles are proportional to one another but act quite differently at certain points in the canvas.

I added in the d variable, which creates even more variation, based on the Astroid curve, http://mathworld.wolfram.com/Astroid.htmlwhich is a type of hypocycloid.

Vera Molnar’s Generative Art

Vera Molnar is widely known as a pioneering woman of computer generated graphics, but her works actually exist between the computer and the hand drawn. She primarily designs algorithms and computes these drawings based on a grid that corresponds to a computed set of variables. In the drawing below, Molnar has already defined the possibilities for each output, but uses an algorithm to offset the repetition and order of these outputs.

Structure de Quadrilateres (Square Structures), 1987, computer drawing with white ink on salmon-colored paper

Interruptions, 1968/1969, Ink plotter on paper

When Molnar worked with computers, there was a different richness to the drawing. Between this shift, from “machine imaginaire” to a “machine réelle,” (https://www.surfacemag.com/articles/vera-molnar-in-thinking-machines-at-moma/) Molnar was able to add more variation to her projects without the limitation of herself as the processor. Molnar’s randomness lies in the output of a logical algorithm. While the series of outputs is usually defined, the order, repetition, pattern of those outputs is randomly sorted based on the algorithm.

Interruptions à recouvrements (Disturbances through overlappings), 1969, Ink plotter on paper

After the drawing, Interruptions, was completed, Molnar then began Interruptions a recouvrements, which used the original drawing to compute the algorithm for the larger layering of drawings which includes variation in the scale, shape, and line thickness.

Molnar believes one power of the computer is that the random can create an aesthetic shock that ruptures the systematic and symmetrical. The rigor and meticulousness which she applies to her logics, is the human bias that computation and randomness cannot create alone. The work is so powerful because the “randomness” exists within Molnar’s bias.

See more projects from Vera Molnar: http://www.veramolnar.com/


cmhoward-project-06

cmhoward-06

function setup() {
	createCanvas(480, 100);
}

function draw() {
	var H = hour();
	var M = minute();
	var S = second();
	var colorFill = 0;

	background('black');

	for (var i = 0; i < H + 1; i++) {
		colorFill = (3000/i);
		stroke(colorFill, 0, 0);
		line(width - i * 10 + 9, 0, width - i * 10 + 9, height/3);
	}
	for (var i = 0; i < 24 - H; i++) {
		colorFill = (3000/i);
		stroke(colorFill, 0, 0);
		line(i * 10, 0, i * 10, height/3);
	}

	for (var i = 0; i < M + 1; i++) {
		colorFill = (3000/i);
		stroke(colorFill, 0, 0);
		line(width - i * 5 + 4, height/3, width - i * 5 + 4, height/3*2);
	}

	for (var i = 0; i < 60 - M; i++) {
		colorFill = (3000/i);
		stroke(colorFill, 0, 0);
		line(i *5, height/3, i * 5, height/3*2);
	}

	for (var i = 0; i < S + 1; i++) {
		colorFill = (3000/i);
		stroke(colorFill, 0, 0);
		line(width - i * 2.5 + 1.5, height/3*2, width - i * 2.5 + 1.5, height);
	}

	for (var i = 0; i < 60 - S; i++) {
		colorFill = (3000/i);
		stroke(colorFill, 0, 0);
		line(i * 2.5, height/3*2, i * 2.5, height);
	}
}

For this project, I was inspired by a simple abacus.

The abacus has historically been used as a mathematical and computational device, but I immediately was inspired by this as a clock, with each row representing a different time keeping variable (hour, minute, seconds) and each vertical line counting those variables. The script basically reflects the current time on the right and whatever is left over on the left, as if someone is moving a line over for each second, minute, etc.

I began by creating ellipses first, but then decided to create lines to create a deeper graphic relationship between the the hour, minutes, and seconds, as you can see that while the spacing is different between the lines for each variable, there are times when all of the lines vertically connect and it adds another element to this abstraction.

Hunky-Dunky Creative Studio

Hunky Dunky is a creative design studio based in Spain, that specializes in 3D art and animation.

Animation from Summer Diary collection

I am completely mesmerized by this studio’s animation and design style. This design studio uses a combination of rendering and illustration techniques. Rendering is the process of adding shading, texture, and color to a drawing that creates a realistic form. Using rendering software, which is a hardware based process, 2D images become 3D.

Rendering from Summer Diary Collection

The artists, 3D Artist Yonito Tanu and Art Director Jessica Chapiness, refer to their medium as CGI. CGI is computer generated imagery which refers to a non-static image, such as the dynamic animation we see in CGI rendered movies. This dynamic form of CGI relies on algorithms that triangulate surfaces, often based on fractal algorithms that recursively zoom in further to smaller triangles.

In in interview with ballpitmag, the artists stated that they intend on “creating surreal worlds we wish to live in.” With their use of color, form, and hyper-realism- the artists have definitely drawn viewers into their surreal world.

See more of their work here: http://www.hunky-dunky.com/


cmhoward-project-05

sketch-396

function setup() {
	createCanvas(400, 400);
	noLoop();
	noStroke();
	background('black');
}

function draw() {
	drawGrid();
}

function drawGrid() {
//set circle Size  
	var circleSize = 10;
//increasing or decreasing variable
	var dir = 1;
//x position	
	for (var x = 10; x < width; x += 20) {
//alternates columns, sets circleSize initial value to be different 
		dir = -dir;
		if (dir == 1) {
			circleSize = 5;
		}
		else {
			circleSize = 15;
		}
//counter switches from increasing circleSize to decreasing circleSize 
		var counter = 0;
		var red = 150;
//y position
    	for (var y = 10; y < height; y += 20) {
//gradient color based on increasing or decreasing dir 
    		red += dir * 10;
    		fill(red, 0, 0);
//draw circles
            ellipse(x, y, circleSize, circleSize);
//increase or decrease after every 5 circles 
            counter += 1;
            if (counter % 5 == 0) {
            	dir = -dir; 
            }
            circleSize += dir * 3;
        }
    }
}

For this project I was inspired by decorative beads, as wallpaper and door beads both have similar space dividing properties, as well as specific aesthetic qualities.

I wanted to create a pattern that was both repetitive and rhythmic, so I created alternating columns of gradually increasing and decreasing ellipses. There begins to be a hierarchy of size and color that draws your eye around the canvas, similar to how door beads change your perspective of a space.

Sonic Playground

Yuri Suzuki is a sound artist and designer who has created this public art installation comprised of giant playground “talk tubes” in Atlanta, Georgia.

Sculptural playground talk tubes

Immediately, my interest was peaked because of the architectural implications of these forms. Not only have they taken on a truly human scale, but they have transformed this plaza by generating a field of interactive and communicative pieces.

As I began to read about this project, I became even more excited as these forms were driven by software that analyzed how best sound waves traveled through these horns and pipes. The software they used is a 3D modeling software, Rhinoceros, and a parametric software plugin, Grasshopper:

Screenshot of Grasshopper Script, a Rhinoceros software plug-in

In collaboration with the Yuri Suzuki Design Studio, Luca Dellatorre created a plugin for this Grasshopper script that allows a sound source to be captured and sent in a specific direction which helped to optimize the geometries for the pipers, horn, and acoustic mirrors which allow the sound to reflect in different directions. In this way, the horns can capture as much sound as possible and then reflect and spread the noise level as much as possible to the receiver. While Grasshopper is not an acoustic software, due to the wave behavior of sound, it can be simulated and analyzed in similar ways to other physical elements.

For more information on the Yuri Suzuki Design Studio go to: http://yurisuzuki.com/design-studio

cmhoward-project-04

///move your mouse!///

cmhoward-04

function setup() {
	createCanvas(400, 300);
	}

function draw() {
	background('black');
	
	//bottom left half almond
	strokeWeight(2);
	stroke('violet');
	x1 = 0;
	x2 = 0;
	y1 = 300;
	y2 = 0;
	for (var i = 0; i < 20; i += 1) {
		//restrain to stop mouse at center of almond shapes
		x1 += min(mouseX, 80);
		y2 += 15;
		line(x1, y1, x2, y2);
	}
	//bottom left light green color
	strokeWeight(1);
	stroke('lightgreen');
	x1 = 0;
	x2 = 0;
	y1 = 300;
	y2 = 0;
	for (var i = 0; i < 80; i += 1) {
		x1 += min(mouseX, 80);
		y2 += 5;
		line(x1, y1, x2, y2);
	}
	//pattern repeats around canvas
	//topleft
	strokeWeight(2);
	stroke('violet');
	x3 = 0;
	x4 = 0;
	y3 = 300;
	y4 = 0;
	for (var i = 0; i < 20; i += 1) {
		x4 += min(mouseX, 80);
		y3 -= 15;
		line(x3, y3, x4, y4);
	}
	strokeWeight(1);
	stroke('lightgreen');
	x3 = 0;
	x4 = 0;
	y3 = 300;
	y4 = 0;
	for (var i = 0; i < 80; i += 1) {
		x4 += min(mouseX, 80);
		y3 -= 5;
		line(x3, y3, x4, y4);
	}
	//bottomright
	strokeWeight(2);
	stroke('violet');
	x5 = 400;
	x6 = 400;
	y5 = 0;
	y6 = 300;
	for (var i = 0; i < 20; i += 1) {
		//x5 -= 15;
		x6 -= min(mouseX, 80);
		y5 += 15;
		line(x5, y5, x6, y6);
	}
	strokeWeight(1);
	stroke('lightgreen');
	x5 = 400;
	x6 = 400;
	y5 = 0;
	y6 = 300;
	for (var i = 0; i < 80; i += 1) {
		//x5 -= 15;
		x6 -= min(mouseX, 80);
		y5 += 5;
		line(x5, y5, x6, y6);
	}
	//top right
	strokeWeight(2);
	stroke('violet');
	x7 = 0;
	x8 = 400;
	y7 = 0;
	y8 = 0;
	for (var i = 0; i < 20; i += 1) {
		y8 += min(mouseX, 80);
		x7 += 15;
		line(x7, y7, x8, y8);
	}
	strokeWeight(1);
	stroke('lightgreen');
	x7 = 0;
	x8 = 400;
	y7 = 0;
	y8 = 0;
	for (var i = 0; i < 80; i += 1) {
		y8 += min(mouseX, 80);
		x7 += 5;
		line(x7, y7, x8, y8);
	}
}

i really enjoyed this project! it was quite a challenge beginning to understand for loops, but playing with these geometries reminds me of things i’ve done with parametric modeling software in my architecture classes. it’s interesting to see how specific concepts transfer between technologies.

i especially enjoyed animating the string art, as there are moments that are seemingly symmetrical and it creates a really beautiful reaction between the geometries.

Senyai: Lighting and Acoustics

EPIPHYTE Lab, led by Dana Cupkova and Gretchen Craig, recently completed this architectural installation from new Shadyside Thai restaurant, Senyai (2017.)

Final installation in Senyai

This project, inspired by a body of water, utilizes 275 unique slats, to control acoustic levels and lighting in this small restaurant. Utilizing Architectural design software, Rhinoceros and Grasshopper, EPIPHYTE Lab was able to produce a script that creates the specific geometries for each panel based on where the highest noise levels were located and where those sound levels were dissipating.

Drawing of sound vectors affect on geometry

After creating the geometries, the software then produces the form of each panel and that panel can thus be digitally fabricated using a laser cutter, or most likely a CNC Router.

Each panel being completely unique is what led to the success of the installation. Each vault rises and falls, almost perfectly, so that the eye moves slowly over the geometry and follows the wave-like sensitivity of the form. The production of completely unique panels is greatly eased by the computational and digital software utilized. It would not be the same project with human constraints.

What led my love for this project is the intimacy of the product. This is truly a space making installation that is both functional and beautiful.

Read more about this project here: http://www.epiphyte-lab.com/senyai

cmhoward-project-03

/// seizure warning ///

project-03

var dir = 1;
var colorPicker = 1;
var sizeX = 25;
var sizeY = 25;
var width = 640;
var height = 480;
var x = width/2;
var y = height/2;
var x2 = width/2;
var y2 = height/2;

function setup() {
    createCanvas(640, 480);
}

function draw() {
	//background
	switch(colorPicker) {
        case 1:
            background(252, 156, 231);
            break;
        case 2:
            background(230, 156, 252);
            break;
        case 3:
            background(156, 193, 252);
            break;
        case 4:
            background(252, 249, 156);
            break;
        default:
            background(161, 252, 156);
    }
    //rectangles
    noStroke();
    fill('white');
    rectMode(CENTER);
    translate(mouseX, mouseY);
    rotate(radians(mouseY));
    //#1
    rect(x, y, sizeX, sizeY);
    //#2
    rect(x2, y2, sizeX, sizeY);
    //#3
    rect(x, y2, sizeX, sizeY);
    //#4
    rect(x2, y, sizeX, sizeY);
}

function mouseMoved() {
	//burst from center movement
	x = mouseX/2;
	x2 = -mouseX/2;
	y = height/width*(mouseX/2);
	y2 = -height/width*(mouseX/2);
	//sizechange
	sizeX = mouseX/6;
	sizeY = mouseX/6;
	//background
	colorPicker = int(random(1, 6));
}

at the beginning of this project, i really wasn’t sure what i wanted to accomplish with my drawing mechanism, but that allowed me to explore the new topics of translation and rotation even more than i probably would have. i really enjoyed the final result of this project because i already have 10 ideas of how this could be changed in the future! it’s fun to make art + learn at the same time.