![[OLD FALL 2018] 15-104 • Introduction to Computing for Creative Practice](../../../../wp-content/uploads/2020/08/stop-banner.png)
// Epitrochoid:
// http://mathworld.wolfram.com/Epitrochoid.html
function setup() {
createCanvas(300, 300);
}
function draw() {
background(0);
push();
translate(width / 2, height / 2);
drawEpitrochoid1();
drawEpitrochoid2();
pop();
}
function drawEpitrochoid1() {
var x;
var y;
// constrain mouseX to canvas width
var mX = constrain(mouseX, 0, width);
var a = mX / 5; // size of centre circle
var b = mX / 100; // size of revolving pattern
var h = b + 20; // height of revolving pattern
// epitrochoid
stroke(246, 76, 114);
fill(47, 47, 162);
beginShape();
for (var t = 0; t < 360; t++) {
x = (a + b) * cos(radians(t)) -
h * cos(radians(((a + b) / b) * t));
y = (a + b) * sin(radians(t)) -
h * sin(radians(((a + b) / b) * t));
vertex(x, y);
t += 7;
}
endShape(CLOSE);
}
function drawEpitrochoid2() {
var x;
var y;
var mX = constrain(mouseX, 0, 300);
var a = mX / 10;
var b = mX / 100;
var h = b + 20;
stroke(246, 76, 114);
fill(47, 47, 162);
beginShape();
for (var t = 0; t < 360; t++) {
x = (a + b) * cos(radians(t)) -
h * cos(radians(((a + b) / b) * t));
y = (a + b) * sin(radians(t)) -
h * sin(radians(((a + b) / b) * t));
vertex(x, y);
t += 1;
}
endShape(CLOSE);
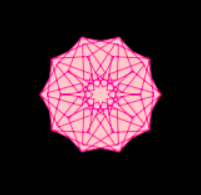
}From initially studying the sample code, I noticed that multiple elements (a, b, h, ph) were being related to the mouse or each other. When I began surfing the MathWorld curves site, I searched for curves with equations that used at least three variables. I chose the epitrochoid because I liked its symmetry and the wide range of complexity to be explored in its form.
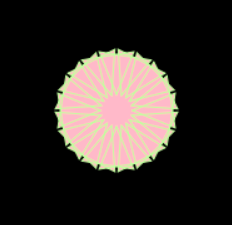
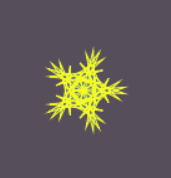
In constructing the code, I had a lot of fun playing with different value and observing the effect. I mixed relations and added slight changes to the variable values until I was happy with the outcome. I also added a second epitrochoid for an even more complex shape.
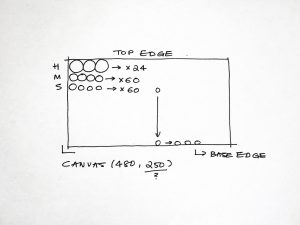
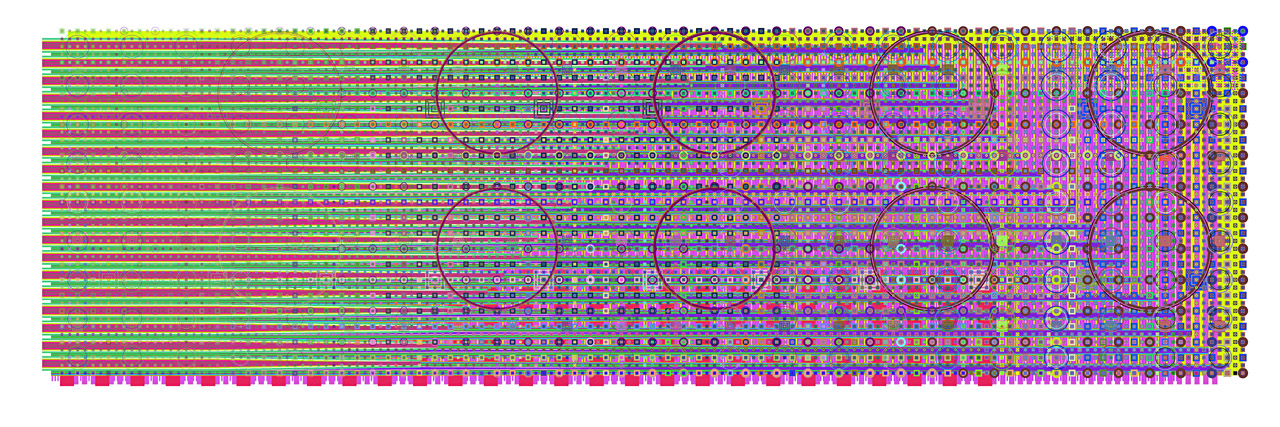
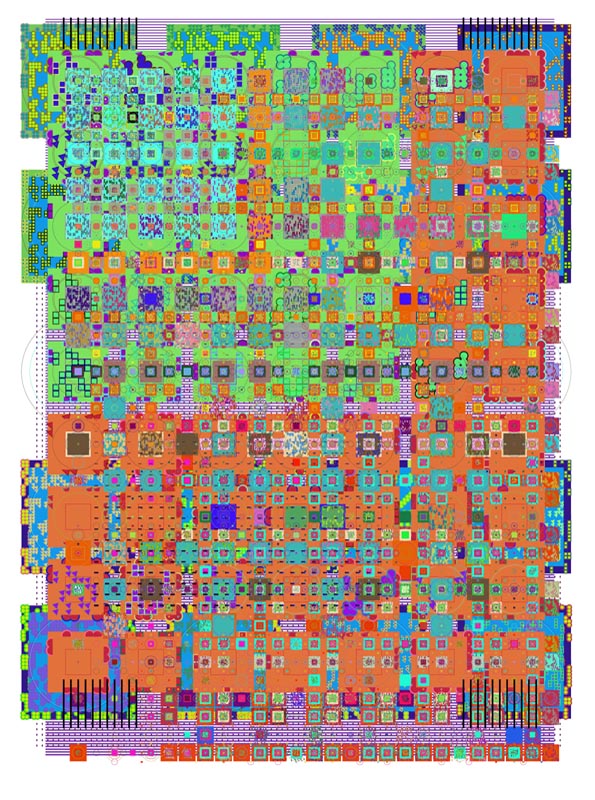
Early iterations: