Sophie Chen – Project 07 – Curves

sketch

var x;
var y;

function setup() {
    createCanvas(480, 480);
    frameRate(25);
}

function draw() {
	background(0, 0, 0, 57);
	noFill();
	drawDeltoid();
	drawDeltoid2();
	drawDeltoid3();
}

// Outermost circle
function drawDeltoid(){

    var nPoints = 50;
	var radius = 50;
	var separation = 60;
	strokeWeight(1);
	stroke(150, 205, 255);
    push();
    translate(4 * separation, height / 2);
    beginShape();
    for (var i = 0; i < nPoints; i++) {
        var range = map(mouseX, 0, width, 0, 200)
        var px = range * cos(i) + cos(2 * i);
        var py = range * sin(i) - sin(2 * i);
        vertex(px + random(-mouseX / 30, mouseX / 80), py + random(-mouseX / 30, mouseX / 80));
    }
    endShape(CLOSE);
    pop();
}

// Middle circle
function drawDeltoid2(){

    var nPoints = 50;
    var radius = 50;
    var separation = 60;
    push();
    translate(4 * separation, height / 2);
    beginShape();
    for (var i = 0; i < nPoints; i++) {
        var px = mouseX / 4 * cos(i + mouseY / 50) + cos(2 * i);
        var py = mouseX / 4 * sin(i) - sin(2 * i);
        vertex(px + random(-5, 5), py + random(-5, 5));
    }
    endShape(CLOSE);
    pop();
}

// Inner circle

function drawDeltoid3(){

	var nPoints = 50;
    var radius = 50;
    var separation = 60;
    
    push();
    translate(4 * separation, height / 2);
    beginShape();
    for (var i = 0; i < nPoints; i++) {
        var px = mouseX / 4 * cos(i + mouseY / 50) + cos(2 * i);
        var py = mouseX / 4 * cos(i) - sin(2 * i);
        vertex(py + random(-5, 5), px + random(-5, 5));
    }
    endShape(CLOSE);
    pop();

}

At first I was a bit overwhelmed by all the mathematical equations for different curves, but once I settled on one and started playing around with it everything made a lot more sense. I really enjoyed the process of this project and changing every value in the equations to see and understand what they did.

Sophie Chen – Looking Outwards – 07

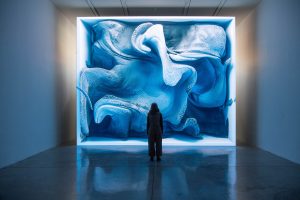
Melting Memories by Refik Anadol Studio

Melting Memories on display

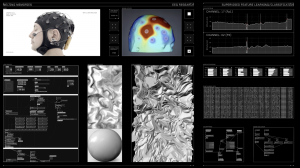
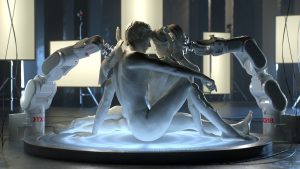
Melting Memories is a series of multi-dimensional digital artworks that explore the materiality of remembering through different ways of representing EEG data collected on the neural mechanisms of cognitive control. What viewers experience are aesthetic interpretations of motor movements inside a human brain. I was immediately drawn to the level of abstraction of the human mind that this project was able to visually achieve. The Neuroscape Laboratory at the University of California, San Francisco gathers data and changes in brain wave activity which are the building blocks for the algorithms that the artists need. The team was able to use a composite design pattern to quickly iterate the project, and this way of working allowed them to explore many different complex functions while maintaining a modular graphics pipeline. I really admire the level of integration between data and visuals that this project was able to achieve.

Data capture & abstraction process

Sophie Chen – Project 06 – Abstract Clock

sketch

var yoff = 0.0 ; 


function setup() {
    createCanvas(600, 600);
    
}

function draw() {
	background(255, 250, 200);
    // Current time
    var H = hour();
    var M = minute();
    var S = second();

    // Map time to dimensions
    var mappedH = map(H, 0, 23, 0, height); // sun is at the bottom of the canvas at midnight, and moves up as each hour passes and is at the top of the canvas by noon.
    var mappedM = map(M, 0, 59, height - 245, 0 - 265); // minutes wave starts at the bottom of the canvas and ends at the top
    var mappedS = map(S, 0, 59, height - 265, 0 - 360); // seconds wave starts at the bottom of the canvas and ends at the top 
    
    // Sun
    fill(255, 215, 0);
    noStroke();
    ellipse(width / 2, mappedH, 200, 200);
    
    // Minutes
    fill(50, 170, 250, 90);
    beginShape(); 
    var xoff = 0;

    for (var x = 0; x <= width; x += 10) {
    // Noise
    var y = map(noise(xoff, yoff), 0, 1, 200, 300) + mappedM; // the level of the wave increases horizontally each minute
    // Set vertex
    vertex(x, y); 
    // Increase x dimension for noise
    xoff += 0.04;
  }
    // Increase y dimension for noise
    yoff += 0.005;
    vertex(width, height);
    vertex(0, height);
    endShape(CLOSE);
    
    // Seconds
    fill(50, 190, 150, 90);
    beginShape(); 
    var xoff = 0;     
    
    for (var x = 0; x <= width; x += 10) {
    
    // Noise
    var y = map(noise(xoff, yoff), 0, 1, 200, 400) + mappedS; // the level of the wave increases horizontally each second
    // Set vertex
    vertex(x, y); 
    // Increase x dimension for noise

    xoff += 0.04;

  }
    // Increase y dimension for noise
    yoff += 0.005;
    vertex(width, height);
    vertex(0, height);
    endShape(CLOSE);
}

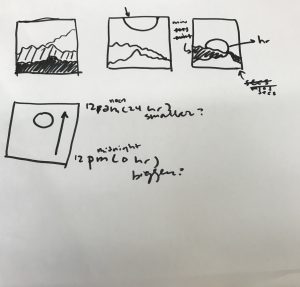
For this project I wanted to create something more environmental and fluid in contrast to the constant and rigid nature of time passing. My concept was to have the sun move up or down according to the hour and two different layers of landscape/waves, one indicating seconds and one indicating minutes. I thought perlin noise would be perfect for this, and although it took me a while to understand how to manipulate the variables, I think it came together nicely in the end.

sketch

Sophie Chen – Looking Outwards – 06

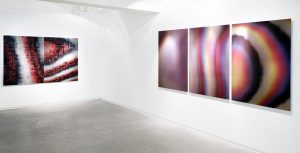
Post-Digital Mirror by Pascal Dombis

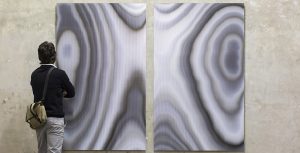
Post-Digital Mirror (B4, B5 & B6), 2010 / Exhibition view, Eurasia, The Cat Street Gallery, Hong Kong, 2012

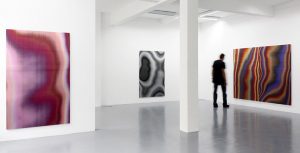
Exhibited all over the world, these images are created by French artist Pascal Dombis through manipulating computer generated hyper-structures which he synthesizes into abstract digital paintings.  Dombis uses computer algorithms to create excessive repetitions of simple processes that create unpredictable and dynamic visual results. More specifically, Dombis uses an elementary warped prototype as his computational starting point, computing the curved geometric element that ends up forming these intricate configurations that would be impractical to generate manually. I really appreciate the digital yet organic quality to these pieces, and there’s something about having these intricate digital and generated content printed out physically and placed in a gallery that I find very refreshing and appealing. The random and digital nature combined with the tangibility and scale of the physical prints makes these pieces very intentional and I would love to see them in person someday.

Post-Digital Mirror (A6 & A7), 2014 / Exhibition view, Monochrome, The Société, Brussels,BE / Lenticular print on aluminum composite, 2 panels, 1.10 × 1.80 m (each) / Photo : Freddy D’hoe
Post-Digital, TZR Galerie Kai Brückner, Düsseldorf, 2013 / Exhibition view

Sophie Chen – Project 05 – Wallpaper

sketch

var r; // red 
var b; // blue
var x;
var y;

function setup() {
    createCanvas(480, 480);
    background(250, 130, 150);
}

function draw() {
	for (y = 0; y < height; y += 80) {
		for (x = 0; x < width; x += 80){
			r = x;
			b = y / 2;
			
			// circles
			noStroke();
			fill(r, 150, 150);
			ellipse(50 + x, 50 + y, 50, 50);
			fill(255, 100, 100, 90);
			ellipse(40 + x, 35 + y, 50, 50);

			// banana body
			fill(200, 230, b);
			noStroke();
			beginShape();
			vertex(30 + x, 20 + y);
			bezierVertex(75 + x, 15 + y, 70 + x, 75 + y, 25 + x, 70 + y);
			bezierVertex(50 + x, 60 + y, 45 + x, 20 + y, 30 + x, 22 + y);
			endShape();

			// banana stem
			stroke(200, 230, b);
			strokeWeight(5.5);
			line(25 + x, 26 + y, 39 + x, 14 + y);

			// curve pattern
			noFill();
			stroke(255, 200, 200, 30);
			strokeWeight(2.5);
			arc(15 + x, 10 + y, 25, 25, HALF_PI, PI);
		}	
	}
}


I’m really glad I got to successfully use the bezier vertex to create a shape that’s not an ellipse this week (a banana 🙂 ).  I also enjoyed incorporating subtle color gradients into the wallpaper and combining that with different opacities. I had fun making this and definitely have a better understanding of nested for loops now.

Sophie Chen – Looking Outwards – 05

TedX Sydney 2018 – Rich Nosworthy

Still from the final video (TEDx Sydney Love Is Love)

Rich Nosworthy is a 3D motion designer located in Auckland, New Zealand. TedX Sydney 2018, directed by Scott Geerson, explores the theme of humankind and takes the audience through museum galleries where the past, present and future collides. At first glance, I had no idea that the entire video was created through 3D motion graphics with Cinema4D. Seeing sculptures that are traditionally still and in museums be animated and put in an entirely new setting successfully conveyed the theme of evaluating our current place within humanity’s short timeline. I think Nosworthy not only did a beautiful job with the motion graphics, but also used it in a meaningful way in that he created something that combined computer graphics with something that we associate with history and the past, mixing classical art with modern subjects.

Process of one of the clips created for TEDx Sydney 2018.


Sophie Chen – Project 04 – String Art

sketch

var x1 = 1;
var x2 = 1;
var y1 = 1;
var y2 = 1;

function setup() {
    createCanvas(400, 300);
    background(0);

}

function draw() {
	// bottom section
	for (var i1 = 5; i1 < 200; i1 += 10){ // start i1 at 5
		strokeWeight(1);
    	stroke(255, 0, 255); // purple
    	x1 = 0.2 - i1;
    	y1 = width - i1 - 50;
    	x2 = width;
    	y2 += 25 - i1 / 15; // end point of line should grow towards end
		line(x1, y1, x2, y2);
	}
	// top section
	for (var i2 = 0; i2 < 300; i2 += 1){ // start i2 at 0
		strokeWeight(1)
		stroke(255, 0, 100); // pink
		x1 = 0;
		y1 = width - i2 * 10;
		x2 = i2 + height;
		y2 = i2 / 50;
		line(x1, y1, x2, y2);
	}
	// right section
	for (var i3 = 20; i3 < 300; i3 += 10){ // start i3 at 20
		strokeWeight(0.5)
		stroke(255, 150, 100); // orange
		x1 = 0 - i3 * 10;
		y1 = height - i3 * 30;
		x2 = i3 * 0.5 + 300;
		y2 = i3 + height / 2;
		line(x1, y1, x2, y2);
	}
	// left section
	for (var i4 = 0; i4 < 300; i4 += 5){ // start i4 at 0
		strokeWeight(1);
    	stroke(100, 100, 255); // blue
    	x1 = 0; // start at 0
    	y1 = height - i4; 
    	x2 += width - i4; // lines concentration increase at the end
    	y2 += i4 * 2;
		line(x1, y1, x2, y2);
	}
}

For this project, my goal was to create something more environmental and resembles landscapes/light through lines. I started by creating the bottom one first, and modified the rest based on the bottom one.  I was trying to create a sense of depth through these two-dimensional strings, and although it took me a while to understand what I was doing, it was definitely a learning process.

Sophie Chen – Looking Outwards – 04

Ryoji Ikeda – Data.path

video documentation of data.path installation in Madrid.

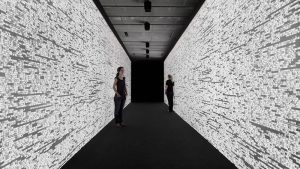
As a video & media design major, I’ve always been interested in the relationship between audio and visuals, as the relationship between the two is integral to each other’s existence and they inevitably affect how the other is perceived. Ryoji Ikeda is a Japanese artist whose creations’ embodies what audio and visual working together are like. Data.path is one of his pieces that combines video projections and the architectural environment through which the viewers move. His moving images are created using data such as computer codes, molecular structures, astronomical coordinates, etc that are synchronized with the audio, and projected on walls 20 meters long. I find his synchronization of audio and visual, digital generation of the visual content, and use of scale to immerse the audience into this synchronization to be very inspiring as it shows the power that audio-visual data has.

Ryoji Ikeda – data.path

Sophie Chen – Project 03 – Dynamic Drawing

sketch

var barR = 255;
var barG = 255;
var barB = 255;
var eX = 510;
var eY = 435;
var TVon = 1;
var ellipseA = 5;
var r = 200;
var g = 200;
var b = 200;
var limit = 150;


function setup() {
    createCanvas(640, 480);
}

function draw() {
	background(0, 0, 0, 70);
	// when TV is on, fill TV screen with dark blue & planet content
	if (TVon === 1) {
		fill(0, 0, 150, 70);
		noStroke();
		rectMode(CENTER);
		rect(width / 2, height / 2, width, height);

    	// planet size, varied by moving mouseX (move left = smaller, move right = larger)
    	push();
    	stroke(0, g, b);
   		strokeWeight(mouseX / 3);
    	fill(0, g, 255, 60);
    	ellipse(CENTER);
    	ellipse(width / 2, height / 2, limit, limit);
    	pop();

    	// core, smaller than planet by 1/3, also varied by moving mouseX
    	push();
    	noStroke(); 
    	stroke(0, g, 255, 70);
    	strokeWeight(limit);
    	fill(r, g, 255, 60);
    	ellipse(CENTER);
    	ellipse(width / 2, height / 2, limit / 3, limit / 3); // this ellipse will be smaller than the planet
    	pop();

   		// ring
    	push();
    	stroke(255, 100, b, 95);
    	strokeWeight(15);
    	noFill();
    	ellipse(CENTER);
    	ellipse(width / 2, height / 2, mouseY + 300, mouseX / 2);
    	pop();

    	// particles (sizes vary by sliding mouse)

    	//particle
    	fill(255, 255, b); 
    	noStroke();
    	push();
    	translate(width / 2, height / 2);
    	rotate(radians(mouseX));
    	ellipse(width / 10, height / 10, ellipseA, ellipseA);
    	pop();

    	// particle1
    	fill(g, r, b); 
    	noStroke();
    	push();
    	translate(mouseX, mouseX);
    	ellipse(width / 2, height / 2, mouseX / 3, mouseX / 3);
    	pop();

    	// particle2
    	fill(r, g, 255); 
    	noStroke();
    	push();
    	translate(mouseY, mouseY);
    	ellipseMode(CENTER);
    	ellipse(width / 2, height / 2, mouseX / 3, mouseX / 3); 
    	pop();

    	// particle3
    	fill(r, 255, 205); 
   		noStroke();
    	push();
    	translate(mouseX * 2, mouseY);
    	rotate(50);
    	ellipseMode(CENTER);
   		ellipse(width / 2, height / 2, mouseX / 10, mouseX / 10); 
    	pop();

    	// particle4
    	fill(255, g, 205); 
    	noStroke();
   		push();
    	translate(mouseX / 5, mouseY);
    	rotate(50);
    	ellipseMode(CENTER);
    	ellipse(width / 2, height / 2, mouseX / 7, mouseX / 7);
    	pop();

    	// particle5
    	fill(255, 235, b); 
    	noStroke();
    	push();
    	translate(mouseX / 5, mouseY);
    	rotate(100);
    	ellipseMode(CENTER);
    	ellipse(width / 2, height / 2, mouseX / 5, mouseX / 5);
    	pop();

    	//static bars that are triggered when mouse gets near on/off button
		fill(0, barG, 255, mouseY - 150); // opacity of static increases as mouse gets closer to the bottom frame
		noStroke();
		rectMode(CENTER);
		var center = height / 2
		rect(width / 2, center, width, mouseY);

		fill(0, barG, 0, mouseY - 150);
		noStroke();
		rectMode(CENTER);
		rect(width / 2, center - 60, width, mouseY / 3);

		fill(255, 0, barB, mouseY - 150);
		noStroke();
		rectMode(CENTER);
		rect(width / 2, center - 110, width, mouseY / 3)

		fill(barR, 0, 0, mouseY - 150);
		noStroke();
		rectMode(CENTER);
		rect(width / 2, center + 40, width, mouseY / 3);

		fill(0, 0, barB, mouseY - 150);
		noStroke();
		rectMode(CENTER);
		rect(width / 2, center + 80, width, mouseY / 3); 


		// constant top TV border
		fill(0, 0, 0)
		noStroke();
		rectMode(CENTER);
		rect(width / 2, 30, width, 60);

		// constant bottom TV border
		fill(0, 0, 0)
		noStroke();
		rectMode(CENTER);
		rect(width / 2, 440, width, 80);

	}
		// on/off button
		fill(225, 0, 0);
		noStroke();
		ellipse(eX, eY, 40, 40);
	// static bar variables
	barR = mouseY 
	barG = mouseY
	barB = mouseY

	// planet variables
	ellipseA = mouseX / 3
	r = mouseY - 100 
	g = mouseX - 150
	b = mouseY - 100
	limit = constrain(mouseX, 100, 150) // limit the size of planet
}

// turning TV on/off
function mouseClicked(){
	if (dist(mouseX, mouseY, eX, eY) <= 20) { // when mouse is clicking within radius of button, turn TV on/off
		TVon = -TVon;
    }	
}

I found keeping everything organized to be the hardest part of this project, I had a hard time finding a starting point but once I had a good base it was a lot more manageable. I wanted to recreate turning an old TV on/off and the static that goes with it, which worked nicely with the dynamic aspect of this project.

Sophie Chen – Looking Outwards – 03

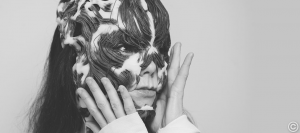
Rottlace – series of masks designed for Icelandic singer Björk.

close up of mask, worn by Björk

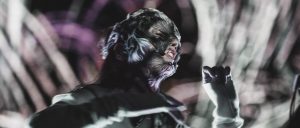
Rottlace is a series of masks that explored themes of self-healing and expressing the face without a skin. Images of the singer wearing the mask immediately caught my attention, in both its unconventional material/form and how the mask fits the singer’s face seamlessly. Rottlace is composed of rigid materials and elastic structures – the softer materials are flexible and designed to accommodate facial movement. The computational framework of this mask is based on Björk’s facial scan and informed by the human musculoskeletal system that controls the human voice. These highly complex structures are 3D printed with multiple materials that range from stiff to flexible and opaque to transparent, incorporating tunable physical properties that also allow movement. Although I couldn’t find a video of the mask being worn, I think the design of this mask successfully manifested the creator’s intentions as it almost eerily reflects the flexible and complex nature of the human body and is very compelling to look at.

singer Björk performing wearing one of the masks

link: https://www.media.mit.edu/projects/rottlace/overview/