Austin Treu – Looking Outwards 07

This is an example of a visualization of the 2016 electoral map. I find these fascinating for a variety of reasons, not only because it makes clear what the population distribution in the US is, but it also shows which states had the most influence over the result.

http://www-personal.umich.edu/~mejn/election/2016/

This site has a variety of population based maps that represent the spread in different fashions, by county and percentages of the vote and such. In looking at the county maps, especially the one shaped normally, I find it fascinating how this representation shows the widespread red and how compacted the blue is.

If you look at this map adjusted for population density, you can see this clearly because of how much larger the blue areas become.

The implications of one voterbase being so widespread and the other being so condensed are many, but I’m not here to discuss politics other than remarking on these being interesting.

Austin Treu – Project 07

atreu-proj-07

/*Austin Treu
    atreu@andrew.cmu.edu
    Section B
    Project 07*/

var cX = 0, cY = 0, nPoints = 100,
    t = 0, up = 0, bot = 0, a = 0, b = 0;

function setup() {
    createCanvas(480, 480);
    frameRate(10);
}

function draw() {
    //fade the background
    background(255,255,0,20);

    //actual shape
    //shape is based upon the devil's curve
    //http://mathworld.wolfram.com/DevilsCurve.html
    fill('orange');
    push();
    //center the shape
    translate(width/2, height/2);
    //scale down to half size
    scale(0.5);

    //create the shape
    beginShape();
    //utilize mouse values for a and b
    a = mouseX;
    b = mouseY;
    for (var i = 0; i < nPoints; i++) {
        //map t around a full circle
        t = map(i, 0, nPoints, 0, TWO_PI);
        //calculate points
        up = pow(a,2)*pow(sin(t),2)-pow(b,2)*pow(cos(t),2);
        bot = pow(sin(t),2) - pow(cos(t),2);
        cX = cos(t)*(sqrt(up/bot));
        cY = sin(t)*(sqrt(up/bot));
        vertex(cX, cY);
    }
    endShape(CLOSE);
    pop();

    //accidental spiky thing
    stroke('red');
    push();
    //center the shape
    translate(width/2, height/2);
    //increase size
    scale(25);

    //create the shape
    beginShape();
    //utilize mouse values for a and b
    a = mouseX;
    b = mouseY;
    for (var i = 0; i < nPoints; i++) {
        //map t around a full circle
        t = map(i, 0, nPoints, 0, TWO_PI);
        //calculate points
        up = pow(a,2)*pow(sin(t),2)-pow(b,2)*pow(cos(t),2);
        bot = pow(sin(t),2) - pow(cos(t),2);
        //an incorrect parenthesis can change EVERYTHING!!
        cX = cos(t*(sqrt(up/bot)));
        cY = sin(t*(sqrt(up/bot)));
        vertex(cX, cY);
    }
    endShape(CLOSE);
    pop();
}

The devil’s curve is what I based this project on. I struggled through this project at the beginning, dealing with a variety of issues that prevented the program from functioning correctly. This was mainly due to two parentheses that were out of place in my math.

costsqrt((a^2sin^2t-b^2cos^2t)/(sin^2t-cos^2t))

I mistakenly read this as cosine of the quantity of t times the square root as opposed to cosine of t times the quantity of the square root. I did the same for both x and y values. This created the red ‘starburst’ that appears in the middle of the drawing. Once I corrected this, I made a shape correctly based upon the devil’s curve but decided to leave the starburst, as it adds some interesting randomness to the image. Believe it or not, both of the things you see on screen were created with the same equation, only differing by two parentheses and scale.

KadeStewart-LookingOutwards-08

A screencap from Posavec’s 2018 talk that emphasizes qualitative data and Posavec’s hand-drawn style

Hailing from Denver and currently living in London, Stefanie Posavec is artist and designer who focuses on data that is more qualitative than quantitative/computational. That is not to say that her data visualization is uninformative, as the project below is chock-full of information. I love that no matter what data she collects, she finds it important. This is apparent all over her work, from the picture above that appeared in her talk at Eyeo 2018 to her postcards-turned-book-turned-MoMA collection called Dear Data.

Data visualization done by Posavec from an album by OK GO that led to the album’s art

Posavec’s style of presentation is very conservative, treating every piece of her work equally. This is mirrored in her work, as she says that she strives to treat each piece of process with the same importance as the final product. Her slides are not touched up for presentation, but are often just raw drawings of random bits of data. This is inspiring to me as I value the iterative process of creating, but I really struggle to treat everything as important like the final product. The idea that everything matters, from bits of data collected to the thrown out ideas to the final presentation that you give, is substantial and makes the creative process much more interesting in my eyes.


Stefanie Posavec’s 2018 Talk – Anoraks and the Analogue

Stefanie Posavec’s Website

Xiaoying Meng – Project 07 Curves

sketch

//Xiaoying Meng
//xiaoyinm@andrew.cmu.edu
//Project 7
function setup(){
    createCanvas(480,480);
    frameRate(10);
}

function draw(){
    background(220);
//top curve
    push();
    translate(width/3,height/3);
    rotate(PI - mouseY/40);
    drawCurve();
    pop();
//middle curve
    push();
    translate(width/2,height/2);
    rotate(PI + mouseY/40);
    drawCurve2();
    pop();
//bottom curve
    push();
    translate(width- width/3, height- height/3);
    rotate(PI - mouseY/40);
    drawCurve3();
    pop();

   
}

//regular Crv
function drawCurve(){
    var nPoints = 200;
    var a = (mouseX-100)/3*2;
    var b = (mouseY-100)/3*2;
    fill(0);
    noStroke();
    beginShape();
    for (var i=0; i < nPoints; i++ ){
        var angle = map ( i, 0, mouseX, 0, 2*PI);
        var x = a* (1/cos(angle));
        var y = b * tan(angle);
        vertex(x,y);
    }
    endShape();
}

//wiggly Crv
function drawCurve2(){
    var nPoints = 200;
    var a = (mouseX-100)/3*2;
    var b = (mouseY-100)/3*2;
    fill(255);
    noStroke();
    beginShape();
    for (var i=0; i < nPoints; i++ ){
        var angle = map ( i, 0, mouseX, 0, 2*PI);
        var x = a* (1/cos(angle));
        var y = b * tan(angle);
        vertex(x + random(-5,5),y + random(-5,5));
    }
    endShape();
}
//dotted Crv
function drawCurve3(){
    var nPoints = 200;
    var a = (mouseX-100)/3*2;
    var b = (mouseY-100)/3*2;
    fill(150);
    noStroke();
    beginShape();
    for (var i=0; i < nPoints; i++ ){
        var angle = map ( i, 0, mouseX, 0, 2*PI);
        var x = a* (1/cos(angle));
        var y = b * tan(angle);
        ellipse(x, y, 10, 10);
    }
    endShape();
}


I chose hyperbola curves. I created three different type of representation of the curves as surfaces and lines. By rotating them to different directions, interesting abstract composition start to occur.

Victoria Reiter – Project 07 – Curves

sketch

/*
Victoria Reiter
Section B
vreiter@andrew.cmu.edu
Project-07-Curves
*/

// initial angle of rotation for the shape
var angle = 0;

function setup() {
    // establishes canvas size
    createCanvas(480, 480);
}

function draw() {
    // sets background color
    // the same one as from my ptoject 3... I really like it:)
    // the opacity gives it a cool fading effect!
    background('rgba(255,187,203,0.05)');
    // C's get DEGREES
    angleMode(DEGREES);
    // declares variables that will be used in the mathy-math later on
    var x;
    var y;
    var radius1;
    var radius2;
    var ratio1;
    var ratio2;
    // center x and center y points
    var cx = width / 2;
    var cy = height / 2;
    // color of shape's line will change as mouse moves from right to left
    var strokeColor = map(mouseX, 0, width, 0, 255);
    // color of shape's fill will change as mouse moves from right to left
    var fillColor = map(mouseX, 0, width, 255, 0);
    // makes that angle of rotation will change as mouse moves up and down
    var increment = map(mouseY, 0, height, 0, 7);

    beginShape();
    stroke(strokeColor);
    fill(fillColor);
    push();
    // draws at center of canvas
    translate(cx, cy);
    rotate(angle);
    // math *bows*
    for (var theta = 0; theta < 360; theta +=1) {
        radius1 = 70;
        radius2 = 30;
        ratio1 = map(mouseX, 0, width, 10, 200);
        x = (radius1 * cos(theta) + radius2 * cos(theta * ratio1));
        y = (radius1 * sin(theta) + radius2 * cos(theta * ratio1));
        vertex(x, y);
    }
    // makes the shape rotate
    angle = angle + increment;
    endShape(CLOSE);
    pop();
}

So doing this project, I struggled a bit because, uh, I haven’t had to use cos or sin since highschool….
Anyway. I got inspiration from Spirographs, since I think they’re cool and vintage-y and nostalgic and remind me of being little and stories my parents have told me. But how does one draw a Spirograph??? I took to the internet to find out. I found many very unhelpful resources, and one most-helpful one, here. It listed the equations x = cx + radius1 × cos(θ) + radius2 × cos(θ) and y = cy + radius1 × sin(θ) + radius2 × cos(θ), which I used to design my curve.

I have interactive elements for the shape fill, shape color, density(?) of curves comprising the shape, and speed of rotation.

And I made the background pretty pink with the opacity toyed with for a cool effect, stolen from my own Project 3 assignment because I like this effect so much.

Very trippy, this project. Quite trippy.

Sean Meng – Project 7

sketch

function setup() {
    createCanvas(480, 480);
    frameRate(10);
}


function draw () {
    background(0)
    noFill()
    stroke(255)
    var nPoints = 20;
    var radius = 50;
    var separation = 125;
    var R1 = mouseX/2
    var R2 = mouseY/2

//the color of the pattern changes slowly from bluee to red as the mouse moves along the diagnal of canvas  
//the first set of rectangle loop
    stroke(mouseX, 10, 10)
    push();
    translate(2*separation, height / 2);
    for (var i = 0; i < nPoints; i++) {
        var theta = map(i, 0, nPoints, 0, TWO_PI);
        var px = R1 * cos(theta);
        var py = R2 * sin(theta);
        rect(px - 5, py - 5, 10, 10);
    }
    pop();

//the second set of rectangle loop
    stroke(mouseX, 30, 30)
    push();
    translate(2*separation, height / 2);
    for (var i = 0; i < nPoints; i++) {
        var theta = map(i, 0, nPoints, 0, TWO_PI);
        var px = R1 * cos(theta);
        var py = R2 * sin(theta);
        rect(px - 10, py - 10, 20, 20);
    }
    pop();

//the third set of rectangle loop
    stroke(mouseX, 50, 50)
    push();
    translate(2*separation, height / 2);
    for (var i = 0; i < nPoints; i++) {
        var theta = map(i, 0, nPoints, 0, TWO_PI);
        var px = R1 * cos(theta);
        var py = R2 * sin(theta);
        rect(px - 15, py - 15, 30, 30);
    }
    pop();

//the fourth set of rectangle loop
    stroke(mouseX, 70, 70)
    push();
    translate(2*separation, height / 2);
    for (var i = 0; i < nPoints; i++) {
        var theta = map(i, 0, nPoints, 0, TWO_PI);
        var px = R1 * cos(theta);
        var py = R2 * sin(theta);
        rect(px - 30, py - 30, 60, 60);
    }
    pop();

//the fifth set of rectangle loop
    stroke(mouseX, 90, 90)
    push();
    translate(2*separation, height / 2);
    for (var i = 0; i < nPoints; i++) {
        var theta = map(i, 0, nPoints, 0, TWO_PI);
        var px = R1 * cos(theta);
        var py = R2 * sin(theta);
        rect(px - 50, py - 50, 100, 100);
    }
    pop();

//the sixth set of rectangle loop
    stroke(mouseX, 110, 110)
    push();
    translate(2*separation, height / 2);
    for (var i = 0; i < nPoints; i++) {
        var theta = map(i, 0, nPoints, 0, TWO_PI);
        var px = R1 * cos(theta);
        var py = R2 * sin(theta);
        rect(px - 90, py - 90, 180, 180);
    }
    pop();

//the seventh set of rectangle loop
    stroke(mouseX, 140, 140)
    push();
    translate(2*separation, height / 2);
    for (var i = 0; i < nPoints; i++) {
        var theta = map(i, 0, nPoints, 0, TWO_PI);
        var px = R1 * cos(theta);
        var py = R2 * sin(theta);
        rect(px - 95, py - 95, 190, 190);
    }
    pop();

//the eighth set of rectangle loop
    stroke(mouseX, 170, 170)
    push();
    translate(2*separation, height / 2);
    for (var i = 0; i < nPoints; i++) {
        var theta = map(i, 0, nPoints, 0, TWO_PI);
        var px = R1 * cos(theta);
        var py = R2 * sin(theta);
        rect(px - 100, py - 100, 200, 200);
    }
    pop();

//the nineth set of rectangle loop
    stroke(mouseX, 220, 220)
    push();
    translate(2*separation, height / 2);
    for (var i = 0; i < nPoints; i++) {
        var theta = map(i, 0, nPoints, 0, TWO_PI);
        var px = R1 * cos(theta);
        var py = R2 * sin(theta);
        rect(px - 105, py - 105, 210, 210);
    }
    pop();

}    

In this project, I wanna design a floral pattern that can change colors using repeating geometries. The flower’s color changes to blue to read as the mouse moves diagonally on the canvas. The change of color also represents blossom.

Alessandra Fleck – Project 07

sketch

//Name: Alessandra Fleck 
//Class Section : B
//Email: afleck@andrew.cmu.edu
//Project-07


var Points = 500; //more points makes smoother curves
var Epitrochoid = 0; 

var x;
var y;


function setup() {
    createCanvas(480, 480);
    frameRate(40); //more frames = clearer motion
}

function draw() {
    background(0); // set background to black
    // draw the Epitrochoid

    push();
    translate(300, height / 2); //locate at upper left corner
    drawEpitrochoidCurve_01();
    //move second curve to lower right corner
    translate(width / 10, height/10);
    drawEpitrochoidCurve_02();
    //move second curve to lower right corner
    translate(width / 60, height/60);
    drawEpitrochoidCurve_03();
    pop();
}


function drawEpitrochoidCurve_01() { // for the curve on the top left corner
    
    
    var a =  40.0;
    var b = a / 0.2;
    var h = constrain(mouseY / 10.0, 0, b);
    var t;
    var mX = mouseX / 100.0; // mouse move over moves shape slower as value is larger
    var r = map(mouseX,0,width/0.8,0,1); //pulsing movement
    
    beginShape();
    fill(40,41,35);
    for (var i = 0; i < Points; i++) {

        stroke('red'); //add red to vibration lines
        strokeWeight(3);
        vertex(x, y);
        var t = map(i, 0, Points, 0, TWO_PI*3); // mess with curves within shapes

        //Parametric equations for Epitrochoid Curve
        x = r* ((a + b) * cos(t) - h * cos((t * (a + b) / b) + mX));
        y = r* ((a + b) * sin(t) - h * sin((t * (a + b) / b) + mX));
        
    }
    endShape(CLOSE);
    
}

function drawEpitrochoidCurve_02() { //for the curve on the bottom corner


    var a =  55.0;
    var b = a / 0.25; //degree of displacement
    var h = constrain(mouseY / 20.0, 0, b);
    var t;
    var mX = mouseX / 50.0;
    
    
    beginShape();
    fill(0);
    for (var i = 0; i < Points; i++) {
        stroke('red'); //add red to vibration lines
        strokeWeight(3);
        vertex(x+200, y+200);//set center point for the epitrochoid
        var t = map(i, 0, Points, 0, TWO_PI*3); // mess with curves within shapes
        
        //Parametric equations for Epitrochoid Curve

        x = (a + b) * cos(t) - h * cos((t * (a + b) / b) + mX);
        y = (a + b) * sin(t) - h * sin((t * (a + b) / b) + mX);
        
    }
    endShape(CLOSE);
    
}

function drawEpitrochoidCurve_03() { //for the curve on the bottom corner
    
    //light white line curves
    
    var a =  40.0;
    var b = a / 0.25; //degree of displacement
    var h = constrain(mouseY / 10.0, 0, b);
    var t;
    var mX = mouseX / 50.0;
    
    
    beginShape();
    fill(40,41,35);
    for (var i = 0; i < Points; i++) {
        stroke(255); //add red to vibration lines
        strokeWeight(1);
        vertex(x+200, y+200);
        var t = map(i, 0, Points, 0, TWO_PI*3); // mess with curves within shapes
        
        //Parametric equations for Epitrochoid Curve

        x = (a + b) * cos(t) - h * cos(mX + ((a + b) / b) + mX);
        y = (a + b) * sin(t) - h * sin(mX + ((a + b) / b) + mX);
        
    }
    endShape(CLOSE);
    
}

//http://mathworld.wolfram.com/Epitrochoid.html

For this project I just wanted to play with using the “b” variable in the parametric equation for an epitrochoid and using that variable as the axis for the degree of change in the movement. I did struggle a bit with the vertex parameter so if I continue this project that is what I would look to refine.

project 07

sketch,js

/* Arden Wolf
Section B
ardenw@andrew.cmu.edu
Project 07
*/


var nPoints = 20;
var radius = 50;
var separation = 125;

function setup() {
    createCanvas(480, 480);
    frameRate(10);
}

function draw() {
    background(0);
    noStroke();
    //magenta
    fill (50);
    ellipse(125,120,100,100);
    fill (80);
    ellipse(125,120,80,80);
    fill (100);
    ellipse(125,120,50,50);
    fill (120);
    ellipse(125,120,30,30);


    //yellow
    fill (50);
    ellipse(377,240,100,100);
    fill (80);
    ellipse(377,240,80,80);
    fill (100);
    ellipse(377,240,50,50);
    fill (120);
    ellipse(377,240,30,30);


    //calls light beam
    LightBeam(); 
    //calls wiggle
     wiggle();
    //call square
     square();


}

function LightBeam() {
  for(var h = 0; h < 100; h++) //allows for thicker lines
    {
        //yellow
         push();
        translate(3 * separation, height / 2);
        for (var i = 0; i < nPoints; i++) {
        var theta = map(i, mouseX, nPoints, mouseY, TWO_PI);
        var px = radius * cos(theta);
        var py = radius * sin(theta);
        stroke (255,255,0);
        line(-375, 238, px, py);
        }
        pop();

         push();
        translate(3 * separation, height / 2);
        for (var i = 0; i < nPoints; i++) {
        var theta = map(i, mouseX, nPoints, mouseY, TWO_PI);
        var px = radius * cos(theta);
        var py = radius * sin(theta);
        stroke (255,255,0);
        line(0, 238, px, py);
        }
        pop();


        //magenta
         push();
        translate( separation, height / 4);
        for (var i = 0; i < nPoints; i++) {
        var theta = map(i, mouseX, nPoints, mouseY, TWO_PI);
        var px = radius * cos(theta);
        var py = radius * sin(theta);
        stroke (255,0,255);
        line(360, 365, px, py);
        }
        pop();

         push();
        translate( separation, height / 4);
        for (var i = 0; i < nPoints; i++) {
        var theta = map(i, mouseX, nPoints, mouseY, TWO_PI);
        var px = radius * cos(theta);
        var py = radius * sin(theta);
        stroke (255,0,255);
        line(360, 0, px, py);
        }
        pop();
    }

}
function wiggle(){
    stroke(4);

    //first
    fill(255,165,0);
    push();

    translate(separation, height/1.7);
    beginShape();
    for (var i = 0; i < nPoints; i++) {
        var theta = map(i, mouseX, nPoints, mouseY, TWO_PI);
        var px = radius * cos(theta);
        var py = radius * sin(theta);
        vertex(px + random(-5, 5), py + random(-5, 5));
    }
    endShape(CLOSE);
    pop();

    //second
    fill(255,100,10);
    push();
    translate(separation, height/1.7);
    beginShape();
    for (var i = 0; i < nPoints; i++) {
        var theta = map(i, mouseX, nPoints, mouseY, TWO_PI);
        var px = radius * cos(theta)/2;
        var py = radius * sin(theta)/2;
        vertex(px + random(-5, 5), py + random(-5, 5));
    }
    endShape(CLOSE);
    pop();

}

function square(){
//first
    fill(255,100,10);
    push();
    translate(2*separation+40, height/1.18);
    beginShape();
    for (var i = 0; i < nPoints; i++) {
        var theta = map(i, mouseX, nPoints, mouseY, TWO_PI);
        var px = radius * cos(theta);
        var py = radius * sin(theta);
        vertex(px + random(-5, 5), py + random(-5, 5));
    }
    endShape(CLOSE);
    pop();

//second
    fill(255,165,0);
      push();
    translate(2*separation+40, height/1.18);
   beginShape();
    for (var i = 0; i < nPoints; i++) {
        var theta = map(i, mouseX, nPoints, mouseY, TWO_PI);
        var px = radius * cos(theta)/2;
        var py = radius * sin(theta)/2;
        vertex(px + random(-5, 5), py + random(-5, 5));
    }
    endShape(CLOSE);
    pop();
}

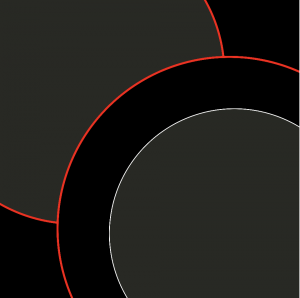
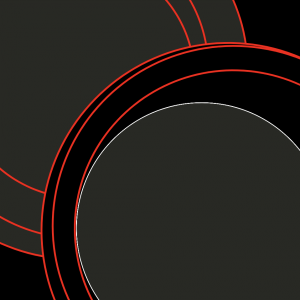
I was inspired by commits and stars in space and used the equations, mouseX and mouseY to make it interactive.

Jacky’s Project 07

sketch

//Yinjie Tian
//Section B
//yinjiet@andrew.cmu.edu
//Assignment-07-A
function setup() {
    createCanvas(480, 480);
    frameRate(10);
}

function draw() {
    background(0);
    noFill();
    stroke(255, random(150,255), 255)
    var nPoints = 20;
    var radius = width / 2 - mouseX;
    var radius2 = width / 2 - mouseX * random(0.4, 0.9)
    var radius3 = width / 2 - mouseX * random(0.4, 0.9)
    var radius4 = width / 2 - mouseX * random(0.4, 0.9)
    var radius5 = width / 2 - mouseX * random(0.4, 0.9)
    var radius6 = width / 2 - mouseX * random(0.4, 0.9)


    // draw the circle as a wiggly circle
    push();
    
    translate(width / 2, height / 2);
    beginShape();

    for (var a = 0; a < nPoints; a++) { //circle 1
        var theta = map(a, 0, nPoints, 0, TWO_PI);
        var px = radius * cos(theta);
        var py = radius * sin(theta);
        vertex(px + random(-5, 5), py + random(-5, 5));
    }
        noFill();
        stroke(random(150,255), 255, 255)
     for (var b = 0; b < nPoints; b++) {    //circle 2
        var theta = map(b, 0, nPoints, 0, TWO_PI);
        var px = radius2 * cos(theta);
        var py = radius2 * sin(theta);
        vertex(px + random(-5, 5), py + random(-5, 5));
    }
    noFill();
        stroke(random(150,255), random(150,255), random(150,255))
     for (var c = 0; c < nPoints; c++) {    //circle 3
        var theta = map(c, 0, nPoints, 0, TWO_PI);
        var px = radius3 * cos(theta);
        var py = radius3 * sin(theta);
        vertex(px + random(-5, 5), py + random(-5, 5));
    }
     for (var d = 0; d < nPoints; d++) {    //circle 4
        var theta = map(d, 0, nPoints, 0, TWO_PI);
        var px = radius4 * cos(theta);
        var py = radius4 * sin(theta);
        vertex(px + random(-5, 5), py + random(-5, 5));
    }
        noFill();
        stroke(random(150,255), 255, 255)
     for (var e = 0; e < nPoints; e++) {    //circle 5
        var theta = map(e, 0, nPoints, 0, TWO_PI);
        var px = radius5 * cos(theta);
        var py = radius5 * sin(theta);
        vertex(px + random(-5, 5), py + random(-5, 5));
    }
    noFill();
        stroke(random(150,255), random(150,255), random(150,255))
     for (var f = 0; f < nPoints; f++) {    //circle 6
        var theta = map(f, 0, nPoints, 0, TWO_PI);
        var px = radius6 * cos(theta);
        var py = radius6 * sin(theta);
        vertex(px + random(-5, 5), py + random(-5, 5));
    }
    endShape(CLOSE);
    pop();


}

For this project, I first choose the ellipse as the base geometry. Then I use vertex to make each of the ellipse to wiggle. The radius for the ellipse are selected randomly based on the mouseX position. Colors for the curves are also selected randomly.

looking outwards07

I was inspired by Ben Tricklebank’s and Aaron Koblin’s work called “Light Echos” where he broadcasts the patterns of light onto landscapes by a laser that is on a moving train. The artists utilize transportation and mount a laser to project various images such as maps, patterns and quotes onto the landscape. They represent space and time through the data of light reflecting off of earth. According to Wikipedia “A light echo is a physical phenomenon caused by light reflected off surfaces distant from the source, and arriving at the observer with a delay relative to this distance.” I admired how he was able to use coding and engineering to project the different images onto the landscape. This project was also a part of Doug Aitken’s station to station. Through this project these artists were able to use technology to manipulate how we look at the world around us.