Tanvi Harkare – Looking Outwards 07

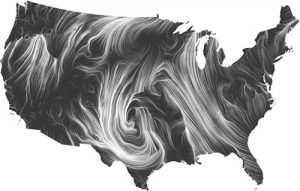
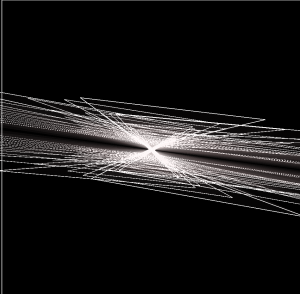
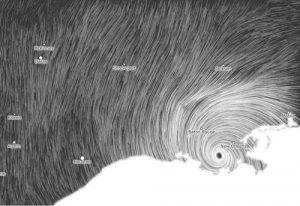
A project that I found interesting is the Wind Map by artist Martin Wattenberg and Fernanda Viegas. Martin Wattenberg leads the AI research initiative at Google, and focuses on combining those aspects with art. These wind maps range from calm days to huge hurricanes. In terms of time, all the maps focus on wind patterns since 2012. One of the main points that we can get out of this is that whether there is a hurricane or slight winds, wind patterns can still look dramatic at a 2D level. The algorithm to create this artwork is purely done in JavaScript and html, and the comet like tails describe the specific wind pattern.

An image based off Hurricane Isaac’s wind patterns
An overall wind map of the United States

I thought this was an interesting project because earlier this semester, we had to do a similar project for our architecture studio. Using wind patterns and other climate data can help us design better buildings. You can view the full project here.

Alessandra Fleck – Looking Outwards – 07

For this analysis on data visualization artists, I wanted to look into the work of American scientist, Martin Wattenberg. With experience in working at IBM and co-leading Google PAIR, Wattenberg carries an interest in the different connections technology can make and the narrative and beauty that emerges from those connections. One such project that takes computation and captures the narrative/ storytelling of it that I find particularly interesting is Wattenberg’s Shape of Song exhibition.

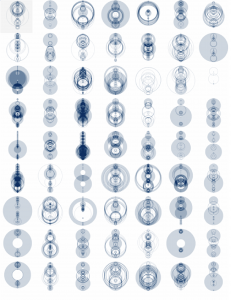
(The above image shows a matrix of Wattenberg’s entire Shape of Song collection. The program to create these intricate forms was written in Java)

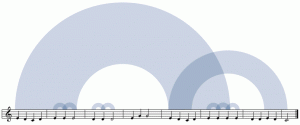
The purpose of the Shape of Song exhibition was to create works through the connection of different characters in a musical piece. As seen in the image below these connection would occur in the form of arches, which vary in size and span according to the distance between relating parts in the musical composition. Wattenberg achieved these forms by implementing the music in the form of a MIDI file, which was then separated and analyzed in subsets of “tracks.”

Once this process is done in several iterations through the course of the entire piece, the resulting work is a large set of connecting arches with different dynamic qualities.

(The image above shows a diagram of the Goldberg Variations. The AABB structure of the composition can be seen in the way that the piece can be broken up into two separate parts.)

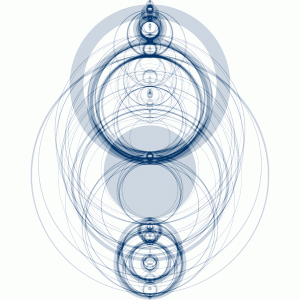
(The image above shows one completed work from the Shape of Song exhibition that captures the different connections and repetitions of musical components in Vivaldi’s Autumn, Four Seasons composition. )

What I find most interesting about this form of data visualization is the way in which it looks to find connections in something that seemingly has a set beginning and end. The way in which the data is visualized in this manner shows another interesting way of interpreting music and how it is structured by taking something that we hear and mapping it into something that we can see.


Read More:

http://turbulence.org/Works/song/method/method.html

http://www.bewitched.com/song.html


KadeStewart-LookingOutwards-07

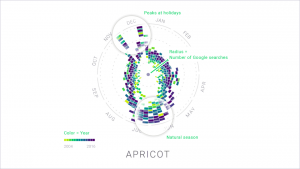
Examples of the image that The Rhythm of Food can generate (Moritz Stefaner)

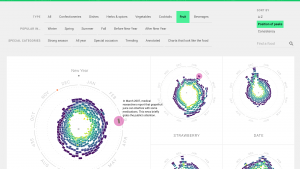
This project, The Rhythm of Food, is a visualization of google searches of food. The circle, going 360 degrees, maps to each month of the year, the color of the block represents a specific year, and the radius of the block is the number of google searches. So the farther the block is, the larger the number of google searches of that particular food in that month of the specified year. This leads to patterns that are easy to spot – for example, summer fruits are more often searched in, you guessed it, the summer.

This project is clean, beautiful, and informative. It also captures big patterns and small idiosyncrasies. “Sour Cherry” is not only a fruit, but also a song by The Kills that was popular in February of 2008. This small detail is captured by this visualization, illustrating how the project does an amazing job of capturing both the large and the small, and does so in a way that is easy to understand.

The Rhythm of Food

Min Jun Kim- Looking Outwards 7

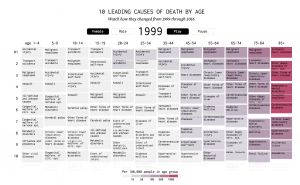
Nathan Yau’s Shifting Causes of Death
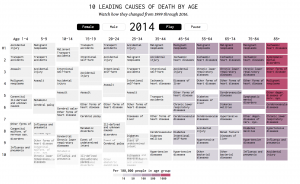
Nathan Yau’s Shifting Causes of Death after few seconds

Source: https://flowingdata.com/2018/10/02/shifting-death/

I figured that I would put the source first this time, because WordPress’s size limit makes it very difficult to read what’s in the infographic- also because the infographic is animated. This week’s project that I would like to discuss is a very interesting information visualization. The project involves columns of different age groups and shifting rectangles that detail the causes of death according to how common it is. The rectangles shift over time as the project moves through the years. I admire this project quite a bit because the artwork’s portrays vast amount of information in such a limited space and does it quite elegantly. I admire it because with the usage of the project, people will be able to see highly relevant information that is otherwise difficult to find out about.
As for the algorithm that generated this work, I assume that there is a counting variable that counts specific input from the vast data there is. Also, there would have to be another sorting algorithm that ranks the most common causes of death. Lastly, there would be a draw function that animates the data in an interesting way.
The creator’s artistic sensibilities manifested into the final form when he is able to display so many aspects and dimensions of data into a single format. The data that the work describes, age group, gender, time-line, usage of color to represent the rate within age group, and causes of death. I think that there is true mastery within such simplicity.

KadeStewart-Project-06-AbstractClock


sketch

//Kade Stewart
//Section B
//kades
//Project-05


function setup() {
    createCanvas(480, 480);
    background(255);

    noStroke();
}

var m;
var sec;
var hr;
var min;


function draw() {
    background(255,255,153);
    sec = second();
    min = minute();
    if ((min / 10) < 1) {
    	min = "0" + min;
    }
    hr = hour() % 12;
    if (hr == 0) {
    	hr = 12;
    }


    noStroke();
    fill(30,144,255);
    textSize(45);
    text(min, width/2 - 25, height - 5);
	fill(255,255,153);
	noStroke();
	rect(width/2 - 30, height - 60 - ((height/60)*sec), 60, (hr * 20) + 40);


	//draw the waterlines for each hour
    for (y=0; y < hr; y++) {
    	//this draws the entire length of the window
        for (i=0; i < width; i++) {
            noStroke();
            if (y % 2 == 0) {
            	fill(255); 			//draw in white and blue, alternating every line
            } else {
            	fill(230, 230, 255);
            }
            //the line is composed of circles
            ellipse(i, ((height + (y*20)) - (height/60)*sec) + sin(i/6), 6, 6);	
        }
    }


    //draw the lines of the face
    noFill();
    stroke(0);
    strokeWeight(3);
    arc(width/2, height/2 + 60, 30, 20, PI/2, (5/4) * PI);
    arc(width/2, height/2 + 40, 30, 30, (3/4) * PI, PI);
    line(width/2 - 8, height/2 + 52, width/2 + 2, height/2 + 56);
    arc(width/2, height/2 + 64, 16, 16, (3/2) * PI, (7/4) * PI);
    arc(width/2 - 15, height/2 + 25, 30, 30, 0, PI/2);
    arc(width/2, height/2, 50, 50, PI/2, (3/2) * PI);
    arc(width/2, height/2 - 55, 10, 60, (3/2) * PI, PI/2);

    //draw the tear
    push();
    translate(width/2, height/2 - 25);
    
    m = floor(millis()) % 1000;
    m = map(m, 0, 1000, 0, height - (height/2 - 25));


    fill(30,144,255);
    ellipse(0, m, 12, 12 + m * .025);

    pop();

}

I was listening to my sad song playlist, and to me it seemed that tears were pretty rhythmic. I used them to create the second “hand”, while creating the illusion that the tears were filling up the page with the waterlines. Each line (technically a sine wave) represents an hour on the clock. The minutes are simply show, but only when the water rises above the bottom of the page.

Min Jun Kim- Project 7 Curves

Try clicking and dragging!
sketch

/*
Min Jun Kim
minjunki@andrew.cmu.edu
15104-B
Project 7
*/

//This project draws a 3D model of spherial spiral

//how many points there are
var nPoints = 500;
//used for dragging
var dragging = false;

function setup() {
    createCanvas(480, 480, WEBGL);
    frameRate(100);
}


function draw() {
    background(0);
    // draw the frame
    stroke(255);
    noFill(); 
    rect(-width/2+3, -height/2+3, width-6, height-6); 
    //a circle that follows the mouse
    ellipse(mouseX-width/2,mouseY-height/2, 50,50);


    // draws the curve
    push();
    //rotate on z axis automatically, rotate x and y when clicked
    rotateZ(millis() / 8000);
    if (dragging == true) {
    	rotateX((mouseX-width/2) / 500);
	    rotateY((mouseY-height/2) / 500);
    }
    //calls drawing function.
    drawSphericalSpiral();
    pop();
}

//--------------------------------------------------
function drawSphericalSpiral() {
    // Spherical Spiral
    // http://mathworld.wolfram.com/SphericalSpiral.html
    //initialize points
    var x;
    var y;
    var z;
    //complexity depends on mouse
    var ph = mouseX / 10000.0;
    stroke(255);
    //transparent fill
    fill(255, 200, 200,3);
    beginShape();
    for (var i = 0; i < nPoints; i++) {
        var t = map(i, 0, nPoints, 0, TWO_PI);        
        x = 80*cos(i)/Math.pow(1+ph*ph*t*t,1/2);
        y = 80*sin(i)/Math.pow(1+ph*ph*t*t,1/2);
        z = 80*-ph*i/Math.pow(1+ph*ph*t*t,1/2);
        vertex(x, y, z);
    }
    endShape(CLOSE);
 	
}

function mousePressed() {
	dragging = true;
}

function mouseReleased() {
	dragging = false;
}

At first, I didn’t quite understand how to use mathematical functions to draw, but after messing around with the vertices, I learned the basics of it. I messed around with various functions, but I wanted to use a more complex curve. I then tried to implement a 3D function and the one that I liked the most was a spherical spiral. I thought that the shape was interesting in the drawings I found online. I realized that it doesn’t look exactly like that image I found online, which can possibly partly be attributed to the lack of negative values available in the functions, but I think that it still looks very interesting. The constant rotation made me dizzy so I implemented a dragging function so that it looks much simpler from one side. From the z axis, it looked like a regular circle so I made the coloring of it more transparent so that the planes are more see-through. I think the project turned out great and it taught me a lot about how to draw in javascript.

Here are some iterations where I was messing around with the numbers and variables in the function.

Process documentation 1.
Process documentation 2.

Romi Jin – Project-05-Abstract Clock

sketch

/*
Romi Jin
Section B
rsjin@andrew.cmu.edu
Project-06
*/

var hr;
var min;
var sec;

var secMap;
var minMap1;
var minMap2;
//var hrMap;

function setup() {
    createCanvas(480, 900);
    background(255, 228, 225);
    angleMode(DEGREES);

    //carrots redraw
    for(var i = 0; i < second(); i++) {
        push();
        carrots(i*(width/60));
        pop();
    }
}

function draw() {

    hr = hour();
    min = minute();
    sec = second();

    secMap = map(sec, 0, 60, 0, width);
    minMap1 = map(min, 0, 60, 50, height-100);
    minMap2 = map(min, 0, 60, 101, height-50);
    //hrMap = map(hr % 12, 0, 12, 0, height);

    push();
    balloons(minMap1);
    pop();
    push();
    bunny(minMap2);
    pop();
    push();
    carrots(secMap);
    pop();
    grass();

    //redraw canvas after one minute so the carrots begin at 0 again
    if (sec==59) {
        background(255,228,225);
        push();
        balloons(50+min+10);
        pop();
        push();
        bunny(101+min+10);
        pop();
        grass();
    }

}

function carrots(xpos) {

    translate(xpos+5, height-13);
    noStroke();

    //left stem 
    push();
    rotate(-20);
    fill(114, 173, 101);
    ellipse(2, -10, 2, 4);
    pop();

    //right stem
    push();
    rotate(20);
    fill(114, 173, 101);
    ellipse(-2, -10, 2, 4);
    pop();

    //middle stem
    fill(114, 173, 101);
    ellipse(0, -10, 3, 6);

    //carrot body
    fill(249, 181, 118);
    ellipse(0, 0, 6, 18);

}

function grass() {

    translate(2, height);
    stroke(203, 232, 189);
    strokeWeight(2);

    //vertical
    var x = 0; //spacing
    for (i = 0; i < width; i++) {
        line(i + x, 0, i + x, -15);
        x += 5; 
    }

    //diagonal
    var x = 0; //spacing
    for (i = 3; i < width; i++) {
        line(i + x, 0, i + x + 3, -15);
        x += 5; 
    }

}

function balloons(ypos) {

    var vals = [240, 220, 210, 265, 235, 255];
    var balloonD = 30;

    //strings
    push();
    stroke(0);
    strokeWeight(0.25);
    line(vals[0], ypos+17.5, width/2, ypos+100);
    line(vals[1], ypos+17.5, width/2, ypos+100);
    line(vals[2], ypos+17.5, width/2, ypos+100);
    line(vals[3], ypos+17.5, width/2, ypos+100);
    line(vals[4], ypos+17.5, width/2, ypos+100);
    line(vals[5], ypos+17.5, width/2, ypos+100);
    pop();

    //balloons
    push();
    noStroke();

    fill(255, 250, 165);
    ellipse(vals[1], ypos+10, balloonD, balloonD+5);
    fill(255, 250, 200);
    ellipse(vals[2], ypos-10, balloonD, balloonD+5);
    fill(190, 240, 235);
    ellipse(vals[3], ypos+10, balloonD-5, balloonD);
    fill(190, 250, 200);
    ellipse(vals[4], ypos-20, balloonD, balloonD+5);
    fill(190, 225, 200);
    ellipse(vals[5], ypos-15, balloonD, balloonD+5);
    fill(255, 221, 165);
    ellipse(vals[0], ypos, balloonD, balloonD+5);
    pop();

}

function bunny(ypos) {

    fill(255);
    stroke(0);
    strokeWeight(0.75);
    //right ear
    push();
    translate(width/2+4, ypos);
    rotate(10);
    ellipse(0, 0, 5, 15);
    pop();
    //left ear
    push();
    translate(width/2-4, ypos);
    rotate(30);
    ellipse(0, 0, 5, 15);
    pop();
    //tail
    ellipse(width/2-15, ypos+41, 8);
    //right foot
    push();
    translate(width/2-10, ypos+49);
    rotate(-45);
    ellipse(18, 15, 8, 12);
    pop();
    //body
    ellipse(width/2, ypos+27, 40, 50);
    //left foot
    push();
    translate(width/2-10, ypos+49);
    rotate(-45);
    arc(3, 4, 8, 12, -10, 260, OPEN);
    pop();
    //left cheek
    push();
    noStroke();
    fill(255, 228, 225);
    ellipse(width/2-7, ypos+19, 6);
    pop();
    //right cheek
    push();
    noStroke();
    fill(255, 228, 225);
    ellipse(width/2+14, ypos+18, 6);
    pop();
    //left eye
    push();
    strokeWeight(3);
    point(width/2-5, ypos+17);
    pop();
    //right eye
    push();
    strokeWeight(3);
    point(width/2+12, ypos+16);
    pop();
    //nose
    line(243, ypos+18, 244, ypos+19);
    line(244, ypos+19, 245, ypos+18);
    //left hand
    push();
    translate(width/2-10, ypos+31);
    rotate(-45);
    arc(3, 4, 6, 8, -10, 250, OPEN);
    pop();
    //right hand
    push();
    translate(width/2-10, ypos+33);
    rotate(-45);
    arc(18, 15, 6, 8, -10, 250, OPEN);
    pop();

}


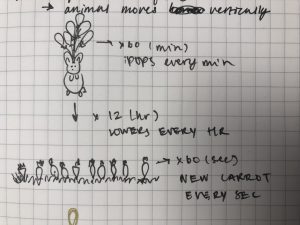
For my clock, I illustrated a bunny floating down on balloons as time passes. The carrots at the bottom indicate the seconds passed, the bunny moves down as each minute passes, and the bunny resets (goes back to the top) after 12 hours. I wanted to do a lot more with this project (i.e. make the balloons different colors and disappear after each minute went by (it would begin with 60 balloons) and the bunny moving down every hour instead of ever minute), but I ran out of time and was more difficult than I thought it’d be. However, I had so much fun making this project and loved coming up with ideas to make a non-conventional clock! (also, it looks like an iPhone wallpaper I would use!!)
Philip Gates – Project 06 – Abstract Clock

sketch

function setup() {
    createCanvas(400, 400);
}

function draw() {
    
    //fetches increments of time
    var H = hour();
    var M = minute();
    var S = second();
    var totalSec = ((H * 3600) + (M * 60) + S); //calculates total # seconds in day so far

    //maps increments of time to circle size
    var mappedH = map(H, 0, 23, 0, 200); 
    var mappedM = map(M, 0, 59, 0, 150); 
    var mappedS = map(S, 0, 59, 0, 100);

    //maps increments of time to color values
    var colorH = map(H, 0, 23, 255, 0); 
    var colorM = map(M, 0, 59, 255, 0); 
    var colorS = map(S, 0, 59, 255, 0); 
    
    //creates grayscale roughly in accordance with time of day
    var sky1 = map(totalSec, 0, 43200, 0, 255); //midnight-noon goes from black to white
    var sky2 = map(totalSec, 43201, 86400, 255, 0); //noon-midnight goes from white to black
    
    background(255);

    //draw background circle, fill according to time of day
    if (totalSec <= 43200) {
        fill(sky1);
    }   else {
        fill(sky2);
    }   ellipse(width/2,height/2,width,height);

    //draw circles that expand as increments of time grow
    //fill with colors that get more saturated as increments of time increase
    noStroke();
    fill(colorH,255,255);
    ellipse(150, 130, mappedH, mappedH); //hour
    fill(255,colorM,255);
    ellipse(260, 270, mappedM, mappedM); //minute
    fill(255,255,colorS);
    ellipse(135, 280, mappedS, mappedS); //second
}

I wanted to keep circles as an integral part of the design, because my own experience of time feels most attuned to cycles— the calendar, circadian rhythms, etc. The movement and color of the inner circles are tied to “human” time (hours, minutes, seconds), while the color of the background circle is tied (very approximately, using noon as the brightest point and midnight as the darkest) to the position of the sun in the sky. The map function came in very handy for this project.

Sean Meng – Project 06

meng-sketch

//Sean Meng
//Section B
//hmeng@andrew.cmu.edu
//Project 06

function setup(){
    createCanvas(480,480);
    angleMode(DEGREES);
}


function draw (){
    background(0);
    var h = hour();
    var m = minute();
    var s = second(); 

    stroke(27, 101, 211)
    for (var i = 0; i < 100; i += 3)
        line(width/5 + i*10, 0, 0, height + i*(-10))

    stroke(145, 200, 224)
    for (var i = 0; i < 100; i += 2)
        line(width/20 + i*10, 0, 0, height + i*(-10))
    
    stroke(27, 101, 211)
    for (var i = 0; i < 100; i += 3)
        line(width/20 + i*10, height, width, height + i*(-10))
   
    stroke(145, 200, 224)
    for (var i = 0; i < 100; i +=2)
        line(width/5 + i*10, height, width, height + i*(-10))

    
    push();
    noStroke();
    fill(20, 27, 226);
    translate(width/2,height/2);
    rotate(s*(360/60));
    rotate(-90);
    rect(120, 0, 90, 10);
    pop();
    
    push();
    noStroke();
    fill(125, 114, 224)
    translate(width/2,height/2);
    rotate(m*(360/60));
    rotate(-90);
    rect(30, 0, 50, 5);
    pop();
    
    push();
    noStroke();
    fill(171, 45, 206);
    translate(width/2,height/2);
    rotate(h*(360/12));
    rotate(-90);
    rect(50, 0, 20, 2);
    pop();

    noStroke()
    fill(211, 107, 196)
    ellipse(width/2, height/2, 30, 30)
}
    

In this project, I wanna combine the previous work with my abstract clock design, the three rectangles represents three hands of the clocks and their colors varies.

yinjiet-project-06

sketch

//Yinjie Tian
//Section B
//yinjiet@andrew.cmu.edu
//Assignment 06

var x = []; 
var y = [];
var dx = []; 
var dy = []; 
var col = []; 

function setup() { 
    createCanvas(480, 480);
    angleMode(DEGREES);
    for (i = 0; i < 100; i++) { 
        x[i] = random(width);
        y[i] = random(height);
        dx[i] = random(-5, 5);
        dy[i] = random(-5, 5);
        col[i] = color(random(255), random(255), random(255));
    }
    frameRate(5);
}


function draw() {
 
    background(80, 200, 100);
 
 //bubbles at the background   
    noStroke();
    for (i = 0; i < 100; i++) {  // for each rectangle ...
        fill(col[i]);
        ellipse(x[i], y[i], 10, 10);
        x[i] += dx[i];
        y[i] += dy[i];
        
        if (x[i] > width) x[i] = 0;        //horizontally
        else if (x[i] < 0) x[i] = width;
        if (y[i] > height) y[i] = 0;       //vertically
        else if (y[i] < 0) y[i] = height;
    }

        var h = hour();
        var m = minute();
        var s = second(); 

//clock bubbles
    push();
    noStroke();
    fill(200, 200, s * 5);
    translate(width/2,height/2);
    rotate(s * (360/60));
    
    ellipse(200, 0, 60, 60);
    line()

    pop();
    
    push();
    noStroke();
    fill(200, m * 5, 200);
    translate(width/2,height/2);
    rotate(m*(360/60));
    
    ellipse(60, 0, 40, 40);
    pop();
    
    push();
    noStroke();
    fill(h * 25, 200, 200);
    translate(width/2,height/2);
    rotate(h*(360/12));
    
    ellipse(100, 0, 20, 20);
    pop();

//center point
    strokeWeight(4);
    stroke(0)
    line(width / 2 - 25, height / 2, width / 2 + 25, height / 2);
    line(width / 2, height / 2 - 25, width / 2, height / 2 + 25);
    fill(255, 0, 0);
    ellipse(width/2, height/2, 10, 10); 

}

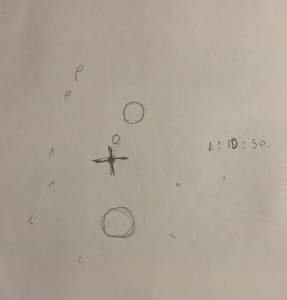
The background is a bunch of randomly moving rectangle with random colors. A cross with a red dot representing the center for the clock. Three bubbles with constantly changing colors based on time orbiting around the cross indicates the time. Second is the largest and furthers bubble and hour is the smallest and closest bubble.