Xiaoying Meng – Project 6 Abstract Clock

sketch

//xiaoying meng
//B
//xiaoyinm@andrew.cmu.edu
//Project6
var prevSec;
var millisRolloverTime;

function setup() {
    createCanvas(480, 480);
    millisRolloverTime = 0;
}

function draw() {
    background(0); 

    var H = hour();
    var M = minute();
    var S = second();
    
    if (prevSec != S) {
        millisRolloverTime = millis();
    }
    prevSec = S;
    var mils = floor(millis() - millisRolloverTime);
    
    var hourBarWidth   = map(H, 0, 23, 0, width);
    var minuteBarWidth = map(M, 0, 59, 0, width);
    var secondBarWidth = map(S, 0, 59, 0, width);
    angleMode(DEGREES);
    stroke(0);

//hour
    push();
    translate(240,20);
    rotate(hourBarWidth);
    rect(0,0,250,250);
    pop();

//minute
    push();
//vertical left
    stroke(255);
    strokeWeight(5);
    translate(0,minuteBarWidth);
    line(125,155,125,270);
    line(135,155,135,270);
    line(145,155,145,270);
    line(155,155,155,270);
    line(165,155,165,270);
    line(175,155,175,270);
    line(185,155,185,270);
//horizontal
    strokeWeight(2);
    line(190,255,350,255);
    line(190,260,350,260);
    line(190,265,350,265);
    line(190,270,350,270);
//vertical right
    strokeWeight(3);
    line(295,155,295,250);
    line(305,155,305,250);
    line(315,155,315,250);
    line(325,155,325,250);
    line(335,155,335,250);
    line(345,155,345,250);
    pop();    

    push();
    fill(205,49,27);
    translate(0,minuteBarWidth);
    rect(190,0,100,250);
    pop();

//second
    push();
//circle
    fill(0);
    translate(secondBarWidth,secondBarWidth);
    arc(0,0,150,150,120,300);
    fill(255);
    arc(0,0,150,150,300,120);
    pop(); 
//lines
    push();
    translate(secondBarWidth,secondBarWidth);
    rotate(-105);
    stroke(255);

    line(-480,-480,480,480);
    pop();

    push();
    translate(secondBarWidth,secondBarWidth);
    rotate(50);
    stroke(255);
    line(-480,-480,480,480);
    pop();
}


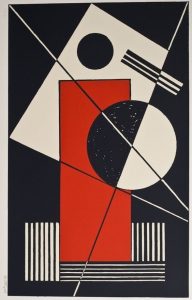
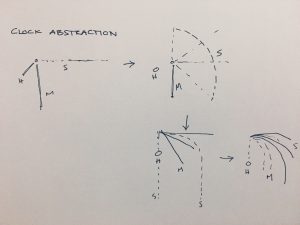
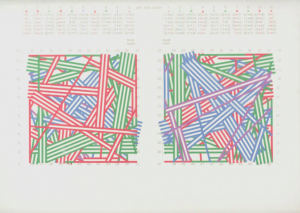
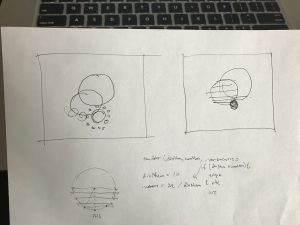
I decided to use abstract art as my idea for the abstract clock. As time passes, each shape representing second, minute and hour changes locations. Thus, creating, different compositions.

looking outwards

Jackson Pollock’s art is a main example of art generated by randomness. He was pioneer in abstract art, breaking boundaries of what artists can represent in an image. Pollock lets physics be the main player in his process and he was one of the firsts to make art with the canvas horizontally on the floor, while splattering paint on top. Andy Warhol made fun of this with his Oxidation painting. He had his assistants pee on a canvas that was laying horizontal to the floor. In this he also lets physics be a main player in the making of the work and is a diss to Pollock as pissing on the canvas has this meaning, while he also uses the same creative process to achieve the work.

project 6

sketch.js

function setup() {
    createCanvas(600, 600);
}

//--------------------------
function draw() {
    background(255);
    noStroke();
    
    // current time
    var H = hour();
    var M = minute();
    var S = second();
    
    // widths of the rectangles
    //map(value, start1, stop1, start2, stop2, 

    var mappedH = map(H, -5,23, width,0);
    var mappedM = map(M, -5,59, width,0);
    var mappedS = map(S, -5,59, width,0);
    var rectHeight = width / 3;
    
    // rectangle time bars


//Hour
    fill (0)
    rect(0*rectHeight,0, rectHeight,width);
    fill(255);
    rect(0*rectHeight,0, rectHeight,mappedH);
//minute
    fill(50);
    rect(1*rectHeight,0, rectHeight,width);
    fill(255); //background color
    rect(1*rectHeight,0,rectHeight, mappedM);
  //second  
    fill(100);
    rect(2*rectHeight,0, rectHeight,width);
    fill(255);
    rect(2*rectHeight,0, rectHeight,mappedS); //rectangle that moves


//text
    fill(255);
    textFont('Georgia');
    text("Hour " +H, 0*rectHeight+95, mappedH +15);
    text("Minute " +M, 1*rectHeight + 95,mappedM +15 );
    text("Second " +S, 2*rectHeight +95, mappedS +15);//mapped allows the text to move with the bars
    
}

My clock was inspired by a bar graph. I used the mapped function we learned.

Austin Treu – Project 06

atreu-proj-06

/*Austin Treu
	atreu@andrew.cmu.edu
	Section B
	Project-06*/

var hSize = 80, mSize = 40, sSize = 20
    hourX = 0, hourY = 150, 
    minX = 0, minY = 250,
    secX = 0, secY = 350, 
    wProp = 0, hProp = 0, 
    wPropH = 0, hPropH = 0;

//--------------------------
function setup() {
    createCanvas(480, 480);
    wProp = width/60;
    hProp = height/60;
    wPropH = width/12;
    hPropH = height/24;
}

//--------------------------
function draw() {

    /*TEST CODE - grid for measurement
    line(30*wProp, 0, 30*wProp, height);
    line(0, 30*hProp, width, 30*hProp);
    line(15*wProp, 0, 15*wProp, height);
    line(0, 15*hProp, width, 15*hProp);
    line(45*wProp, 0, 45*wProp, height);
    line(0, 45*hProp, width, 45*hProp);*/
    
    // Fetch the current time
    var H = hour();
    var M = minute();
    var S = second();
 

    //draw background, base upon time
    background((S+1)*2.125,int(255-(S+1)*2.125),255-S, (H+S)/4);

    //set current ellipse locs
    hourX = H*hPropH;
    hourY = ((pow(((hourX-width/2)),2)/16)+7*height)/16;
    minX = M*hProp;
    minY = (abs(pow((minX-height/2)/6,2)-height))/4;
    secX = S*hProp;
    secY = -(abs(pow((secX-height/2)/6,2)-height)-4*height)/4;

    //add trail lines every few seconds (pulsating effect)
    if(S%3 === 0){
		stroke(3*S,200-S, 200-S, 10);
	    strokeWeight(5);
	    for(var i = 0; i<width; i++){
	    	//H
	    	var y = -(abs(pow((i-height/2)/6,2)-height)-4*height)/4;
	    	point(i,y);
	    	//M
	    	y = (abs(pow((i-height/2)/6,2)-height))/4;
	    	point(i,y);
	    	//S
	    	y = ((pow(((i-width/2)),2)/16)+7*height)/16;
	    	point(i,y);
	    }
	    noStroke();
	}

    //draw ellipses for time
    fill('yellow');
    ellipse(hourX, hourY, hSize, hSize);
    fill(0,100,255);
    ellipse(minX, minY, mSize, mSize);
    fill(230);
    ellipse(secX, secY, sSize, sSize);
}

This clock assignment took a few different forms in my head, as I wanted to have a vague space/sky theme and also be as minimalist as possible while still getting the point across. I initially thought about utilizing orbital circles, but I ultimately decided that it would be more interesting to mess around with some other types of functions, with the ‘sun’ (hours) having a simple parabola to portray sunrise and sunset. The ‘planet’ (minutes) and ‘moon’ (seconds) actually mirror each other in their patterns, bouncing off of the bottom of the screen at 1/4 and 3/4 of the way through. This keeps things simple whilst allowing an onlooker to easily see quarter minutes and hours as well as days.

Alessandra Fleck – Project 06 Clock

sketch

//Name: Alessandra Fleck 
//Class Section : B
//Email: afleck@andrew.cmu.edu
//Project-06


function setup() {
    createCanvas(480, 480);
    noStroke();
}

function draw() {
    background(255);

    //set for for hour,minutes and seconds
    var h = hour(); 
    var m = minute();
    var s = second();

    //blue waves going down
    for (var i = 0; i < (s*10); i ++) { //increments at x10 the distance
        stroke(179,223,222);
        strokeWeight(0.3);
        line(i*4, 0, width, i); 
        line(i*2, 0, height * 2, i); 
        line(i*4, 0, height * 4, i); 
        line(i*2, 0, height * 0.75, i + 20); 
        line(i*4, 0, height * 0.6, i + 20); 
        line(i*2, 0, height * 0.5, i + 100); 
    }

    //brown waves going down
    for (var i = 0; i < (s*20); i +=5) { //increments at x20 the distance
        stroke(255);
        strokeWeight(0.5);
        line(i*2, 0, width, i); 
        line(i*2, 0, height * 2, i); 
        line(i*2, 0, height * 4, i); 
        line(i*2, 0, height * 0.75, i + 200); 
        line(i*2, 0, height * 0.6, i + 200); 
        line(i*2, 0, height * 0.5, i + 600); 
    }

    //black waves going down for the minutes
    for (var i = 0; i < m; i +=5) { //strings will slowly branch out black for every minute
        stroke(0);
        strokeWeight(0.3);
        line(i*2, 0, width, i); 
        line(i*2, 0, height * 2, i); 
        line(i*2, 0, height * 4, i); 
        line(i*2, 0, height * 0.75, i + 200); 
        line(i*2, 0, height * 0.6, i + 200); 
        line(i*2, 0, height * 0.5, i + 600); 
    }

    //white circle_01
    fill(100,10+(s*50),255);
    noStroke();
    ellipse(50,s*10,30,30);

    //white circle_01_hour
    fill(255);
    stroke(0);
    strokeWeight(1);
    ellipse(50,h*10,30,30);


}

For this project I wanted the abstraction of the clock to be something that is completed as time passes. Instead of the long skinny arms of a clock being the seconds passing, I instead made them the minute hands and had the seconds move down in a parametric curve to create a wave in the background.

The sketch above shows a bit of the process in the form of the clock.

Daniel Teague – Looking Outwards 06 – Randomness

Project name: Random-art.org

Link: http://www.random-art.org/online/

I found this by quite literally searching “random art.” It was one of the first few things to come up. It uses an algorithm to “randomly generate” art based on the title people input. While this isn’t true randomness, it does add a factor of randomness into the mix. I think that’s what I like about this: it has kind of randomness that makes the art meaningful based on what people put into it.

Note: I was unable to obtain a photo or other media item to display on this page. I recommend going to the site for examples of the art.

Sarah Yae Looking Outwards 6 Section B

‘Pier and Ocean’ by Kenneth Martin

‘Pier and Ocean’ by Kenneth Martin was created in 1980. I found this artwork interesting because the lines, although randomly placed, created an artwork with meaning.  Although the lines have a color sequence that is patterned and similar, the placements of the line are random — parallel and intersecting. The artist, Kenneth Martin, was inspired to produce this artwork by an era, called Constructivism. This era focused on abstract art and randomness; his focus in this period of time allowed to create this artwork ‘Pier and Ocean,’ which incorporates abstract placement of the lines and randomness.

More information on the artwork could be found on:

https://www.tate.org.uk/art/artworks/martin-pier-and-ocean-p07743

Lingfan Jiang- Looking Outwards 06

http://color-wander.surge.sh/

The project that I am interested in this week is done by Matt Deslauriers in 2016, called generative art with node.js and canvas. The project created distorted images using the codes.

Here is an example. It transfers the image into the artists’ own style just using codes.

The reason I admire this project is that create a new and unique art style itself is already very interesting. However, I think there are much more opportunities to the project. At the early stage of the project, the artist was only able to convert existing images into this kind of style. However, when the database grows into certain size, it is able to call out a random image by itself, just like the link I added at the beginning of the post. For the next stage, I think the project would be benefited a lot from the machine learning process where the codes could understand and establish links between words and images. To me, that would be the most interesting aspect of the project.

For the algorithm of this project, I would assume that based on the contrast of the image, the codes are able to identify the shapes of the images and use codes to generate random geometries according to the fundamental shapes of the images. Also, it is very wise for the author to use color palettes that are existed from ColourLovers.com API to make his work pleasant to look at.

Here is the original link to the artist’s own page.

https://mattdesl.svbtle.com/generative-art-with-nodejs-and-canvas

Xiaoying Meng-Looking Outwards 06

(Black Shoals Stock Market Planetarium)

Black Shoals is an art project by Joshua Portway and Lise Autogena. The project displays the activities of the stock market as a planetarium. The project uses randomness in a very interesting way. In the beginning, the stars representing each company are randomly distributed. As time passes, the stars start to drift and clog together, moving into constellations. Without the random placement of the stars at the beginning, the relationship and attraction between each star cannot be shown in this way. I admire this project because it turns numeric data of the stock exchange into visually pleasing graphics that can be better understood. I guess the algorithm for this project could be inputting real-time data into graphics and use randomized locations for the beginning.


Project-06-Abstract Clock-Veronica

sketch

/*
Veronica Wang
Section B
yiruiw@andrew.cmu.edu
Project 06
*/

var prevSec;
var millisRolloverTime;

function setup() {
    createCanvas(600, 600);
    millisRolloverTime = 0;
}

function draw() {
    background(30);
    
    // Fetch the current time
    var H = hour();
    var M = minute();
    var S = second();
    
    // Reckon the current millisecond, 
    // particularly if the second has rolled over.
    if (prevSec != S) {
        millisRolloverTime = millis();
    }
    prevSec = S;
    var mils = floor(millis() - millisRolloverTime);
  
    //text label of time  
    noStroke();
    fill('white');
    text("Hour: "   + H, 10, 22);
    text("Minute: " + M, 10, 42);
    text("Second: " + S, 10, 62);
    text("Millis: " + mils, 10, 82);

    
    //hour ellipse and arc
    stroke('gold');
    var hourR = 150;
    var color = 'gold';
    fill(30);
    ellipse(width / 3, height / 3, hourR * 2, hourR * 2);
    timefiller(24, H, width/3, height/3, hourR, color);

    //minute ellipse and arc
    stroke('skyblue');
    var minR = 100;
    color = 'skyblue';
    noFill();
    ellipse(width * 0.45, height * 0.5, minR * 2, minR * 2);
    timefiller(60, M, width * 0.45, height * 0.5, minR, color);

    //second ellipse and arc
    stroke('lightblue');
    var secR = 75;
    color = 'lightblue';
    noFill();
    ellipse(width * 0.6, height * 0.6, secR * 2, secR * 2);
    timefiller(60, S, width * 0.6, height * 0.6, secR, color);

    //milli second ellipse and arc
    stroke('white');
    var milR = 50;
    color = 'white';
    noFill();
    ellipse(width * 0.75, height * 0.6, 100, 100);
    timefiller(1000, mils, width * 0.75, height * 0.6, milR, color);
    
    //function to draw arc based on division of circle
    function timefiller(divNum, currNum, x, y, r, color){
        var incr = 2 * PI / (divNum * 2); //divide circle into increments based on time unit
        var pt2 = currNum * incr + PI / 2; //time increment point on circle
        var pt1 = PI / 2 - currNum * incr; //time increment point on circle
        fill(color);
        arc(x, y, 2 * r, 2 * r, pt1, pt2, OPEN); //draw open arc based on current time increment points
        
    }


}

In this project I decided to represent the abstract clock with a series of circles being filled up. I challenged myself to write a new function for drawing those open arcs and it turned out just the way I intended. I had trouble figuring out the increments and correct elements to make the arc with, but it reminded me of the string art project which helped me a lot with this.

idea sketches