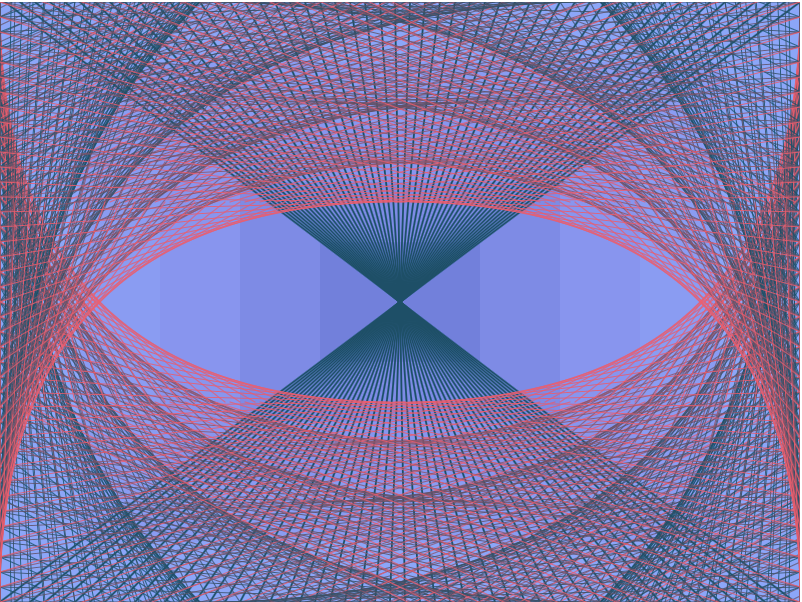
Robert Henke’s audiovisual installation, Spline, uses lasers and computer generated sound to evoke a dreamlike experience.
Robert Henke is an engineer and audiovisual artist from Germany. Using a complex system of physics, lights, and synthesizers, Henke creates surreal installations that feel both futuristic and otherworldly. In his 2017 installation, Spline, he couples lasers with computer generated sounds to emulate patterns reminiscent of astronomical phenomena. Using the Max programming language, Henke has developed his own synthesizers, such as the Granulator II. Operating through “quasi-synchronous granular synthesis,” these instruments allow the user to modify the pitch and volume of grains to create unique sounds. I admire Henke for his ability to transform light, sound, and space using both scientific and artistic methods. The sound he incorporates in his installations are in perfect harmony with the mesmerizing visuals, working together to create an ethereal, omnipresent experience.
/*
Christine Chen
Section E
cyc1@andrew.cmu.edu
Assignment-04-B
*/

function setup() {
    createCanvas(400, 300);
}

function draw() {
    background(136, 164, 255); //background blue

    var increment = 7.5;
    //the smaller the increment it, the denser the lines

    //Blue pyramid-like lines in the center
    for (var a = 0; a < width; a = a + increment) {
        strokeWeight(0.9);
        stroke(0, 80, 105);
        line (a, height, width - a, 0);
    }

    //LEFT LINES
    //rotate
    push();
    translate(width/2, height/2);
    angleMode(DEGREES);
    rotate(90);
    translate(-width/2, -height/2);


    //Left side upper corner
    //counting from outer blue lines to inner red lines
    //1st
    for (var a = 0; a < width; a = a + increment) {
        strokeWeight(0.4);
        stroke(0, 80, 105);
        line (0, a, a, 400);
    }

    //2nd
    for (var a = 0; a < width; a = a + increment) {
        strokeWeight(0.4);
        stroke(50, 80, 105);
        line (0, a, a, 300);
    }

    //3rd
    for (var a = 0; a < width + 100; a = a + increment) {
        strokeWeight(0.4);
        stroke(100, 80, 105);
        line (0, a, a, 250);
    }

    //4th
    for (var a = 0; a < width + 100; a = a + increment) {
        strokeWeight(0.4);
        stroke(150, 80, 105);
        line (0, a, a, 220);
    }

    //5th
    for (var a = 0; a < width + 100; a = a + increment) {
        strokeWeight(0.4);
        stroke(255, 80, 105);
        line (0, a, a, 200);
    }

    //Left side lower corner
    //counting from outer blue lines to inner red lines
    //1st
    for (var a = 0; a < width; a = a + increment) {
        strokeWeight(0.4);
        stroke(0, 80, 105);
        line (width, a, width - a, 400);
    }

    //2nd
    for (var a = 0; a < width; a = a + increment) {
        strokeWeight(0.4);
        stroke(50, 80, 105);
        line (width, a, width - a, 300);
    }

    //3rd
    for (var a = 0; a < width; a = a + increment) {
        strokeWeight(0.4);
        stroke(100, 80, 105);
        line (width, a, width - a, 250);
    }

    //4th
    for (var a = 0; a < width; a = a + increment) {
        strokeWeight(0.4);
        stroke(150, 80, 105);
        line (width, a, width - a, 220);
    }

    //5th
    for (var a = 0; a < width; a = a + increment) {
        strokeWeight(0.4);
        stroke(255, 80, 105); //red line color
        line (width, a, width - a, 200);
    }

    pop();


    //RIGHT LINES
    //rotate
    push();
    translate(width/2, height/2);
    angleMode(DEGREES);
    rotate(270);
    translate(-width/2, -height/2);


    //Right side lower corner
    //counting from outer blue lines to inner red lines
    //1st
    for (var a = 0; a < width; a = a + increment) {
        strokeWeight(0.4);
        stroke(0, 80, 105);
        line (0, a, a, 400);
    }

    //2nd
    for (var a = 0; a < width; a = a + increment) {
        strokeWeight(0.4);
        stroke(50, 80, 105);
        line (0, a, a, 300);
    }

    //3rd
    for (var a = 0; a < width + 100; a = a + increment) {
        strokeWeight(0.4);
        stroke(100, 80, 105);
        line (0, a, a, 250);
    }

    //4th
    for (var a = 0; a < width + 100; a = a + increment) {
        strokeWeight(0.4);
        stroke(150, 80, 105);
        line (0, a, a, 220);
    }

    //5th
    for (var a = 0; a < width + 100; a = a + increment) {
        strokeWeight(0.4);
        stroke(255, 80, 105);
        line (0, a, a, 200);
    }

    //Right side upper corner
    //counting from outer blue lines to inner red lines
    //1st
    for (var a = 0; a < width; a = a + increment) {
        strokeWeight(0.4);
        stroke(0, 80, 105);
        line (width, a, width - a, 400);
         }

    //2nd
    for (var a = 0; a < width; a = a + increment) {
        strokeWeight(0.4);
        stroke(50, 80, 105);
        line (width, a, width - a, 300);
    }

    //3rd
    for (var a = 0; a < width; a = a + increment) {
        strokeWeight(0.4);
        stroke(100, 80, 105);
        line (width, a, width - a, 250);
    }

    //4th
    for (var a = 0; a < width; a = a + increment) {
        strokeWeight(0.4);
        stroke(150, 80, 105);
        line (width, a, width - a, 220);
    }

    //5th
    for (var a = 0; a < width; a = a + increment) {
        strokeWeight(0.4);
        stroke(255, 80, 105); //red line color
        line (width, a, width - a, 200);
    }

    pop();
}
I think this project is particularly hard because it is so difficult to visualize what your codes are going to draw. However, once I got a part of my lines to work, it was easier to plan out what I want to create with the part I had. After playing around with my strings for a while, I finally settled with this piece where the left and right strings wraps around the middle to emphasize the forms of the pyramid-like strings in the center. Having the wrapping strings at the top and bottom isn’t as visually interesting and having the wrapping strings on four sides is just too much.
var x; //increment variable for width for bottom curves
var y; //increment variable for height for bottom curves
var a; //increment variable for width for top curves
var b; //increment variable for height for top curves
var angleIncrement; //location for where to draw line in circle
var r; //radius of the center strings forming circle

function setup() {
    createCanvas(400, 300);
}

function draw() {
    background(0);
    x = width / mouseX * 5;
    y = height / mouseY * 5;
    a = width / mouseY * 10;
    b = height / mouseX * 10;
    angleIncrement = mouseX / 100;
    r = width;

    //center circle
    if (mouseIsPressed) {
        for(var angle = 0; angle < 360; angle += mouseX / 100) {
            stroke(0, 0, 255);
            push();
            translate(width / 2, height / 2);
            line((r * sin(angle)) / tan(angle),
                  r * sin(angle),
                  r * sin(angle + angleIncrement) / tan(angle + angleIncrement),
                  r * sin(angle + angleIncrement));
            pop();
        }
    }

    //drawing the four curves on each corner of the canvas
    for(var i = 0; i < 50; i ++) {
        strokeWeight(1);

        //draws the first 20 red lines on the bottom left corner
        //draws green lines for the rest
        if (i >= 30) {
            stroke(0, 255, 0);
            line(0, y * i, x * i, height);
        }else {
            strokeWeight(1);
            stroke(i * 30, 0, 0);
            line(0, y * i,  (x * i), height);
        }

        //red on bottom right hand side
        //stroke(255,0,0);
        stroke(i * 15, 0, 0);
        line(width, y * i, width - (x * i), height);

        //color changing curves on top
        stroke(mouseX, 0, 255);
        line(0, height - (a * i), b * i, 0);
        line(width - (b * i), 0, width, height - (a * i));
    }
}
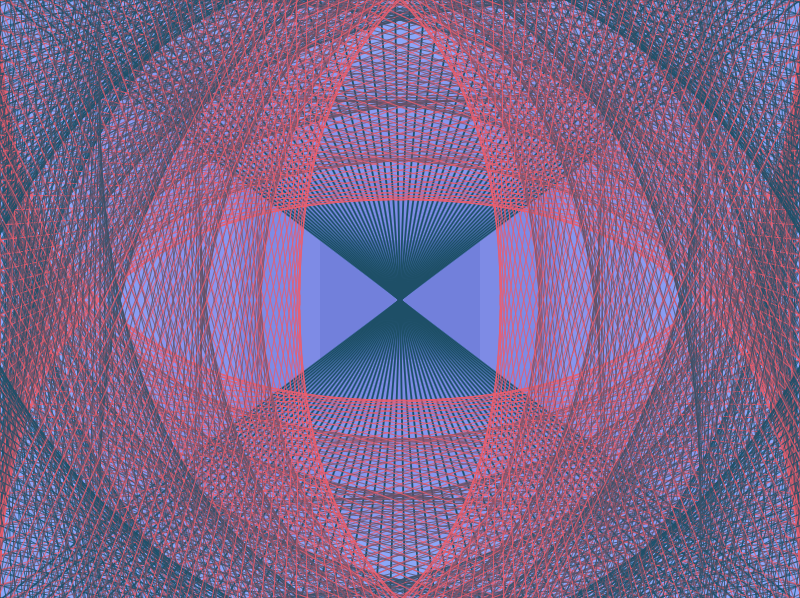
I first started out making the most basic curve. After that, I began building symmetries and color changes into the code to make it more interactive and fun. Figuring out the circle took me a while since I haven’t touched math ever since junior year in high school, but the result was rewarding and I had a lot of fun doing so.
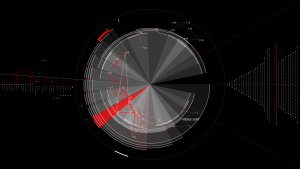
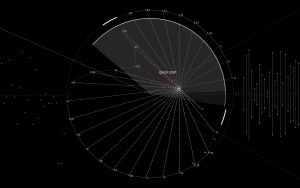
Sorting is a visualization and sonification project created by Ren Yuan. It is based on 31 algorithms and made using Processing. Basically it allows the viewer to see how the data is sorted and made audible by seven sorting algorithms. They are insertion sort, shell sort, bubble sort, quick sort, selection sort, heap sort and merge sort. This project is very interesting and visually compelling. I love how Ren uses pattern and algorithm to make sorting a list of data on a black and white screen to a piece of digital art that really catches people’s attention. I might not know this project’s performance criteria. But as an art piece, it is successful.
/* Jenna Kim (Jeeyoon Kim)
Section E
jeeyoonk@andrew.cmu.edu
Project 04
*/

function setup() {
    createCanvas(400, 300);
    var fishX;
	var fishY;
	var fishH;
	var fishW;
}

function draw() {
	background(100,149,237);
	fishX = 150;
    fishY = 140;
    fishH = 50;
    fishW = 100;

    noStroke(0);
    fill(100, 200, 300); //tail
    triangle(fishX + fishW - 10, fishY, fishX + fishW + 50, fishY - 30, fishX + fishW + 50, fishY + 30);
    fill(102, 196, 184) // body of the fish
    ellipse(fishX + fishW / 2, fishY, fishW, fishH);
    fill(0); //eye
    ellipse(fishW * 1 / 5 + fishX, fishY - 10, 10, 10);

	var x1 = 1;
	var x2 = 10;
	var x3 = 0;
	var x4 = 40;
	var y1 = 1;
	var y2 = 3;
	var y3 = 30;
	var y4 = 80;

	// bottom LEFT
	for (var i = 0; i < width / 3; i ++){
		x1 += 30;
		y1 += 10;
		strokeWeight(1);
		stroke(10, 100, 132 );
		fill(0, 0, 0);
		line(i, y1, x1, height);

		x1 += 1;
		y1 += 3;
	}
	// top RIGHT
	for (var a = 0; a < width / 3; a ++){
		x2 += 10;
		y2 += 10;
		strokeWeight(1);
		stroke(255, 0, 0);
		line(width - a, y2 , x2, 1);

		x2 += 6;
		y2 += 5;
	}
	// top LEFT
	for (var b  = 0; b < height / 2; b ++){
		x3 += 15;
		y3 += 5;
		strokeWeight(1);
		stroke(255, 255, 255);
		line(b, height - y3, x3, 1);

		x3 += 6;
		y3 += 5;
	}
	// bottom RIGHT (SHIP LIGHT***)
	for (var f  = 0; f < height / 2; f ++){
		x4 += 5;
		y4 += 30;
		strokeWeight(1);
		stroke(255, 255, 0);
		line(f, height, x4, y4);

		x4 -= 1;
		y4 -= 30;
	}
	textSize(15);
	fill(250, 250, 250);
	text('quiz fishy', 170, 180)

}
Through this project, I learned how each variable works with each other to create curves. I know learning about the string art will be very useful for future media art projects (like the ones from Lunar Gala last year).
This project was not one of my favorites, as I missed a few of the classes on for() function and had to do more in depth learn-by-doing. I also just don’t think string art is super attractive. HOWEVER, now that I know the for() function I can definitely think of other uses for it, as incrementation is really helpful and can also simplify some tedious coding.
/* Jaclyn Saik
Section E
jsaik@andrew.cmu.edu
Project-04
*/
var x1; //global values for all points that create curves
var y1;
var x2;
var y2;
var increment;
var rectW;
var rectH;

function setup() {
    createCanvas(400, 300);
    background("RosyBrown");
    strokeWeight(2);
    increment = 15;
    increment = random(5, 9); //resets spacing everytime you refresh the page


}

function draw() {
    stroke("Pink");

//top right swoop
    for(var i = 0; i < width; i+= increment) { //increment variable set so I can randomize it
        x1 = width; //starting points incrementing along right edge
        y1 = i; //increments
        x2 = i; //paired with fized width to create curves
        y2 = 0; //i is paired with zero to create curves
        line(x1, y1, x2, y2);
    }
//bottom left swoop
    for(var i = 0; i < height; i+= increment) {
        x1 = i; //values flipped in order to create different curve location
        y1 = height;
        x2 = 0;
        y2 = i;
        line(x1, y1, x2, y2);
    }
//purple rectangle
    noFill(); //created a rectangle in front of the background pink curves
    stroke("DarkMagenta");
    rectW = 280;
    rectH = 220;
    rect(60, 40, rectW, rectH);

    //rectangle swoop bottom right
    push();
    translate(60, 40); //new axis for creatign curves
    for(var i = 0; i <= rectH; i+= increment) {
        x1 = i;
        y1 = rectH;
        x2 = rectW;
        y2 = rectH-i; //new curve position, so increments work opposite based on starting height
        //another option would have been to rotate the origin
        line(x1, y1, x2, y2);
    }
    pop(); //push pop used because I translated the origin

    //rectangle swoop upper left
    push();
    translate(60, 40);
    for(var i = 0; i <= rectH; i+= increment) {
        x1 = rectW-i;
        y1 = 0;
        x2 = 0;
        y2 = i;
        line(x1, y1, x2, y2);
    }
    pop();


    //blue rectangle

    noFill();
    stroke("DarkTurquoise");
    rectW = rectW-40
    rectH = rectH-40
    rect(60, 40, rectW, rectH);

    //rectangle swoop bottom right
    push();
    translate(60, 40);
    for(var i = 0; i <= rectH; i+= increment) {
        x1 = i;
        y1 = rectH;
        x2 = rectW;
        y2 = rectH-i;
        line(x1, y1, x2, y2);
    }
    pop();

    //rectangle swoop upper left
    push();
    translate(60, 40);
    for(var i = 0; i <= rectH; i+= increment) {
        x1 = rectW-i;
        y1 = 0;
        x2 = 0;
        y2 = i;
        line(x1, y1, x2, y2);
    }
    pop();

    //design lines
    stroke("AliceBlue");
    line(0,0, width/2, height)
    line(0, 0, width, height/2);
    line(width, height, 0, height/2);
    line(width, height, width/2, 0);

    //gold rectangle

    noFill();
    stroke("Gold");
    rectW = rectW-40
    rectH = rectH-40
    rect(60, 40, rectW, rectH);

    //rectangle swoop bottom right
    push();
    translate(60, 40);
    for(var i = 0; i <= rectH; i+= increment) {
        x1 = i;
        y1 = rectH;
        x2 = rectW;
        y2 = rectH-i;
        line(x1, y1, x2, y2);
    }
    pop();

    //rectangle swoop upper left
    push();
    translate(60, 40);
    for(var i = 0; i <= rectH; i+= increment) {
        x1 = rectW-i;
        y1 = 0;
        x2 = 0;
        y2 = i;
        line(x1, y1, x2, y2);
    }
    pop();


}
Creating string art was a challenging process, especially after translating the origin of my piece around a couple times to experiment. This was definitely an exercise in understanding the coordinate system enough to assign opposing values to the ends of points. I liked playing with the foreground and background of my curves, and I thought it was definitely one the prettiest projects we have made so far.
//Jenny Hu
//Section E
//jjh1@andrew.cmu.edu
//Project 04 — String Art

var R1;
var R2;
var R3;
var R4;
var G1;
var G2;
var G3;
var G4;
var B1;
var B2;
var B3;
var B4;


function setup() {
    createCanvas(400, 300);
}

function draw() {
    background (250);

    //Draw first curve
    for ( var i=0; i<100; i++){
      stroke(R1, G1, B1);
      strokeWeight(1);
      line(i, 0 , i*5, height/2);
    }

    //Draw second curve
    for ( var i=0; i<200; i++){
      stroke(R2, G2, B2);
      strokeWeight(0.5);
      line(i*25, 300-height/2, i*mouseX, 300);
    }

    //Draw third curve
    for ( var i=0; i<100; i++){
      stroke(R3, G3, B3);
      strokeWeight(0.75);
      line(400-i*10, 0, i*15, 300);
    }

    //Draw fourth curve
    for ( var i=0; i<100; i++){
      stroke(R4, G4, B4);
      strokeWeight(0.5);
      line(400-i*(mouseX*0.5), 0, i*15, 300);
    }
  }

  function mousePressed(){
      // //variable stroke colors
      R1 = random(0,250);
      G1 = random(0,250);
      B1 = random(0,250);
      R2 = random(0,250);
      G2 = random(0,250);
      B2 = random(0,250);
      R3 = random(0,250);
      G3 = random(0,250);
      B3 = random(0,250);
      R4 = random(0,250);
      G4 = random(0,250);
      B4 = random(0,250);
  }
In this project, I iterated some simple for-loops for each curve. In some cases, dynamic to the mouse’s X position, and in other cases, static. I think what’s nice about the movement is that it’s a dynamic set of strings, tied to a static set, which creates a satisfying connection between their visual elements and rhythm!
This time I didn’t dabble as much in composition before writing the program, instead, I really enjoyed seeing the composition emerge as I played with the numbers. Another nice touch which makes the interactions a bit more satisfying is the additional randomized color sets.
function setup() {
    createCanvas(400, 300);
}

var ratio = 0.75; // width to height ratio
var radius = 400; // length of radiating center lines

function draw() {
    background(47,19,116);
    // circles:
    // outer circle
    fill(244, 96, 54);
    noStroke();
    ellipse(width / 2, height / 2, 300, 300);
    // middle circle
    fill(245, 110, 72);
    noStroke();
    ellipse(width / 2, height / 2, 150, 150);
    // inner circle
    fill(246, 124, 90);
    noStroke();
    ellipse(width / 2, height / 2, 50, 50);

    // lines:
    // center radial
    for (var a = 0; a < 360; a += 10) {
      stroke(255, 249, 104);
      line(width / 2, height / 2,
        // trig uses var radius as hypotenuse
        width / 2 + radius * cos(radians(a)),
        height / 2 + radius * sin(radians(a)));
    }
    // bottom left corner
    for (var b = 0; b < width; b += 7) {
      stroke(66, 51, 227);
      line(0, b, b / ratio, height);
    }
    // top left corner
    for (var c = 0; c < width; c += 7) {
      stroke(30, 81, 221);
      line(0, c, width - c / ratio, 0);
    }
    // top right corner
    for (var d = 0; d < width; d += 7) {
      stroke(66, 51, 227);
      line(width, d, d / ratio, 0);
    }
    // bottom right corner
    for (var e = 0; e < width; e += 7) {
      stroke(30, 81, 221);
      line(width, e, width - e / ratio, height);
    }
}
It took me a while to catch on, but I hit one good curve and used it to figure out the others. I played around with difference colour schemes and decided to go with a sun, stars, and space theme from there.
/* Dani Delgado
Section E
ddelgad1@andrew.cmu.edu
Project-04
*/
function setup() {
    createCanvas(400, 300);
    background(10);

}
function draw() {
	//draw the sixth layer of lines (brownish black lines)
	//these lines are on the "inside" of all other line layers (its the lowest layer)
    for(var g = 0; g < 1.5 ; g += 0.09) {
	    //set the stroke style
		strokeWeight(0.2);
		stroke(35, 19, 0);
		//determine the lerp values
		x1 = lerp(0, width / 2.15, g);
        y1 = lerp(0, height * 2.15, g);
        x2 = lerp(width * 2.15, 0, g);
        y2 = lerp(height / 2.15, 0, g);
        //draw the curves
		line(x1, 0, width, y1);
		line(x2, height, 0, y2);
		line(x1, height, width, y2);
		line(x2, 0, 0, y1);
    }
	//draw the fifth layer of lines (brown lines)
	//these lines are on the "inside" the above layers of lines
	for(var f = 0; f < 1.4 ; f += 0.08) {
	    //set the stroke style
		strokeWeight(0.3);
		stroke(51, 34, 0);
		//determine the lerp values
		x1 = lerp(0, width / 1.9, f);
        y1 = lerp(0, height * 1.9, f);
        x2 = lerp(width * 1.9, 0, f);
        y2 = lerp(height / 1.9, 0, f);
        //draw the curves
		line(x1, 0, width, y1);
		line(x2, height, 0, y2);
		line(x1, height, width, y2);
		line(x2, 0, 0, y1);
    }
   //draw the fourth layer of line (dark orange lines)
   //these lines are "inside" the above layer of lines
    for(var e = 0; e < 1.3; e += 0.07) {
		//set the stroke style
		strokeWeight(0.4);
		stroke(102, 68, 0);
		//determine the lerp values
		x1 = lerp(0, width / 1.75, e);
        y1 = lerp(0, height * 1.75, e);
        x2 = lerp(width * 1.75, 0, e);
        y2 = lerp(height / 1.75, 0, e);
        //draw the curves
		line(x1, 0, width, y1);
		line(x2, height, 0, y2);
		line(x1, height, width, y2);
		line(x2, 0, 0, y1);
    }
    //draw the third layer of lines (medium orange lines)
    //these lines are "inside" the above layer of lines
    for(var d = 0; d < 1.2; d += 0.06) {
		//set the stroke style
		strokeWeight(0.6);
		stroke(204, 136, 0);
		//determine the lerp values
		x1 = lerp(0, width / 1.5, d);
        y1 = lerp(0, height * 1.5, d);
        x2 = lerp(width * 1.5, 0, d);
        y2 = lerp(height / 1.5, 0, d);
        //draw the curves
		line(x1, 0, width, y1);
		line(x2, height, 0, y2);
		line(x1, height, width, y2);
		line(x2, 0, 0, y1);
	}
	//draw the second layer of lines (light orange lines)
	//these lines are "inside" of the abvoe layer of lines
	for(var c = 0; c < 1.1; c += 0.05) {
		//set the stroke style
		strokeWeight(0.8);
		stroke(255, 204, 102);
		//determine the lerp values
		x1 = lerp(0, width / 1.5, c);
        y1 = lerp(0, height, c);
        x2 = lerp(width * 1.5, 0, c);
        y2 = lerp(height, 0, c);
        //draw the curves
		line(x1, 0, width, y1);
		line(x2, height, 0, y2);
		line(x1, height, width, y2);
		line(x2, 0, 0, y1);
	}
	//draw the uppermost line set (creme colored lines)
	//the first line set will curve the corners
	for(var i = 0; i < 1; i += 0.04) {
		//set the stroke style
		strokeWeight(1);
	    stroke(250, 240, 220);
	    //determine the lerp variables
        x1 = lerp(0, width, i);
        y1 = lerp(0, height, i);
        x2 = lerp(width, 0, i);
        y2 = lerp(height, 0, i);
        //draw the curves
		line(x1, 0, width, y1);
		line(x2, height, 0, y2);
		line(x1, height, width, y2);
		line(x2, 0, 0, y1);
}

}
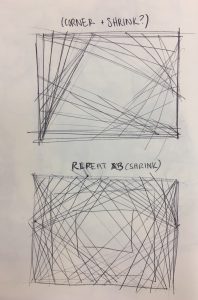
Some initial concept sketches to decide how I wanted to place the lines
Since this is my first experience with for loops (outside of the other class assignments), I found this to be very challenging since I first had to solidify the conceptual aspect of the code before I could begin to work on the physical coding. Once I got into the groove of it though I had fun with the assignment!
![[OLD FALL 2018] 15-104 • Introduction to Computing for Creative Practice](../../../../wp-content/uploads/2020/08/stop-banner.png)