John Legelis Project-04 String Art

sketch

// John Legelis

function setup() {
    createCanvas(400, 300);
    background(0);
}

function draw() {

    // Set size of square 
    var size
    size = 100

    // Itterate rows and columns of squares
    for(s = 0; s < (width/size); s++) {
        for(d = 0; d < (height/size); d++) {
            // Width and height of the square are the same making it an actual square
            square(s*size, d*size, size, size)
        }
    }    
}


// Stop changing colors when mouse is held down
function mousePressed() {
    noLoop()
}

// Resume changing colors when mouse is released
function mouseReleased() {
    loop()
}

// Function that draws line square given top left x,y and width,height
function square(lx, ty, w, h) {
    
    // Insert parameters into variables
    var width
    width = w
    var height
    height = h

    var leftX
    leftX = lx
    var rightX
    rightX = leftX + width
    var topY
    topY = ty
    var bottomY
    bottomY = topY + height

    // Loop through to make lines
    for (i = 0; i <= width; i = i + 5) {

        //Line-1 X,Y coordinates for beginning and end
        var l1xb
        l1xb = leftX
        var l1yb
        l1yb = topY + i  
        var l1xe
        l1xe = leftX + i
        var l1ye
        l1ye = bottomY

        //Line-2 X,Y coordinates for beginning and end
        var l2xb
        l2xb = leftX + i
        var l2yb
        l2yb = bottomY  
        var l2xe
        l2xe = rightX
        var l2ye
        l2ye = bottomY - i

        //Line-3 X,Y coordinates for beginning and end
        var l3xb
        l3xb = rightX
        var l3yb
        l3yb = bottomY - i  
        var l3xe
        l3xe = rightX - i
        var l3ye
        l3ye = topY

        //Line-4 X,Y coordinates for beginning and end
        var l4xb
        l4xb = leftX
        var l4yb
        l4yb = topY + i  
        var l4xe
        l4xe = rightX - i
        var l4ye
        l4ye = topY

        //draw lines with random greyscale color from black to white 
        stroke(random(0,255))
        
        line(l1xb, l1yb, l1xe, l1ye)
        line(l2xb, l2yb, l2xe, l2ye)
        line(l3xb, l3yb, l3xe, l3ye)
        line(l4xb, l4yb, l4xe, l4ye)
    }

}

[Note: original submission was either sketch-347.js or sketch-342.js. I swapped in sketch-364.js with minor edits to work around a pt-embed limitation. -RBD]

I found this project rather intuitive and easy to implement using a for loop which iterated x and y values incrementally for the endpoints of the lines. I liked the textured effect the randomized line shading created. The lines stop changing colors when the mouse is pressed amd resume when released.

Lingfan Jiang – Project 04 – String Art

lingfanj-04

//Lingfan Jiang
//Section B
//lingfanj@andrew.cmu.edu
//Project-04


var dx; //x coordinate for points on curve
var dy; //y coordinate for points on curve
var circleDiameter; //diameter of the center circle


function setup(){
    createCanvas (400, 300);

}

function draw(){
    background(0);
    angleMode(DEGREES);
    strokeWeight(0.1); //set a lineweight for the bottom curves
    circleDiameter = 75;


    stroke(255,104,107); //red lines
    for (var x = 0; x < 95; x += 5) {
        dx = 200 + (circleDiameter * cos(x));
        dy = 150 + (circleDiameter * sin(x));
        //connect first quarter of the points on the circle with the points on the top
            for (var i = 0; i < 400; i += 5){
            line(i,0,dx,dy);  
        }
    }
    strokeWeight(0.08);
    stroke(27,179,244); //light blue lines
    for (var x = 90; x < 275; x += 5) {
        dx = 200 + (circleDiameter * cos(x));
        dy = 150 + (circleDiameter * sin(x));
        //connect half quarter of the points on the circle with the points on the left
            for (var i = 0; i < 300; i += 5){
            line(0,i,dx,dy);  
        }
    }
    strokeWeight(0.05);
    stroke(0,40,255); // dark blue lines
    for (var x = 180; x < 275; x += 5) {
        dx = 200 + (circleDiameter * cos(x));
        dy = 150 + (circleDiameter * sin(x));
        //connect quarter of the points on the circle with the points on the bottom
            for (var i = 0; i < 400; i += 5){
            line(i,300,dx,dy);  
        }
    }
    stroke(143,113,255);
    strokeWeight(0.04); // purple lines
    for (var x = 270; x < 455; x += 5) {
        dx = 200 + (circleDiameter * cos(x));
        dy = 150 + (circleDiameter * sin(x));
        //connect half quarter of the points on the circle with the points on the right
            for (var i = 0; i < 300; i += 5){
            line(400,i,dx,dy);  
        }
    }

    noLoop();
}

In this project, I had some difficulties to picture the final form at first. However, after looking through some of the string art examples, I became particularly interested in the circle from. Different from architectural modeling software, you cannot evaluate curves and find points on them. Therefore, the coordinates of the points that form a circle gave me a little bit of trouble. After understanding how “cos” and “sin” could help form it, here is the final result.

Austin Treu – Looking Outwards-04

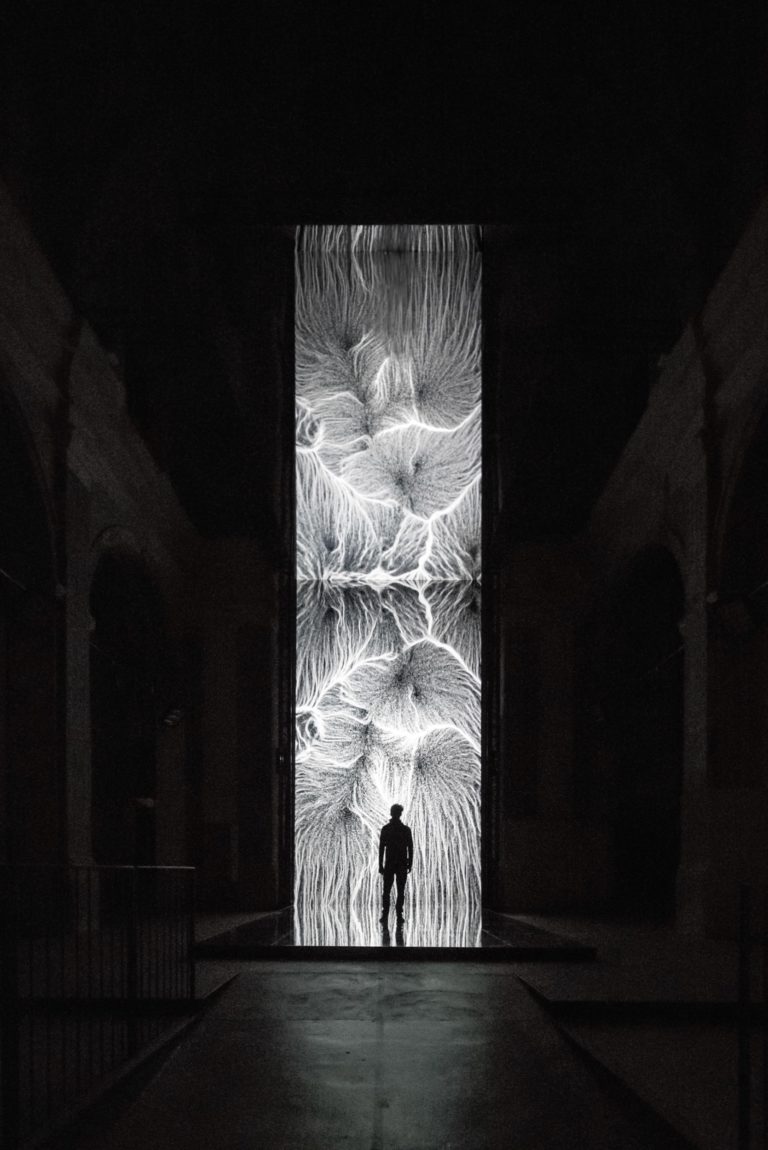
Multiverse by fuse* is a fascinating project including both generative graphics and sound. It utilizes the Multiverse Theories of physicist Lee Smolin that say that universes create new universes as opposed to collapsing into singularity as inspiration in that a new ‘universe’ begins every thirty minutes and inherits certain attributes from its ‘parent universe’ and those before it. The synthesized sound and constantly changing visuals invoke a sense of wonder about the cosmos and what is really out there. The division and consolidation that happen on the display symbolize the constant change that the Multiverse goes through, which is an incredible visual representation of something outside of our human grasp of space-time. One of the most interesting parts of the project that goes on under the hood is a direct interaction between openFrameworks and Ableton Live, which means that the sound and visuals are actually generated in tandem with one another, so, while each ‘universe’ is unique, it has matching visuals and sound that would match again under the exact same conditions. I am not only impressed by the wild physics of the modern day, I am impressed by this fantastic representation of it.

The following video is a three minute demonstration of the project.

Austin Treu – Project 04 – String Art

atreu – project04

//Austin Treu
//atreu
//Project 04
//Section C

var x1, y1, x2, y2;

function setup() {
    createCanvas(400, 300);
    background(0);

    //for loop to generate points and draw lines
    for(var i = 0; i < 100; i++){
        //new points
        x1 = lerp(width,0, i/100);
        y1 = lerp(0,height, i/100);
        x2 = lerp(0,width, i/50);
        y2 = lerp(height,0, i/50);
        //draw red lines
        stroke(255, 0, 50);
        line(x1, height/i, 0, y1);
        line(width-x1, height/i, width,y1);

        //generate points
        x1 = lerp(width/2,0, i/100);
        y1 = lerp(height/2,0, i/100);
        x2 = lerp(width/2,0, i/50);
        y2 = lerp(height,0, i/50);
        //draw blue lines
        stroke(50, 0, 255);
        line(x1, y1, x2, y2);
        line(x2, y1, x1, y2);
        line(width-x1, y1, width-x2, y2);
        line(width-x2, y1, width-x1, y2)

        //generate new points
        x1 = lerp(width/i,width, i/100);
        y1 = lerp(height/i,height, i/100);
        x2 = lerp(0,width, i/75);
        y2 = lerp(0,height, i/75);
        //draw yellow lines
        stroke(175, 150, 0);
        line(x2, y2, x1, height);
        line(width-x2, y2, width-x1, height);

        //new points
        x1 = lerp(0,width/2, i/100);
        y1 = lerp(0,height/2, i/100);
        x2 = lerp(0,width-width/7.5, i/200);
        y2 = lerp(0,height/2, i/200);
        //draw green lines
        stroke(0, 255, 150);
        line(x2, y2, x1, y1);
        line(width-x2, y2, width-x1, y1);
    }
}

Learning how to properly utilize lerp() was an interesting process to experiment with, as it offered a huge variety of different options once I understood. I spent the time I worked on this completely focused on making it symmetrical, which changed my focus throughout the project.

Xindi Lyu-Project 04-String art-Section A

sketch

 /*Xindi Lyu
 Section A
 xindil@andrew.cmu.edu
 project_04*/
 function setup() {
     createCanvas(400, 300);
     background(240);
}

 function draw() {
     background(240);
    
     var c=5;


      //background
      for(var b=0; b<150; b+=c){
        strokeWeight(0.5);
    stroke(120,200,230);
    line(400,b,4/3*b,0);//top-right corner
    stroke(200,200,230);
    line(0,b,400-4/3*b,0);//top-left corner
    stroke(130,170,170);
    line(400,300-b,4/3*b,300);//bottom-right corner
    stroke(250,170,170);
    line(0,300-b,400-4/3*b,300);//bottom left corner
   }


     for(var a=50; a<200; a+=c){
      strokeWeight(0.5);
      stroke(100,80,150);
      line(a,-4*a/3+850/3,a+150,4*a/3-150/3);//top of the triangle
      stroke(150,70,120);
      line(a+150,4*a/3-150/3,400-a,215);//the bottom-right corner of the triangle


 }
for(var a=50; a<200; a+=c){
      strokeWeight(0.5);
      stroke(100,80,150);
      line(a,4*a/3+50/3,a+150,-4*a/3+1000/3);//the btop part of the up-side-down triangle
      stroke(150,70,120);
      line(a,4*a/3+50/3,250-a,82);//the bottom left part of the -upside down triangle
      
      
    }


 }


For this project I experimented with line weights as well as the elegance of cooperating curves with sharper angles, and also symmetry and asymmetries.

Sharon Yang Project 04 String Art

Project 04

/*Sharon Yang
Section C
junginny
Project-04
*/

function setup() {
    createCanvas(400, 300);
}

function draw() {
    background(255);
    var x1;
    var x2;
    var y1;
    var y2;
    var colorLR = 20;
    var colorLG = 45;
    var colorLB = 80;
    //Left curve
    x1 = 0;
    x2 = 0;
    y1 = 0;
    y2 = 0;
    push();
    for (var jL = 1;jL <= 100; jL+=1) {
        translate(jL,jL);
        strokeWeight(1-(jL/20));
        stroke(colorLR,colorLG,colorLB);
        for (var iL = 1;iL <= 50; iL+=2.8) {
            x2 = iL*8;
            y1 = iL*6;
            line(x1-jL,height-y1-jL,x2-jL,y2-jL);
        }
    //Change color value - gradient
    colorLR+=10;
    colorLG+=10;
    colorLB+=10;
    }
    pop();
    //Right curve - resetting variables
    x1 = 0;
    x2 = 0;
    y1 = 0;
    y2 = 0;
    colorLR = 25;
    colorLG = 50;
    colorLB = 90;
    push();
    for (var jR = 1;jR <= 100; jR+=1) {
        translate(-jR,jR);
        strokeWeight(1-(jR/20));
        stroke(colorLR,colorLG,colorLB);
        for (var iR = 1;iR <= 50; iR+=2.8) {
            x1 = iR*8;
            y2 = iR*6;
            line(x1,0,width,y2);
        }
    //Change color value - gradient
    colorLR+=10;
    colorLG+=10;
    colorLB+=10;
    }
    pop();
}

Using for loops to create various lines to put them together into a harmonious art piece helped me explore the order in for loops and/or nested for loops. I played with the stroke weights as well as the colors to create an effect of a gradient.

Julie Choi – Looking Outwards – 04

Above shows the MULTIVERSE, the eternal birth and death of infinite parallel universes.

This project, Multiverse is an embodiment of the concept of “a system composed of an infinite number of universes that coexist simultaneously outside of our space-time.” Derived from the multiverse theory presented by Lee Smolin, this art piece fuses both audio and visual to generate a live experience of a narrative context. Multiverse was built through a program called openFrameworks that assimilates a continuous slide of digitally created photographs that displays a realistic series of evolutions of the multiverse. The photographs are generated with a soundtrack from the interaction of the visual elements. In the photographs, small unidentifiable particles continuously merge and separate forming bigger particles.

The vertical projection is 7.5 meters tall and has a mirror on the ceiling for a dramatic experience.

This art is displayed in a pitch black room that centers the focus only on the project. When the audiences stand in front of the vertical projection that is 7.5 meters tall, they are able to witness the art of creation.

KadeStewart-LookingOutwards-04


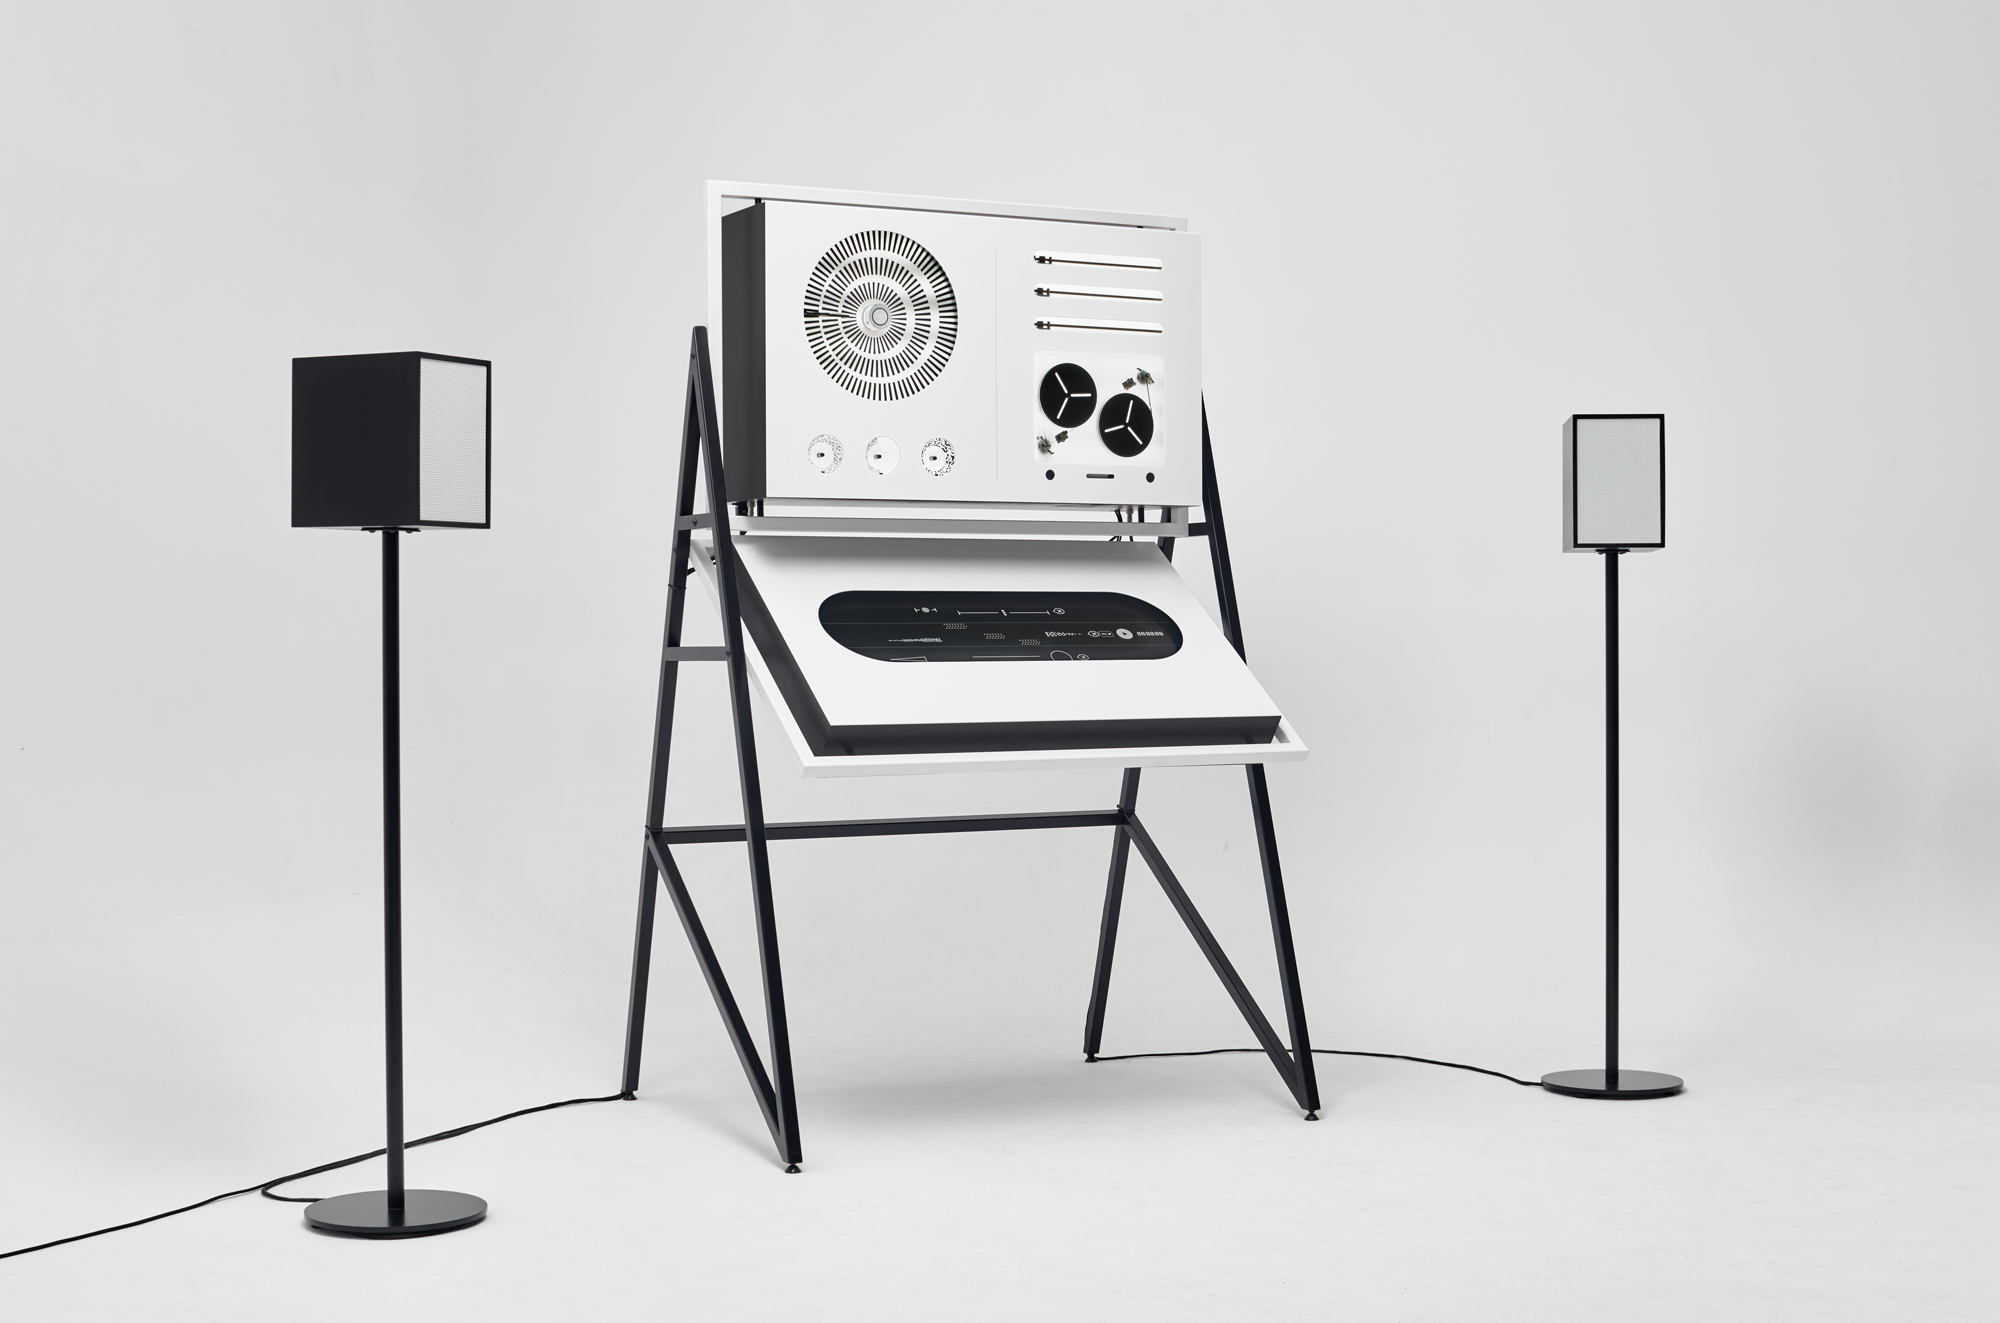
Apparatum, a project created by panGenerator, is an “apparatus” that allows a user to create analog sounds via a digital interface. It’s a callback to one of the first studios to create analog sound, the Polish Radio Experimental Studio. With a description in words, the machine sounds completely unattractive; however, seeing Apparatum and hearing the sounds it produces will give you a completely different sense. The appearance is interesting, the interface is simple (albeit a little abstract), and the sounds are amazingly diverse.

The generation of the sounds, or rather, the movement of the parts in the apparatus are controlled in length by choosing the corresponding widget and elongating its width. The algorithms for this would probably track the width of the widget and translate that to a certain length of time to move the part associated with the widget. While not the most advanced, even useful, application, there is a clear and close relationship between the user’s digital input and Apparatum’s analog output.

Apparatum Project

Jacky Tian’s Project 03

sketch

var unit = 50
var angle = 0
function setup() {
    createCanvas(640, 480);
    
}


function draw() {
    background(mouseX * 0.5, 70, 120);

    var len = 480 - mouseX
    var sta = 640 - mouseY 
    
    strokeWeight(4)
    stroke(170, mouseX * 0.1, 50);
    line(unit, sta * 0.1, unit, len);

    strokeWeight(4)
    stroke(170, mouseX * 0.2, 50);
    line(unit * 2, sta * 0.2, unit * 2, len);

    strokeWeight(4)
    stroke(170, mouseX * 0.3, 50);
    line(unit * 3, sta * 0.3, unit * 3, len);

    strokeWeight(4)
    stroke(170, mouseX * 0.4, 50);
    line(unit * 4, sta * 0.4, unit * 4, len);

    strokeWeight(4)
    stroke(170, mouseX * 0.5, 50);
    line(unit * 5, sta * 0.5, unit * 5, len);

    strokeWeight(4)
    stroke(170, mouseX * 0.6, 50);
    line(unit * 6, sta * 0.6, unit * 6, len);

    strokeWeight(4)
    stroke(170, mouseX * 0.7, 50);
    line(unit * 7, sta * 0.7, unit * 7, len);

    strokeWeight(4)
    stroke(170, mouseX * 0.8, 50);
    line(unit * 8, sta * 0.8, unit * 8, len);

    strokeWeight(4)
    stroke(170, mouseX * 0.9, 50);
    line(unit * 9, sta * 0.9, unit * 9, len);

    strokeWeight(4)
    stroke(170, mouseX, 50);
    line(unit * 10, sta, unit * 10, len);

    strokeWeight(4)
    stroke(170, mouseX * 1.1, 50);
    line(unit * 11, sta * 1.1, unit * 11, len);

    strokeWeight(4)
    stroke(170, mouseX * 1.2, 50);
    line(unit * 12, sta * 1.2, unit * 12, len);

    strokeWeight(4)
    stroke(170, mouseX * 1.3, 50);
    line(unit * 13, sta * 1.3, unit * 13, len);

    strokeWeight(2)
    stroke(70, mouseX * 0.1, mouseY* 0.1);
    line(unit + 25, sta * 0.1, unit, len);

    strokeWeight(2)
    stroke(70, mouseX * 0.2, mouseY* 0.15);
    line(unit * 2 + 25, sta * 0.2, unit * 2, len);

    strokeWeight(2)
    stroke(70, mouseX * 0.3, mouseY* 0.2);
    line(unit * 3 + 25, sta * 0.3, unit * 3, len);

    strokeWeight(2)
    stroke(70, mouseX * 0.4, mouseY* 0.25);
    line(unit * 4 + 25, sta * 0.4, unit * 4, len);

    strokeWeight(2)
    stroke(70, mouseX * 0.5, mouseY* 0.3);
    line(unit * 5 + 25, sta * 0.5, unit * 5, len);

    strokeWeight(2)
    stroke(70, mouseX * 0.6, mouseY* 0.35);
    line(unit * 6 + 25, sta * 0.6, unit * 6, len);

    strokeWeight(2)
    stroke(70, mouseX * 0.7, mouseY* 0.4);
    line(unit * 7 + 25, sta * 0.7, unit * 7, len);

    strokeWeight(2)
    stroke(70, mouseX * 0.8, mouseY* 0.45);
    line(unit * 8 + 25, sta * 0.8, unit * 8, len);

    strokeWeight(2)
    stroke(70, mouseX * 0.9, mouseY* 0.5);
    line(unit * 9 + 25, sta * 0.9, unit * 9, len);

    strokeWeight(2)
    stroke(70, mouseX, mouseY* 0.55);
    line(unit * 10 + 25, sta, unit * 10, len);

    strokeWeight(2)
    stroke(70, mouseX * 1.1, mouseY* 0.6);
    line(unit * 11 + 25, sta * 1.1, unit * 11, len);

    strokeWeight(2)
    stroke(70, mouseX * 1.2, mouseY* 0.65);
    line(unit * 12 + 25, sta * 1.2, unit * 12, len);

    strokeWeight(2)
    stroke(70, mouseX * 1.3, mouseY* 0.7);
    line(unit * 13 + 25, sta * 1.3, unit * 13, len);

    fill(120, 80, mouseX * 0.5); // control rect color explicitly
    stroke(0);
    push();
    translate(mouseX, mouseY);
    rotate(radians(angle));
    rectMode(CENTER); // center rect around 0,0
    rect(0, 0, 50, 50);
    pop();
    angle = angle + mouseX * 0.05;


}

For this project, the 4 dynamic aspects of image elements include size, position, angle and color. The lines changes its position and length based on the mouse’s position. Also, there is a square rotating around the mouse and it spins faster as it move towards the right side.

Julie Choi – Project 03 – Dynamic Drawing

installation drawing

/*Julie Choi
15-104 Section C
jjchoi@andrew.cmu.edu
Project-03
*/

// declare necessary variables
var ballSizeB = 10
var ballX = 320;
var ballY = 240;
var x = 50
var angle = 0;
var angle2 = 0;
var starColor = 255;


function setup() {
	// setup canvas
    createCanvas(640, 480);
    // draw background in setup so that stars leave marks
    background(0);
}

function draw() {
	//background(0);
    var ballSizeA = 80;
    ballSizeA = constrain(ballSizeA, 1, 400);
    
    //cover the background of the inside of the planets black
    fill(0);
    noStroke();
    ellipse(width / 2, height / 2, 300, 300);
    
    //drawing yellow installation
    push();
    translate(width / 2, height / 2);
    rotate(radians(angle2));
    noStroke();
    fill(starColor);
    ellipse(x, x, 5, 5);
    pop();
    angle2 = angle2 + 5; 
    x = mouseY - 120;

    strokeWeight(3);
    stroke(255);
    fill(253, 255, 55);
    ellipse(ballX, ballY, ballSizeA, ballSizeA);

 	// draw colored planets
    push();
    noStroke();
    translate(width/2, height/2);
    rotate(radians(angle));
    fill(55, 255, 210);
    ellipse(0, -150, ballSizeB, ballSizeB);
    fill(55, 130, 255);
    ellipse(-150, 0, ballSizeB, ballSizeB);
    fill(255, 182, 55);
    ellipse(150, 0, ballSizeB, ballSizeB);
    fill(255, 55, 79);
    ellipse(0, 150, ballSizeB, ballSizeB);
    pop();
    angle = angle + 1.5;
    
    //text in the moon
    fill(0);
    noStroke();
	textSize(25);
	textFont('didot');
	text('moon', width / 2.22, height / 1.95);
}

My third project is an installation drawing that users can interact with. When you move the mouse, the rotating stars change radius and starting point to draw stars in space. Although I experienced some obstacles while using the rotation function, I enjoyed doing this project because I also learned a lot.