Elena Deng-Looking Outwards 08

Eyeo 2014 – Mouna Andraos and Melissa Mongiat from Eyeo Festival on Vimeo.

This week, I chose to listen to Mouna Andraos speak about their work. Their projects, focusing on participation, design, and technology tend to combine interactive design and environment. She calls her projects daily tous les jours, meaning “everyday” in French. The projects themselves create a magical environment, thus inciting the public to become active contributors to the results of the exhibition. The studio was started by Mouna, a professor at Concordia University, she has won various awards including the 2014 UNESCO Creative Cities Design Award for Young Talents.
One of the projects I really admired was the Sound Capsule created in 2010. It is a place in a loud city that one can just have some time to themselves. Another project that interested me was the conversation wall by Umpqua Bank. It was a temporary installation meant to engage the local community and celebrate the recent opening. By texting the bank they can add topics to a conversation and essentially each of the submissions will be displayed on the wall in real time, inviting everyone looking at the wall to joining in on the conversation.

Work

Conversation Wall

Rachel Lee Looking Outwards 08

Eyeo 2018 – Giorgia Lupi from Eyeo Festival on Vimeo.

Giorgia Lupi is an Italian, New York based information designer and entrepreneur who aspires to create compelling visual narratives that challenge the stereotype of impersonal data. Lupi studied architecture at FAF in Ferrara, Italy, before completing her PHD in design at Milan Politecnico. Her body of work is based on a sole kind of medium, rather, her work traverses the boundaries of digital, print and handcrafted representations, but rather, she uses whatever drawing medium is appropriate to best represent data. Something that I really admire about Lupi and her body of work is how she treats each data analytics case as a blank canvas, and creates a unique visual language for the dataset at hand. I also admire how she is able to visualise numbers in a way that is compelling by creating narratives, storylines, and humanising the data. Something that strikes me as very impressive is how data can be meaningful.

One project that I was really captivated was Dear Data, a project done in collaboration with Stefanie Posavec, a fellow information designer. The two were previously strangers, but were able to cultivate a friendship and tell a story about each other via weekly postcard ‘reportings’ regarding details of their daily lives. While I typically think that numbers and data are quite boring, the result of this project was a creative, engaging and intimate experience that documented the seemingly endless multifaceted aspects of two people’s lives.

Throughout Lupi’s talk, I really enjoyed her use of hand drawn screen transitions that speak to the body of her work, and how she dissects each case study of her project to discuss the brief, the collaborative efforts, process and physical products. Learning about the way in which data was interpreted and the integration of her visual voice into her presentation ultimately made for an effective presentation.

Dani Delgado Looking Outwards – 08

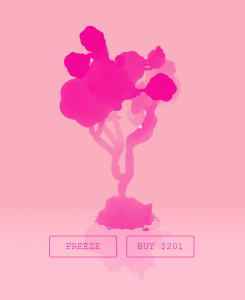
One of James Paterson’s projects – a VR model of a tree that grows with sound. He created it to express how ridiculous you can look while be immersed in a VR world.

The person I chose to hear speak is James Paterson, a Montreal based software developer who has deep roots in drawing and animation (a background which heavily manifests within his work). Inspired by the sci fi books he read in his youth, he is immensely interested in spatial and interactive computational art.

In the past, Paterson has used his art as a way to express his thoughts and emotions, allowing his mind to travel where it wanted to and draw in a stream of conscious style as a way of therapy (He explained this a lot within his lecture, and it did strike me as a very memorable and useful way of coping with anxiety). From this, he began to generate these seemingly random doodles and rendered them using 3D software to create experimental artwork. This opened the door for him to partner with the Google Creative Lab and create Norman – a 3D drawing and animating software created through JavaScript and used by using Oculus Rift VR gear.

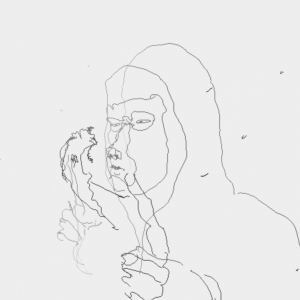
A screen capture of a Norman made animation. This was made with only VR gear

This project is absolutely mind blowing for me – the concept of drawing in 3D seems to be complex and out of reach, however, to be able to step into a drawing or an animation that you made and interact with it must be such a visceral experience that I one day hope to experience it.

Despite having created such amazing things, during his lecture he kept a very conversational tone and explained things in a way that even I, someone with limited CS experience, could fully understand and engage with him. I feel like this is an important skill to have in any situation of conceptual sharing and I wish to apply it to my presentations as well.

His website: https://normanvr.com

Above: video of his lecture.

Joanne Lee – Looking Outward 07

Flight Visualizations over 24 Periods, Institution: NATS (2014)

NATS is an air traffic control services provider and in this particular video, they visualized the air traffic coming and going to European airspace over the course of 24 hours on a summer day in 2014. Despite the fact that there is not much information available on it, I chose this work because after I graduated high school, my parents moved to Germany for 3 years. During those 3 years, I had the privilege of making many trips to, from, and within Europe. Throughout the countless delayed flights, time spent on the runway, and in the air, I became increasingly aware of the sheer number of flights that there are in a day and wondered how air traffic was managed and controlled.

It is particularly fascinating and meaningful to me to see this visualization. In terms of creating this visualization, I image that NATS has access to all of the flight routes of any given day and they carefully compiled these routes onto a 3D model of the Earth. I really like that they used a dark background for the Earth and used an eye-catching neon color while also making it slightly opaque — so that we can see places where many of the routes overlap.

(* Note: This assignment was submitting using one grace day.)

Joanne Lee – Project 07

Project-07

// Joanne Lee
// Section C
// joannele@andrew.cmu.edu
// Project-07

var nPoints = 100;
var colorR = 167;
var colorG = 168;
var colorB = 212;
var div = 0;
var w = 0;
var h = 0;

function setup() {
  createCanvas(480,480);
}

function draw() {
  background (240);
  push();
  translate(0,0);
    for (var c = 0; c < 6; c ++) {
      h = c * 96; // shifts height of flower
      for (var d = 0; d < 7; d ++) {
        w = d * 80; // shift width of flower
        drawEpitrochoidCurve(colorR, colorG, colorB, div, w, h);
      }
    }
    if (mouseY > 0){
        div = (mouseY / 15.0) + 5; // flower size scales to mouseY position
    }
  pop();
}

function drawEpitrochoidCurve(colorR, colorG, colorB, div, w, h) {
    // Epicycloid:
    // http://mathworld.wolfram.com/Epicycloid.html    
  var x;
  var y;
    
  var a = 80.0;
  var b = a / 2.0;
    
  fill(colorR, colorG, colorB);
  beginShape();
  for (var i = 0; i < 100; i++) {
    var t = map(i, 0, nPoints, 0, TWO_PI);
    x = a * (6 * cos(t) - cos(6 * t)) / div + w;
    y = a * (6 * sin(t) - sin(6 * t)) / div + h;
    vertex(x, y);
  }
  endShape(CLOSE);
    
}

function mouseClicked() { // petal color changes upon mouseClick
  var colNum = int(random(1,4));
    if (colNum == 1) {
      colorR = 167;
      colorG = 168;
      colorB = 212;
    }
    else if (colNum == 2) {
      colorR = 207;
      colorG = 61;
      colorB = 160;
    }
    else if (colNum == 3) {
      colorR = 90;
      colorG = 76;
      colorB = 181;
    }
}

Image result for flower color

For this week’s project, I first thought of flower petals when I was looking at the possible curves. I looked up flower petals and liked the colors and shapes of these, so I used ranuncloid curves to create them. Ranuncloid curves are essentially epicycloids with 5 cusps. For interactivity, I thought it would be interesting to make the flower “grow” using the mouseY position as well as randomly alternate between the flower colors depicted above with mouse clicks. I purposely had the flowers overlap with each other at its largest size because I thought that it formed an interesting pattern.

Robert Oh- Project 07 – Curves

curves

//Robert Oh
//Section C
//rhoh@andrew.cmu.edu
//Project-07-Curves

//assigning variables
var nPoints = 100;
var angle1 = 0;
var adj1 = 10;
var angle2 = 0;
var adj2 = 0;
var angle3 = 0;
var adj3 = 0;

function setup() {
    createCanvas(400, 400);
    frameRate(60);
}

function draw() {
    background(0);
    
    //drawing the white circle
    ellipse(mouseX, mouseY, 170, 170);

    //drawing the red Quadrifolium 
    push();
    fill(255, 0, 0);
    translate(mouseX, mouseY + 45);
    rotate(radians(angle1));
    drawQuadrifolium();
    angle1 = (angle1 + adj1) % 360;
    pop();

    //drawing the green Quadrifolium
    push();
    fill(0, 255, 0);
    translate(mouseX + 39, mouseY - 20);
    rotate(radians(angle2));
    drawQuadrifolium();
    angle2 = (angle2 + adj2) % 360;
    pop();

    //drawing the blue Quadrifolium
    push();
    fill(0, 0, 255);
    translate(mouseX - 39, mouseY - 20);
    rotate(radians(angle3));
    drawQuadrifolium();
    angle3 = (angle3 + adj3) % 360;
    pop();

    //adjusting speed of rotation for only blue and green Quadrifoliums
    adj2 = (15 * (mouseX / width)) + (15 * (mouseY / height));
    adj3 = (15 * (width - mouseX) / width) + (15 * (width - mouseY) / height);
}

//formula taken from: http://mathworld.wolfram.com/Quadrifolium.html
function drawQuadrifolium() {
    var a = 40;
    
    beginShape();
    for (var i = 0; i < nPoints; i++) {
        var t = map(i, 0, nPoints, 0, TWO_PI);
        r = a * sin(2 * t);
        x = r * cos(t);
        y = r * sin(t);
        vertex(x, y);
    }
    endShape(CLOSE);
    
}

When I first started this assignment, I was looking around for inspiration. One morning, when I started shaving with my electric razor, I realized that my blades were in the shape similar to that of a quadrifolium. Thus, I created the three quadrifoliums in the same shape as my razor. I adjusted the speed of the top two “razors” to speed up/slow down if they are near the edges of the canvas.

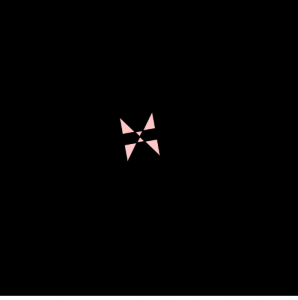
my attempt to make a quadrifolium

Project 7 rrandell

sketch

/* Rani Randell
rrandell@andrew.cmu.edu
Section A
Project 7 */

function setup() {
    createCanvas(400, 400);
}

function draw() {
    background(255, 250, 180) //pastel pallette

    x = constrain(mouseX, 0, width);
    y = constrain(mouseY, 0, height);

    push();
    translate(width, height);
    drawHypotrochoid();
    pop();
}

function drawHypotrochoid() {

    for (var i = 0; i < TWO_PI; i ++) { 
       var a = map(y, 0, mouseX, 0, height); 
       var b = map(x, 0, mouseY, 0, width); 

        x = (a - b) * cos(i) + 200 * cos(((a-b)/b) * i); //equations
        y = (a - b) * sin(i) - 200 * sin(((a-b)/b) * i); // cited at bottom

        noFill();
        stroke(180, 150, 255); 
        strokeWeight(1);
        ellipse(-200, -200, x, y); //lavendar ellipse
        stroke(0, 0, 255);
        rect(-200, -200, x, y); //blue rectangles
        stroke(255, 250, 0) //clear yellow
        ellipse(-100, -100, x / .5, y / .5)
        stroke(255, 100, 240); //hot pink concentric circles
        ellipse(-300, -300, x * .5, x * .5)

    }
    //link to eq: http://mathworld.wolfram.com/Hypotrochoid.html
}

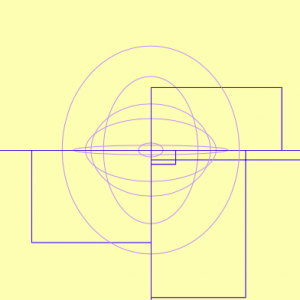
I really wanted this project to feel like an explosion of lines and color, so i mainly experimented with the various ellipses and rectangles after implementing the equations for a hypotrochoid. I included a process pic below:


Looking Outwards 07 – Data Vis


This was the animation on their website that caught my eye

Studio NAND’s website is like their work; it’s catchy and dynamic. One of their projects, Peak Spotting, took data gathered from Deutsche Bahn, a German railroad company, and created a tool that in real time displays data for all of their lines, and through use of historic data, projects estimations up to 100 days in the future for data like train use. I think that what they’ve made is both utilitarian and well-presented (you can really see that they care for style). It looks like they’ve developed their own industry-oriented app that displays all of the data that Deutsche Bahn records. In part, Deutsche Bahn is to thank for keeping such detailed records, but Studio Nand’s design team did a good job. The animation above is simple but colorful, and the bar charts are pleasant to look at without compromising the reality of the numbers. It’s nothing too abstract, and doesn’t aim to be art, but it’s just straight-up good data.

Sean Meng – Project 7

sketch

function setup() {
    createCanvas(480, 480);
    frameRate(10);
}


function draw () {
    background(0)
    noFill()
    stroke(255)
    var nPoints = 20;
    var radius = 50;
    var separation = 125;
    var R1 = mouseX/2
    var R2 = mouseY/2

//the color of the pattern changes slowly from bluee to red as the mouse moves along the diagnal of canvas  
//the first set of rectangle loop
    stroke(mouseX, 10, 10)
    push();
    translate(2*separation, height / 2);
    for (var i = 0; i < nPoints; i++) {
        var theta = map(i, 0, nPoints, 0, TWO_PI);
        var px = R1 * cos(theta);
        var py = R2 * sin(theta);
        rect(px - 5, py - 5, 10, 10);
    }
    pop();

//the second set of rectangle loop
    stroke(mouseX, 30, 30)
    push();
    translate(2*separation, height / 2);
    for (var i = 0; i < nPoints; i++) {
        var theta = map(i, 0, nPoints, 0, TWO_PI);
        var px = R1 * cos(theta);
        var py = R2 * sin(theta);
        rect(px - 10, py - 10, 20, 20);
    }
    pop();

//the third set of rectangle loop
    stroke(mouseX, 50, 50)
    push();
    translate(2*separation, height / 2);
    for (var i = 0; i < nPoints; i++) {
        var theta = map(i, 0, nPoints, 0, TWO_PI);
        var px = R1 * cos(theta);
        var py = R2 * sin(theta);
        rect(px - 15, py - 15, 30, 30);
    }
    pop();

//the fourth set of rectangle loop
    stroke(mouseX, 70, 70)
    push();
    translate(2*separation, height / 2);
    for (var i = 0; i < nPoints; i++) {
        var theta = map(i, 0, nPoints, 0, TWO_PI);
        var px = R1 * cos(theta);
        var py = R2 * sin(theta);
        rect(px - 30, py - 30, 60, 60);
    }
    pop();

//the fifth set of rectangle loop
    stroke(mouseX, 90, 90)
    push();
    translate(2*separation, height / 2);
    for (var i = 0; i < nPoints; i++) {
        var theta = map(i, 0, nPoints, 0, TWO_PI);
        var px = R1 * cos(theta);
        var py = R2 * sin(theta);
        rect(px - 50, py - 50, 100, 100);
    }
    pop();

//the sixth set of rectangle loop
    stroke(mouseX, 110, 110)
    push();
    translate(2*separation, height / 2);
    for (var i = 0; i < nPoints; i++) {
        var theta = map(i, 0, nPoints, 0, TWO_PI);
        var px = R1 * cos(theta);
        var py = R2 * sin(theta);
        rect(px - 90, py - 90, 180, 180);
    }
    pop();

//the seventh set of rectangle loop
    stroke(mouseX, 140, 140)
    push();
    translate(2*separation, height / 2);
    for (var i = 0; i < nPoints; i++) {
        var theta = map(i, 0, nPoints, 0, TWO_PI);
        var px = R1 * cos(theta);
        var py = R2 * sin(theta);
        rect(px - 95, py - 95, 190, 190);
    }
    pop();

//the eighth set of rectangle loop
    stroke(mouseX, 170, 170)
    push();
    translate(2*separation, height / 2);
    for (var i = 0; i < nPoints; i++) {
        var theta = map(i, 0, nPoints, 0, TWO_PI);
        var px = R1 * cos(theta);
        var py = R2 * sin(theta);
        rect(px - 100, py - 100, 200, 200);
    }
    pop();

//the nineth set of rectangle loop
    stroke(mouseX, 220, 220)
    push();
    translate(2*separation, height / 2);
    for (var i = 0; i < nPoints; i++) {
        var theta = map(i, 0, nPoints, 0, TWO_PI);
        var px = R1 * cos(theta);
        var py = R2 * sin(theta);
        rect(px - 105, py - 105, 210, 210);
    }
    pop();

}    

In this project, I wanna design a floral pattern that can change colors using repeating geometries. The flower’s color changes to blue to read as the mouse moves diagonally on the canvas. The change of color also represents blossom.

Julie Choi – Project 07 – Curves

jjchoi_curves

// Julie Choi
// jjchoi
// Project 07
// Section E

var nPoints = 360;

function setup() {
    createCanvas(480, 480);
}

function draw() {
	background(230, 171, 130);
	push();
    translate(240, 240);
	drawEightCurve();
    drawCruciform();
	pop(); 
}

function drawEightCurve() { 
	// http://mathworld.wolfram.com/EightCurve.html
    var x;
    var y;
    var a = 300;
    var b = a / 2.0;
    var p = constrain(mouseY, 0, 480);
    var q = mouseX / 400;
    stroke(148, 79, 81);

    //create for loop to create eight curves in different sizes
    for(var r = 0; r < 1; r+=0.1){
    	// use push pop to rotate the forms with mouse location
        push();
        rotate(map(p, 0, 480, 0, 2 * PI));
        beginShape();
        noFill();
        // make the lines jitter by adding random function
        for (var i = 0; i < nPoints; i++) {
            var t = map(i, 0, nPoints, 0, PI * 2);
            x = a * sin(t) * (q + r) + random(-1, 1);
            y = a * sin(t) * cos(t) * (q + r) + random(-1, 1);
            vertex(x, y);
        }
        endShape(CLOSE);
        pop();
    }
}

function drawCruciform() { 
	// http://mathworld.wolfram.com/Cruciform.html
    var x2;
    var y2;
    var a2 = 300;
    var b2 = a2 / 2.0;
    var p2 = constrain(mouseY, 0, 480);
    var q2 = mouseX / 400;
    stroke(255);

    //create for loop to create cruciforms in different sizes
    for(var j = 0; j < 1; j+=0.1){
    	// use push pop to rotate the forms with mouse location
        push();
        rotate(/*map(p2, 0, 480, 0, 2 * */PI);
        beginShape();
        noFill();
        // make the lines jitter by adding random function
        for (var i = 0; i < nPoints; i++) {
            var t2 = map(i, 0, nPoints, 0, PI * 2);
            x2 = a2 * (1/(cos(t2)) * (q2 + j) + random(-0.5, 0.5));
            y2 = a2 * (1/(sin(t2)) * cos(t2) * (q2 + j) + random(-0.5, 0.5));
            vertex(x2, y2);
        }
        endShape(CLOSE);
        pop();
    }
}

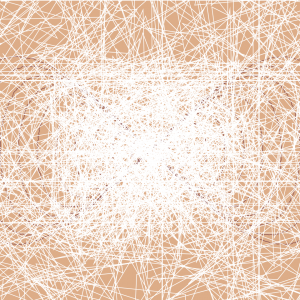
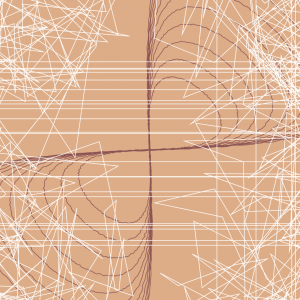
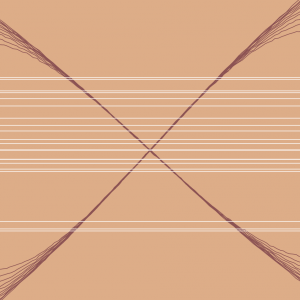
Approaching this project was challenging than I thought because it incorporated different sources of information from a website. However, I learned how to use it to my advantage to create this chaotic curve pattern. My initial idea was to put two different types of curves: eight curves and cruciform. I got the eight curves to jitter and move based on the mouse, but for the cruciforms, I ended up jittering throughout the whole canvas creating a spiderweb-like visual. This was not my initial idea, but just playing around with the different variables and adding it to the formulas provided in the website helped me explore all the different variations of the lines. Down here are the steps of how my curves transform: