Yiran Xuan – Project 07 – Curves

The idea behind this project was to implement an “unfolding” of the involute from the surface of the circle, similar to an Asian fan or a wing. A little struggle was had in keeping track of the angle variables, whether they represented angles themselves or just the increments (out of 24).

The mouse in the horizontal direction controls the unfolding, while in the vertical the rotation of the whole drawing is affected.

sketch

//Objective: draw circle involute
//mouse control: y controls the amount of "wrapping"
//mouse control: x controls initial angle

var wrap = 0; //determines how far the involute extends out
var initangle = 0;

var increment = 12;
var radius = 25;

function setup() {
    createCanvas(480, 480);
    angleMode(RADIANS);
}

function draw() {
	translate(width/2, height/2); //shifting coordinates to the center

	rotate(constrain(mouseY, 0, 480)/240*PI); //rotation

    background('white');

	wrap = 24 - constrain(mouseX, 0, 480)/20; //number of increments to go around circle

	noFill();
	strokeWeight(3);
	stroke('orange');
	ellipse(0, 0, radius*2, radius*2); //drawing center circle

	var accumulatedincrement = 0;

	for(var i = 0; i <= wrap; i++){
		stroke('cyan');

		var currentangle = accumulatedincrement/increment*PI;
		var x1 = radius*(cos(currentangle) + currentangle*sin(currentangle)) //determining fan section start point
		var y1 = radius*(sin(currentangle) - currentangle*cos(currentangle));

		accumulatedincrement++;
		
		var nextangle = accumulatedincrement/increment*PI;
		var x2 = radius*(cos(nextangle) + nextangle*sin(nextangle)); //determining fan section end point
		var y2 = radius*(sin(nextangle) - nextangle*cos(nextangle));

		triangle(x1, y1, x2, y2, 0, 0); //drawing triangle

		stroke('red');
		line(x1, y1, radius*cos(nextangle), radius*sin(nextangle)); //drawing lines to display tangency
	}

}

Jonathan Liang – Project 7 – Curves

sketch

//Jonathan Liang
//jliang2
//Section A

function setup() {
    createCanvas(600, 600);
    frameRate(10);
  
}

function draw() {
	background(0);
	push();
	translate(300,300);
	rotate(sin(mouseX));
	drawKevin();
	pop();

	push();
	translate(300,300);
	rotate(-sin(mouseX));
	drawStanley();
	pop();
}

function drawKevin() {
    var kPoints = map(mouseX, 0, height, 0 , 500);
    var x;
    var y;
    var tj = map(mouseX, 0, width,0,8); // for iterations
    beginShape();
    for (var i=0; i < kPoints; i++){ 
        var t = map(i,0,kPoints,0,TWO_PI*tj);
        noFill();
        var colR = map(mouseX, 0, width, 0, 255);
        var colG = map(mouseY, 0, width, 0, 255);
        var colB = map(mouseX, 0, width, 0, 255);
        strokeWeight(.5);
        stroke(colR, colG, colB); // 
        //equations as listed on mathworld.wolfram.com/ButterflyCurve.html
        x = Math.sin(t) * (Math.pow(Math.E,Math.cos(t))
                        - 2*Math.cos(4*t) 
                        + Math.pow(Math.sin(t/12),5));

        y = Math.cos(t) * (Math.pow(Math.E,Math.cos(t))
                        - 2*Math.cos(4*t) 
                        + Math.pow(Math.sin(t/12),5));

        vertex(i*x,i*y);
    }
    endShape(CLOSE);  
}

function drawStanley() {
    var sPoints = map(mouseX, 0, height, 0 , 500);
    var x;
    var y;
    var tj = map(mouseX, 0, width,0,8); 

    beginShape();
 
    for (var i=0; i < sPoints; i++){ 
        var t = map(i,0,sPoints,0,TWO_PI*tj);
        noFill();
        var colR = map(mouseX, 0, width, 255, 0);
        var colG = map(mouseY, 0, width, 255, 0);
        var colB = map(mouseX, 0, width, 255, 0);
        strokeWeight(0.5);

        stroke(colR, colG, colB); // 
        //equations as listed on mathworld.wolfram.com/ButterflyCurve.html
        x = Math.sin(t) * (Math.pow(Math.E,Math.cos(t))
                        - 2*Math.cos(4*t) 
                        + Math.pow(Math.sin(t/12),5));

        y = Math.cos(t) * (Math.pow(Math.E,Math.cos(t))
                        - 2*Math.cos(4*t) 
                        + Math.pow(Math.sin(t/12),5));

        vertex(i*x,i*y);
    }
    endShape(CLOSE);  
}

I see the butterfly curve more like a ripple or a flower, growing over time. Just a flower blooms, butterflies blossom from little caterpillars to marvelous winged insects. However, as one butterfly blossoms, one must leave; which is why I made one fade away as the other became more prominent. The color becomes the most vibrant at the top right, symbolizing the butterfly’s prime, while the faded bottom right corner symbolizes its passing.

Project 07: Curves

sketch

/* Samantha Ho
Section E 
sch1@andrew.cmu.edu
Project 07*/

var x;
var y;


function setup() {
	createCanvas(480 , 480);
        frameRate(25);
	}

function draw(){
 background(255, 255, 200);
    
    var nPoints = 20;
    var radius = 250;
    var separation = 125;
    
    // draw the squares in the back
    push();
    translate(2*separation, height / 4);
    for (var i = 0; i < nPoints; i++) {
        var theta = map(i, 0, nPoints, 0, TWO_PI);
        var px = radius * cos(theta);
        var py = radius * sin(theta);
        rect(px - 5, py - 5, 10, 10);
    }
    pop(); 
    
    
    // draw the baseline squiggle 
    strokeWeight(1.5);
    stroke(0,0,255);
    fill(250, 255, 250, 80);
    push();
    translate(2*separation, height /2);
    beginShape();
    for (var i = 0; i < nPoints; i++) {
        var theta = map(i, 0, nPoints, 0, TWO_PI);
        var px = radius * sin(theta);
        var py = radius * sin(theta);
        vertex(px + random(-5, 10), py + random(-5, 10));
    }
    endShape(CLOSE);
    pop();
    
    //green squiggle
    strokeWeight(1.5);
    stroke(0,190,200);
    fill(0, 195, 220, 80);
    push();
    translate(2*separation, height /2);
    beginShape();
    for (var i = 0; i < nPoints; i++) {
        var theta = map(i, 0, nPoints, 0, TWO_PI);
        var px = radius * sin(theta);
        var py = radius * sin(theta);
        vertex(px + random(-mouseX/3, 10), py + random(-mouseX/3, 10));
    }
    endShape(CLOSE);
    pop();
    
    //yellow squiggle
    strokeWeight(1.5);
    stroke(0,190,200);
    fill(255, 255, 0, 80);
    push();
    translate(2*separation, height /2);
    beginShape();
    for (var i = 0; i < nPoints; i++) {
        var theta = map(i, 0, nPoints, 0, TWO_PI);
        var px = radius * sin(theta);
        var py = radius * sin(theta);
        vertex(px + random(-mouseX/3, 10), py + random(-mouseX/3, 10));
    }
    endShape(CLOSE);
    pop();
  
}


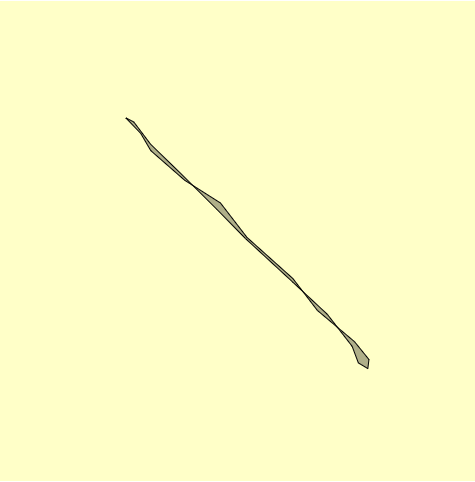
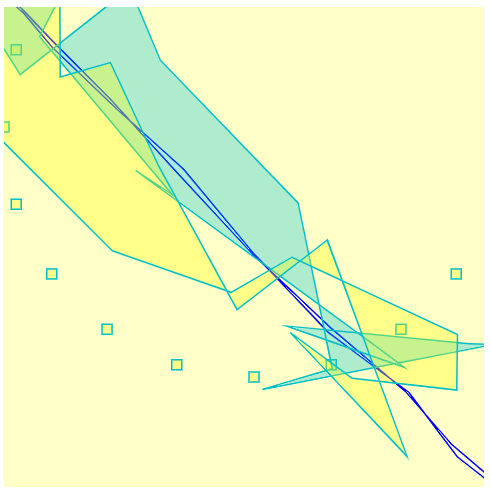
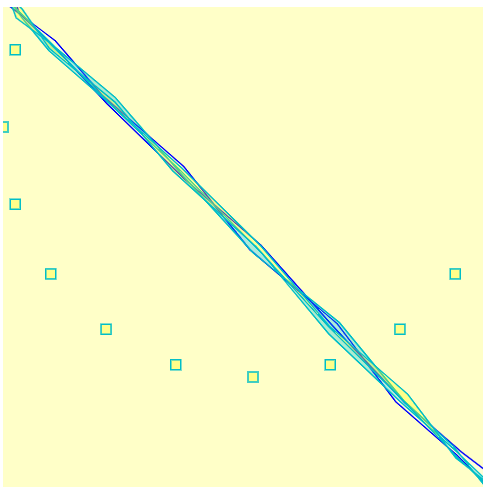
After playing around with the circles and the graphs, I liked the animated rendering effect so I continued to play around. I created this layered squiggle and baseline whose form is contingent on the cursor’s X-position.

initial vibrating squiggle
max-position squiggle
minimum position squiggle

John Legelis – Project 07: Composition with Curves

sketch

// John Legelis
// Section D


//Define canvas width and height
cwidth = 480
cheight = 480

function setup() {
    createCanvas(cwidth, cheight);
    background(0);

    textSize(40);
    fill(255)
    textFont('Helvetica');
    text('mouse over', 120, 240);
}

//Initialize number of points drawn in graph
var npoints = 60
var step = 2 * Math.PI / npoints
//Radius of outer circle
var bigR 
//Radius of inner circle
var r
// offset the graph so it is drawn about the center
var offsetx = cwidth/2
var offsety = cheight/2 
//color variable
var cw


function hypX (t) {
    //Big and little circle radius mapped to x,y mouse and constrained to canvas
    bigR = map(constrain(mouseX, 0, cwidth),0, 1000, 0, 400)
    r = map(constrain(mouseY, 0, cheight), 0, 700, 0, 400)
    var x = ((bigR - r) * cos(t) + r * cos((bigR - r)/r * t) + offsetx)
    return x
}

function hypY (t) {
    //Big and little circle radius mapped to x,y mouse and constrained to canvas
    bigR = map(constrain(mouseX, 0, cwidth),0, 1000, 0, 400)
    r = map(constrain(mouseY, 0, cheight), 0, 700, 0, 400)
    var y = ((bigR - r) * sin(t) + r * cos((bigR - r)/r * t) + offsety)
    return y
}

function draw() {
    //color variable randomized RGB in neon range
    cw = [random(0,200), random(0,200), random(0,200)]


    //for every point in the pattern
    for (theta = 1; theta < 30*PI; theta = theta + 2*PI/npoints) {
        strokeWeight(3)
        stroke(cw)
        // draw a line from the point to the previous point
        line(hypX(theta), hypY(theta), hypX(theta - step), hypY(theta - step))
    }
    // erase everything when mouse mouseIsPressed
    if (mouseIsPressed) {
        background(0)
    }
}

This week’s project was left very open ended, and after some research on Wolfram Alpha World about curves and their mathematical composition, I developed an understanding for how a spirograph creates hypotrochoid shapes by rotating a circle within another circle.

The general formula for the X and Y coordinates of a hypotrochoid curve in reference to theta is:

x(θ(Rr)*cosθ r*cos(θ*(Rr)/r) y(θ(Rr)*sinθ − r*sin(θ*(Rr)/r)

Where R and r refer to the radii of the outer circle and the inner circle respectively.
In my project I created code that draws a hypothyroid whose R and r vary with mouseX and mouseY respectively. When the mouse is pressed the canvas will erase

LO 7 – Sara Frankel


caption: Artist Nicholas Rougeux captures the conversation of music with his circular, intricate images that are in relation to the score itself.

Artist Nicholas Rougeux has been working on the project of visualizing music. He does so by scoring single instrument pieces in one color, and larger orchestrations with more colors; different parts associated with specific colors. He also correlates the position of a note on the staff with the radius of its position from the center of the circle; so lower notes on a musical staff will have a smaller radii than a higher note. Overall, its the visualization of an entire piece within a circle, its an “Off the Staff” experience. In other words, its taking a book of dots on lines and visualizing it to bring another perspective and meaning to what we hear in complex classical music. I admire this project as one gets a great sense of the voicing of a piece and the relationship between each voice. As a musician, this is a really important aspect of my career in the sense that it is the conversation with musicians around me and to the audience that matters the most. This is what the artist is ultimately trying to achieve, to break down the relationship and conversation of music that can sometimes be hard to know where to even start when you listen to it firsthand.

(link to their website: https://www.c82.net/offthestaff/ )

Connor McGaffin – Looking Outwards – 07

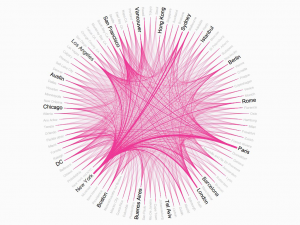
Airbnb’s Top 50 Markets / Rachel Binx / March 2011

Rachel Binx is a designer that visualizes information for a wide set of clients. This piece was created for a presentation that Airbnb’s CEO was giving on the cities which are most connected between via the app. The line weight that connects each of these locations is in proportion to the volume of trips booked from one to the other.

I feel drawn to this piece because of its relatively simple structure, but complex inner working of arc “strings”.  Upon initial viewing, I get the idea that Airbnb simply reaches a large quantity of cities, as a very little proportion of viewers are going to count every city around the hub.

However, the design encourages viewers to engage in a more curious way, where they can discover these relationships without them being handed out. This “work” that the viewer does leaves the user with a sense of reward and a hint of ownership over the connections that they’ve inferred from this visualization.

This layers of interaction to this project brings Binx’s creative sensibilities into light. It is clear that Binx has an understanding of how people engage with visualized data, and what really “matters”. Every person in the room isn’t going to care that there are some x-thousand connections between one city and the other, but they may find more value in these inferetial comparisons.

source

Project 7 Liz Maday

emadayflames

//Elizabeth Maday
//Section A
//emaday@andrew.cmu.edu
//Project 7

var nPoints = 450;

//background color
var r = 0;
var g = 0;
var b = 0;
//red fire colors
var r1 = 255;
var b1 = 0;
var g1 = 0;
var r2 = 255;
var g2 = 85;
var b2 = 0;
var r3 = 255;
var g3 = 164;
var b3 = 0;
var r4 = 255;
var g4 = 204;
var b4 = 0;
//blue fire colors
var R1 = 7;
var G1 = 83;
var B1 = 130;
var R2 = 27;
var G2 = 125;
var B2 = 186;
var R3 = 73;
var G3 = 174;
var B3 = 237;
var R4 = 105;
var G4 = 185;
var B4 = 234;
//shadow colors red
var rr = 108; //inside
var gg = 22;
var bb = 0;
var rrr = 255;//outside
var ggg = 58;
var bbb = 0;
//shadow colors blue
var RR = 4; //inside
var GG = 22;
var BB = 33;
var RRR = 22; //outside
var GGG = 63;
var BBB = 89;
//water colors blue
wr = 47;
wg = 102;
wb = 191;
//water colors green
WR = 12;
WG = 201;
WB = 72;

function setup() {
	createCanvas(400, 400);
	frameRate(6);
	strokeWeight(0.7);
}

function mouseClicked() {	
	if (r1 === 255) { 
		r1 = R1;
		g1 = G1;
		b1 = B1;
		r2 = R2;
		g2 = G2;
		b2 = B2;
		r3 = R3;
		g3 = G3;
		b3 = B3;
		r4 = R4;
		g4 = G4;
		b4 = B4;
		r = 4; 
	    g = 22;
	    b = 70;
	    rr = RR;
	    gg = GG;
	    bb = BB;
	    rrr = RRR;
	    ggg = GGG;
	    bbb = BBB;
	    wr = WR;
	    wg = WG;
	    wb = WB;
	} else if (r1 === 7) { 
		r1 = 255;
		g1 = 0;
		b1 = 0;
		r2 = 255;
		g2 = 85;
		b2 = 0;
		r3 = 255;
		g3 = 164;
		b3 = 0;
		r4 = 255;
		g4 = 204;
		b4 = 0;
		r = 0;
		g = 0;
		b = 0;
		rr = 108;
		gg = 22;
		bb = 0;
		rrr = 255;
		ggg = 58;
		bbb = 0;
		wr = 47;
		wg = 102;
		wb = 191;
	}
}

function draw() {
	background(r, g, b);
	translate(200, 200);
    shadows(0, 0); 
    fire(0, 0);
    water2(0, 0);  	
    textSize(15);
    text('Click!', -170, 170);
}

function shadows(x, y) {
	translate(x, y);
	push();
    ellipseMode(CORNER);
    fill(rrr, ggg, bbb); //outside
    ellipse(-35, 5, random(125, 130), random(40, 50));
    fill(rr, gg, bb); //inside
    ellipse(-25, 5, 70, random(20, 30));
	pop();
}

function fire(x, y) {
	translate(x, y);
	beginShape();
	fill(r1, g1, b1);
	//outermost part
	for (var i = 0; i < nPoints; i += 1) {
		var num = random(1, 1.4);
		var r = num - sin(theta);
		var theta = map(i, 0, nPoints, 0, TWO_PI);
		var grow = (dist(mouseX, mouseY, width/2, height/2))/3.5;
        var x = grow * (r*cos(theta));
        var y = grow * (r*sin(theta));
        vertex(x, y);
	}
	endShape(CLOSE);
	//second to outermost part
	beginShape();
	fill(r2, g2, b2);
	for (var i = 0; i < nPoints; i += 1) {
		var num = random(0.9, 1.2);
		var r = num - sin(theta);
		var theta = map(i, 0, nPoints, 0, TWO_PI);
		var grow = (dist(mouseX, mouseY, width/2, height/2))/3.5;
        var x = grow * (r*cos(theta));
        var y = grow * (r*sin(theta));
        vertex(x, y);
	}
	endShape(CLOSE);
    //second to innermost part
	beginShape();
	fill(r3, g3, b3);
	for (var i = 0; i < nPoints; i += 1) {
		var num = random(0.6, 1);
		var r = num - sin(theta);
		var theta = map(i, 0, nPoints, 0, TWO_PI);
		var grow = (dist(mouseX, mouseY, width/2, height/2))/3.5;
        var x = grow * (r*cos(theta));
        var y = grow * (r*sin(theta));
        vertex(x, y);
	}
	endShape(CLOSE);   
    //innermost part
	beginShape();
	fill(r4, g4, b4);
	for (var i = 0; i < nPoints; i += 1) {
		var num = random(0.2, 0.5);
		var r = num - sin(theta);
		var theta = map(i, 0, nPoints, 0, TWO_PI);
		var grow = (dist(mouseX, mouseY, width/2, height/2))/3.5;
        var x = grow * (r*cos(theta));
        var y = grow * (r*sin(theta));
        vertex(x, y);
	}
	endShape(CLOSE);	
}

function water2(x, y) {
	translate(x, y);
	fill(wr, wg, wb);
	for (var i = 0; i < nPoints; i += 1) {
        var x = dist(mouseX, mouseY, width/2, height/2) * 1.2;
        var y = dist(mouseX, mouseY, width/2, height/2) * 1.2;
        var size = dist(mouseX, mouseY, width/2, height/2)/4;
		ellipse(x, y, size, size);
		push();
		fill(255);
		ellipse(x - 2, y, size - (size*0.6), size - (size*0.6));
		pop();

		var x1 = (dist(mouseX, mouseY, width/2, height/2)) * -1;
		var y1 = dist(mouseX, mouseY, width/2, height/2);
		var size1 = dist(mouseX, mouseY, width/2, height/2)/5;
		ellipse(x1, y1, size1, size1);
		push();
		fill(255);
		ellipse(x1 - 2, y1, size1 - (size1*0.6), size1 - (size1*0.6));
		pop();

		var x2 = (dist(mouseX, mouseY, width/2, height/2)) * -1.2;
		var y2 = (dist(mouseX, mouseY, width/2, height/2)) * -1.2;
		var size2 = dist(mouseX, mouseY, width/2, height/2)/4;
		ellipse(x2, y2, size2, size2);		
		push();
		fill(255);
		ellipse(x2 - 2, y2, size2 - (size2*0.6), size2 - (size2*0.6));
		pop();

		var x3 = (dist(mouseX, mouseY, width/2, height/2));
		var y3 = (dist(mouseX, mouseY, width/2, height/2)) * -1;
		var size3 = dist(mouseX, mouseY, width/2, height/2)/5;
		ellipse(x3, y3, size3, size3);	
		push();
		fill(255);
		ellipse(x3 - 2, y3, size3 - (size3*0.6), size3 - (size3*0.6));
		pop();

		var x4 = width/2;
		var y4 = (dist(mouseX, mouseY, width/2, height/2)) * -1.5;
		var size4 = dist(mouseX, mouseY, width/2, height/2)/5;
		ellipse(x4 - 200, y4, size4, size4);	
		push();
		fill(255);
		ellipse(x4 - 200, y4, size4 - (size4*0.6), size4 - (size4*0.6));
		pop();

		var x5 = width/2;
		var y5 = (dist(mouseX, mouseY, width/2, height/2)) * 1.5;
		var size5 = dist(mouseX, mouseY, width/2, height/2)/5;
		ellipse(x5 - 200, y5, size5, size5);	
		push();
		fill(255);
		ellipse(x5 - 200, y5, size5 - (size5*0.6), size5 - (size5*0.6));
		pop();
	}
}
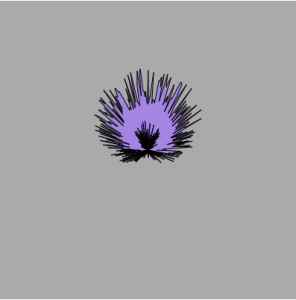


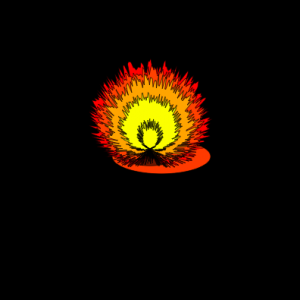
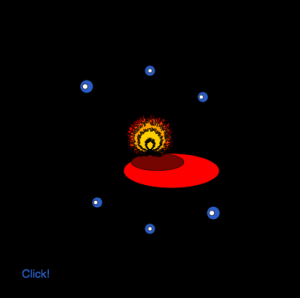
I liked working on this project because I gained a better understanding of how extensively you can use math in P5. I discovered how to make the flames by accident by randomizing one of the values in the equation of the curve. Once this happened, I was able to come up with a concept for the rest of the project. I liked working with colors and the mouseIsPressed conditional to change the image from red fire to blue fire. In the future, I would like to have a better ability to implement the map() function, as I feel that it would have been useful for my goals in this project.

Looking Outwards 07: Jaclyn Saik

Nicholas Felton is one of my new favorite designers. He is a trailblazer in the field of digital data visualisation, and I am especially interested in his story because he came from traditional graphic design and moved on to creating algorithms that collect data after he realized how much he enjoyed representing it through graphics. I have always been interested in editorial design specifically because a lot of times, it involved an interesting combination of powerful aesthetics and thought-out information representation, and it’s hyper focused on making the reader understand what it’s trying to communicate. Felton does this with his in a lot of his work, and especially in the project Daytum.

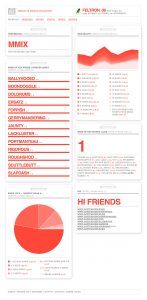
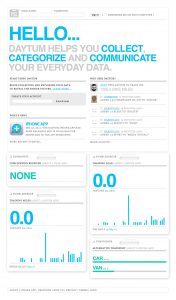
A screenshot example of the home panel for Felton’s own account, where his personal statistics are graphed elegantly in front of him.
The landing page for the website, which shares data from users around the world as an example of the programs capabilities.

Daytum is a platform an app that collects personal statistics from the user and elegantly communicates them in different ways. The spreadsheets and visuals it produces are created in the spirit of Felton’s famous Annual Reports. Based on the interface and the type of information this app tracks, I’m thinking that it is created with code that takes certain data sets (and has to have different versions or be flexible to different types of data) and then puts them through a program that organizes the data points in relationship to each other and plots/prints them in different formats. What I find interesting, as a communications designer who is currently studying typography, is that the program probably has to account for formatting errors and irregularities that come with differing data: longer words that change the word spacing, numbers that contain decimals or are greater/less than zero, and orphaned words and other paragraph issues. I think what makes this program so elegant is Felton’s eye for clean design, so that these personal data points are plotted neatly and elegantly no matter what they are.

This project was released in 2008. I know there are a lot of similar and far more developed apps out there now, but this is on the first times an iPhone app took on this form, and I think thats important.

Xindi Lyu-project 07- Curves-Section A

sketch

 
/*
Xindi Lyu
Section A
xindil@andrew.cmu.edu
*/


var nPoints = 100;
var HYPOCYCLOID = 1;
var EPICYCLOID = 0;
var curveMode = HYPOCYCLOID;

function setup() {
    createCanvas(500, 500);
    frameRate(10);
        }


function draw() {
    
    push();
    translate(250,250);
    switch (curveMode){
        case HYPOCYCLOID:
        drawHypocycloid();
        break;
        case EPICYCLOID:
        drawEpicycloid();
        break;
    }
    pop();


    }


function drawHypocycloid() {//drawcurve
    background(200,200+mouseX*0.1,200+mouseY*0.1);//make the changing background for Hypocycloid
    var x;
    var y;
    var a=map(mouseX, 0, 500, 1, 100);//size of the geometry
    var n=map(mouseX, 0, 500, 1, 15);//devision of thhe curve
    fill(200,150+mouseX*0.1,200+mouseY*0.1);//fill the geometry with changing color 
    
    stroke(0.4*mouseX+0.4*mouseY);//change the ourline color
    beginShape();
    for(var i=0; i<nPoints; i++){
        var t = map(i, 0, nPoints, 0, 2*PI);
        x=a*(((n-1)*cos(t)+cos((n-1)*t))/n);
        y=a*(((n-1)*sin(t)-sin((n-1)*t))/n);
        vertex(x+random(-5,5),y+random(-5,5));
    }
    endShape(CLOSE);
}


function drawEpicycloid() {//drawcurve
    background(200,150+mouseX*0.1,200+mouseY*0.1);//make the changing background for Epicycloid
    var x;
    var y;
    var a=map(mouseX, 0, 500, 1, 100);//size of the geometry
    var n=map(mouseY, 0, 500, 1, 15);//devision of thhe curve
    fill(200,200+mouseX*0.1,200+mouseY*0.1);;//fill the geometry with changing color 
    stroke(0.4*mouseX+0.4*mouseY);
    beginShape();
    for(var i=0; i<nPoints; i++){
        var t = map(i, 0, nPoints, 0, 2*PI);
        x=(a+n)*cos(t)-n*cos((a+n)/n*t);
        y=(a+n)*sin(t)-n*sin((a+n)/n*t);
        vertex(x+random(-5,5),y+random(-5,5));
    }
    endShape(CLOSE);
}

function mousePressed(){
    curveMode = 1- curveMode;//switch between geometries
}

For this project I experimented with two different types of curves and rendering them with the jittering effect to add a lively feeling to the image.

Jenna Kim (Jeeyoon Kim)- Project 7- Wallpaper

jeeyoonk07

/* Jenna Kim (Jeeyoon Kim)
Section E
jeeyoonk@andrew.cmu.edu
Project 7
*/

var nPoints = 360

function setup() {
    createCanvas(500, 500);
    
}

function draw() {
	//drawing curve
	background(130, 20, 40);
	push();
	translate(width / 2, height / 2);
	drawAstroidCurve();
	pop(); 

	fill(255, 100);
	textSize (30);
	textFont('Roboto');

	text("CHAOS", width / 2 - 50, 480);
}

function drawAstroidCurve() { //
	// Astroid;
	//Link: http://mathworld.wolfram.com/Astroid.html
	var x; 
	var y;
	var xR = constrain(mouseX, 0, 500);
	var ellipseR = map(mouseX, 0, 500, 10, 120);
	var a = map(xR, 0, 500, 40, 30);
	var b = map(xR, 0, 500, 50, 300);
	var h = constrain(mouseY, 0, 400);


	stroke(255);
	strokeWeight(0.5);

	//chaotic ASTROID CURVE
	beginShape();
	fill(130, 20, 40);
	for (var i = 0; i < nPoints; i++) {
		x = (4 * a * cos(i)) + (b * cos(3 * h * i));
	    y = (2 * a * sin(i)) - (b * sin(3 * h * i));
        vertex(x, y);
	};
	endShape(CLOSE);

	noStroke();
	fill(255);
	ellipse(3, 5, ellipseR, 50);
}

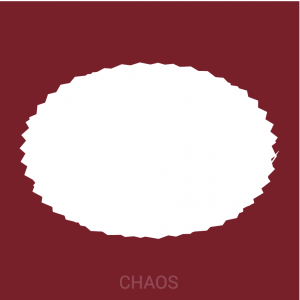
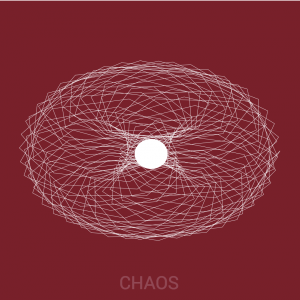
For this project, I wanted curves that combine to create a chaotic feeling. The ellipse in the middle is supposed to represent a ball of string, and make the whole canvas look like the string is “unraveling” from the ball of string (the ellipse in the middle). I used an Astroid curve from the MathWorld site to reference the function. At first, I was confused on how to utilize map(); and constrain(); to explore different curves and its sizes and limits. However, I eventually understood these concepts through this project. Throughout out the project, I was really amazed on how many variations of curves an asteroid that create although I input certain constraints.

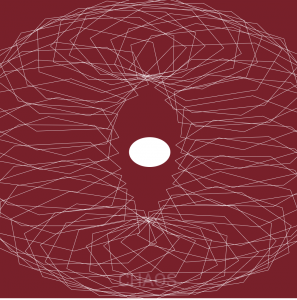
Below are my process work. The top picture shows that I struggled for awhile on how to make the curves show in thin lines. I realized that I had to fill them with background color. The bottom picture is another part of the process. I explored different constrain();.