![[OLD FALL 2018] 15-104 • Introduction to Computing for Creative Practice](../../../../wp-content/uploads/2020/08/stop-banner.png)
/* Jaclyn Saik
Section E
jsaik@andrew.cmu.edu
Project 07
*/

var maxP = 100; //boundary for points plotted by the curve
var chang = 1; //variable ised for flipping orientation of fish curve


function setup() {
    createCanvas(480, 480);
    noStroke();
}

function draw() {
    background("PaleTurquoise");
    textSize(10);
    noStroke();
    fill("LightSeagreen");
    text("click me! yay!", 30, 70);
    text("¡a fish that is math!", 80, 300);
    text("math", 270, 400);
    text("glug....glug", 60, 430);
    text("so interactive!", 350, 30);

    translate(width/2, height/2); //puts axis in center of the canvas
    if (mouseIsPressed) { //sets if statement that inverses fish curve when mouse is pressed
                chang = -1;
            } else {
                chang = 1;
            }
            print(chang);
    drawFishie(); //calls fish function
    drawFishie2();
    drawFishie3();
    drawFishie4();
}

function drawFishie() {
        var x; //x value for fish curve parametric equation
        var y; //y value for fish curve parametric equation
        var a = constrain(mouseY, 20, 450); //constrains a to value between 20 and 450
        var consT = map(mouseX, 0, width, 1, 5); //maps consT so that mouse X plots a number between 1 and 5
        stroke("peachpuff");
        fill("lightpink");

        beginShape();
        for (var i = 0; i < maxP; i++) { //for loop that sets maxiumum points form variable above
            var t = map(i, 0, maxP, 0, TWO_PI);

        //fish curve
        //http://mathworld.wolfram.com/FishCurve.html

        x = (a * cos(t)) - ((chang)*((a*(sq(sin(t))))) / 2); //change varibale inverses curve when mouse is pressed
        y = (a* cos(t) * (consT)*sin(t));  //constant manipulates the height of
        // the curve based on mouse x position
        vertex(x, y);
    }
    endShape(CLOSE);
}

function drawFishie2() { //outline, which is slightly off
        var x; //x value for fish curve parametric equation
        var y; //y value for fish curve parametric equation
        var a = constrain(mouseY, 20, 450); //constrains a to value between 20 and 450
        var consT = map(mouseX, 0, width, 1, 10); //maps consT so that mouse X plots a number between 1 and 5
        stroke("tomato");
        strokeWeight(2);
        noFill();

        beginShape();
        for (var i = 0; i < maxP; i++) { //for loop that sets maxiumum points form variable above
            var t = map(i, 0, maxP, 0, TWO_PI);

        //fish curve
        //http://mathworld.wolfram.com/FishCurve.html

        x = (a * cos(t)) - (.5*(chang)*((a*(sq(sin(t))))) / 2); //change varibale inverses curve when mouse is pressed
        y = (a* cos(t) * (consT)*sin(t));  //constant manipulates the height of
        // the curve based on mouse x position
        vertex(x, y);
    }
    endShape(CLOSE);
}

function drawFishie3() { //outline, which is slightly off
        var x; //x value for fish curve parametric equation
        var y; //y value for fish curve parametric equation
        var a = constrain(mouseY, 20, 400); //constrains a to value between 20 and 450
        var consT = map(mouseX, 0, width, 0, 5); //maps consT so that mouse X plots a number between 1 and 5
        stroke("salmon");
        strokeWeight(8);
        noFill();

        beginShape();
        for (var i = 0; i < maxP; i++) { //for loop that sets maxiumum points form variable above
            var t = map(i, 0, maxP, 0, TWO_PI);

        //fish curve
        //http://mathworld.wolfram.com/FishCurve.html

        x = (a * cos(t)) - (.5*(chang)*((a*(sq(sin(t))))) / 2); //change varibale inverses curve when mouse is pressed
        y = (a* cos(t) * 7*(consT)*sin(t));  //constant manipulates the height of
        // the curve based on mouse x position
        vertex(x, y);
    }
    endShape(CLOSE);
}

function drawFishie4() { //outline, which is slightly off
        var x; //x value for fish curve parametric equation
        var y; //y value for fish curve parametric equation
        var a = constrain(mouseY, 20, 450); //constrains a to value between 20 and 450
        var consT = map(mouseX, 0, width, 0, 6); //maps consT so that mouse X plots a number between 1 and 5
        stroke("orange");
        strokeWeight(5);
        noFill();

        beginShape();
        for (var i = 0; i < maxP; i++) { //for loop that sets maxiumum points form variable above
            var t = map(i, 0, maxP, 0, TWO_PI);

        //fish curve
        //http://mathworld.wolfram.com/FishCurve.html

        x = (a * cos(t)) - (.7*(chang)*((a*(sq(sin(t))))) / 2); //change varibale inverses curve when mouse is pressed
        y = (a* cos(t) * 10*(consT)*sin(t));  //constant manipulates the height of
        // the curve based on mouse x position
        vertex(x, y);
    }
    endShape(CLOSE);
}
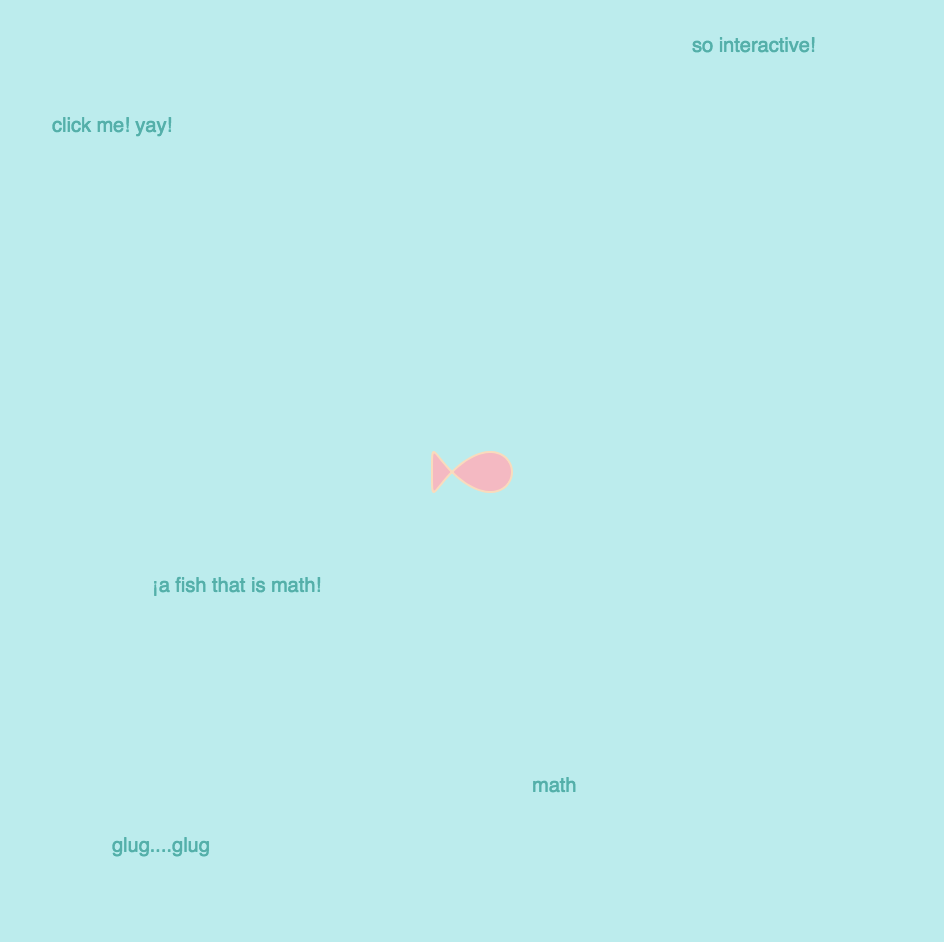
Fish Curve!
For this project, I had to experiment a lot with figuring out a way to build a shape that relied on the equations I gave it. I hadn’t really thought about it before, but we have been creating equations for the for loops we’ve been generating these past 2 weeks, so once I wrapped my head around this concept, I was able to understand how to plug these equations in and turn them into code. I originally played around with a cruciform curve (which I forgot to screenshot!), but after figuring out the fish curve, I wasn’t as inspired by it’s shape. The fish curve, by the way, is a curve that is based off an ellipse’s equation, with a pedal point at a specific point of eccentricity e^2 = 1/2. I had fun manipulating the variables on my various curves so that the different fish outlines took on slightly different characteristics, and adding interactions (click on screen!).