// Catherine Coyle
// ccoyle@andrew.cmu.edu
// Section C
// Project 7  - Curves

// equations taken from http://mathworld.wolfram.com/Hypotrochoid.html

var n = 1;
var h = 2;
var t = 1;
var a;
var b;

function setup() {
    createCanvas(480,480);
}

function draw() {
    background(226, 237, 255);
    // number of 'rotations' is dependent on y
    n = map(mouseY, 0, height, .9, 1.1);
    // size of rotation circles is dependent on x
    h = map(mouseX, 0, width, 2, 4);
    // smaller helper functions below here
    a = aCalc();
    b = bCalc();
    drawHypotochroidShadow(t, a, b);
    drawHypotochroid(t, a, b);
}

// i broke a lot of the heavy math parts into smaller functions
// to make it more manageable
function aCalc() {
    return(2 * n * h / (n + 1));
}

function bCalc() {
    return(((n - 1) * h) / (n + 1));
}

function xPar(t, a, b) {
    var answer = (a - b) * cos(radians(t));
    var cosVal = ((a - b) / b) * t;
    answer = answer + h * cos(radians(cosVal));
    return answer;
}

function yPar(t, a, b) {
    var answer = (a - b) * sin(radians(t));
    var cosVal = ((a - b) / b) * t;
    answer = answer + h * sin(radians(cosVal));
    return answer
}

function drawHypotochroid(t, a, b) {
    stroke(193, 124, 124);
    noFill();
    // loops through entire curve and plot every point
    beginShape();
    for(var i = 0; i < width; i++){
        var x = map(xPar(i, a, b), -4, 4, 0, width);
        var y = map(yPar(i, a, b), -4, 4, 0, height);
        curveVertex(x, y);
    }
    endShape();
}

// same as above but with some offset just to look cool
function drawHypotochroidShadow(t, a, b) {
    stroke(66, 134, 244, 50);
    noFill();
    // loops through entire curve and plot every point
    beginShape();
    for(var i = 0; i < width; i++){
        var x = map(xPar(i, a, b), -4, 4, 0, width);
        var y = map(yPar(i, a, b), -4, 4, 0, height);
        curveVertex(x-4, y-4);
    }
    endShape();
}
This project was kind of hard to get started with but once I wrapped my head around it I found it very cool.
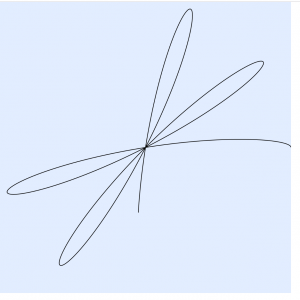
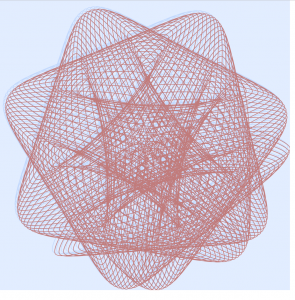
I probably spent a good hour on the mathworld website trying to settle on a curve, but found that a lot of them were too hard to implement. I decided to go with the hypotrochoid shape found here.
If you keep your mouse on the left end of the screen, the curve should stay within the canvas if you want to see an entire design. Otherwise, moving your mouse to the right will kind of ‘zoom in’ to the center of the curve.
It took a lot of experimenting and trial and error to make the program work right, but in the end it produced some nice results.


![[OLD FALL 2018] 15-104 • Introduction to Computing for Creative Practice](wp-content/uploads/2020/08/stop-banner.png)