Alice Cai Looking Outwards 4

http://www.pamelaz.com/carbonsongcycle.html

EXCERPTS OF CARBON SONG CYCLE

Carbon Song Cycle

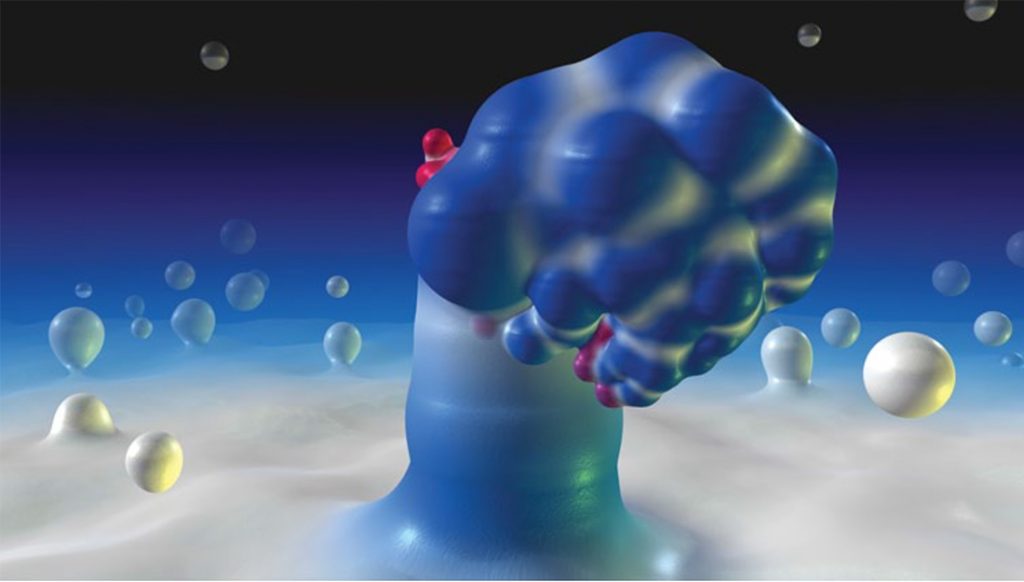
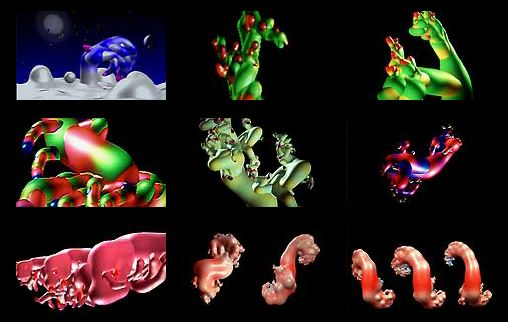
Pamela Z is a composer and performer who worked with media artist Christina McPhee on a project called Carbon Song Cycle. This project was fro a chamber ensemble and expanded cinema. The project reflects the progressions in the Earth’s ecosystem, focusing on the carbon cycle, which is the cycle of carbon through nature and life. Pamela took data on the carbon cycle, environmental balance and imbalance and created a melody inspired by the data. She also created drawings and images inspired by the carbon process, focusing on heat and chemical transformations in the process. She also took video footage from petroleum fields, natural gas locations, and geothermal sites. The melody was written for an ensemble of voice, electronics, viola, cello, bassoon, percussion, as well as an array of video projections. Throughout the melody, sonic material is passed between the players that reflect the video projections of the natural exchange of elements. 

Watching the video, the melody is very mystic and abstract. It is actually pretty intense at moments. The melody rises and falls almost like fire. At some points, it is more melodic, at some points ,it’s like random sounds, metal clanging, and mystic signing. Some points actually have lyrics, like “I’m breathing”. You can kind of sense if some parts are more chemical in contrast to parts that seem to reflect nature.

Alec Albright – Project 04 – String Art

sketch

// Alec Albright
// aalbrigh@andrew.cmu.edu
// Section B
// Project 04


var x1StepSize = 5;
var y1StepSize = 0;
var x2StepSize = 0;
var y2StepSize = -4;
var x1 = 0;
var y1 = 150;
var x2 = 200;
var y2 = 150;


function setup() {
    createCanvas(400, 300);
    background("black");
}
 
function draw() {
    // top left 
    makeCurve("red");

    // top right
    x1 = 400;
    y1 = 150;
    x2 = 200;
    y2 = 150;
    x1StepSize = -5;
    y2StepSize = -4;
    makeCurve("limegreen");

    // bottom left
    x1 = 0;
    y1 = 150;
    x2 = 200;
    y2 = 150;
    x1StepSize = 5;
    y2StepSize = 4;
    makeCurve("yellow");

    // bottom right
    x1 = 400;
    y1 = 150;
    x2 = 200;
    y2 = 150;
    x1StepSize = -5;
    y2StepSize = 4;
    makeCurve("purple");

    // bottom left, top left
    x1 = 0;
    y1 = 225;
    x2 = 100;
    y2 = 225;
    x1StepSize = 2.5;
    y2StepSize = -1.75;
    makeCurve("red");

    // bottom left, bottom left
    x1 = 0;
    y1 = 225;
    x2 = 100;
    y2 = 225;
    x1StepSize = 2.5;
    y2StepSize = 1.75;
    makeCurve("yellow");

    // bottom left, top right
    x1 = 200;
    y1 = 225;
    x2 = 100;
    y2 = 225;
    x1StepSize = -2.5;
    y2StepSize = -1.75;
    makeCurve("limegreen");

    // bottom left, bottom right
    x1 = 200;
    y1 = 225;
    x2 = 100;
    y2 = 225;
    x1StepSize = -2.5;
    y2StepSize = 1.75;
    makeCurve("purple");

    // top left, top left
    x1 = 0;
    y1 = 75;
    x2 = 100;
    y2 = 75;
    x1StepSize = 2.5;
    y2StepSize = -1.75;
    makeCurve("red");

    // top left, bottom left
    x1 = 0;
    y1 = 75;
    x2 = 100;
    y2 = 75;
    x1StepSize = 2.5;
    y2StepSize = 1.75;
    makeCurve("yellow");

    // top left, top right
    x1 = 200;
    y1 = 75;
    x2 = 100;
    y2 = 75;
    x1StepSize = -2.5;
    y2StepSize = -1.75;
    makeCurve("limegreen");

    // top left, bottom right
    x1 = 200;
    y1 = 75;
    x2 = 100;
    y2 = 75;
    x1StepSize = -2.5;
    y2StepSize = 1.75;
    makeCurve("purple");

    // top right, top left
    x1 = 200;
    y1 = 75;
    x2 = 300;
    y2 = 75;
    x1StepSize = 2.5;
    y2StepSize = -1.75;
    makeCurve("red");

    // top right, bottom left
    x1 = 200;
    y1 = 75;
    x2 = 300;
    y2 = 75;
    x1StepSize = 2.5;
    y2StepSize = 1.75;
    makeCurve("yellow");

    // top right, top right
    x1 = 400;
    y1 = 75;
    x2 = 300;
    y2 = 75;
    x1StepSize = -2.5;
    y2StepSize = -1.75;
    makeCurve("limegreen");

    // top right, bottom right
    x1 = 400;
    y1 = 75;
    x2 = 300;
    y2 = 75;
    x1StepSize = -2.5;
    y2StepSize = 1.75;
    makeCurve("purple");

    // bottom right, top left
    x1 = 200;
    y1 = 225;
    x2 = 300;
    y2 = 225;
    x1StepSize = 2.5;
    y2StepSize = -1.75;
    makeCurve("red");

    // bottom right, bottom left
    x1 = 200;
    y1 = 225;
    x2 = 300;
    y2 = 225;
    x1StepSize = 2.5;
    y2StepSize = 1.75;
    makeCurve("yellow");

    // bottom right, top right
    x1 = 400;
    y1 = 225;
    x2 = 300;
    y2 = 225;
    x1StepSize = -2.5;
    y2StepSize = -1.75;
    makeCurve("limegreen");

    // bottom right, bottom right
    x1 = 400;
    y1 = 225;
    x2 = 300;
    y2 = 225;
    x1StepSize = -2.5;
    y2StepSize = 1.75;
    makeCurve("purple");
}

// makes a curve based on any color
// x1, y1, x2, y2, and step sizes must be predefined
function makeCurve(color){
    for (i = 0; i < 41; i ++) {
        stroke(color);
        line(x1, y1, x2, y2);
        x1 += x1StepSize;
        y1 += y1StepSize;
        x2 += x2StepSize;
        y2 += y2StepSize;
        noLoop();
    }
}

Throughout my process of creating this visualization, I had to get more familiar with how exactly the string art is generated in terms of the size of steps in the sequence. Once I got a good feel for that, I was able to utilize my knowledge of the coordinate system to make the same image in a variety of interesting places.

Katrina Hu – Looking Outwards – 04

Weather Thingy

The interface screen that displays the data collected by the sensors.

Weather Thingy is a sounds controller that uses real time climate-related events to control and modify the settings of musical instruments. The device consists of a weather station on a tripod microphone and a custom built controller connected to the weather station. The station has 3 climate sensors including a rain gauge, a wind vane and an anemometer. There is a controller that transforms climatic data into midi data, and can therefore be interpreted by instruments. The purpose of this project was to allow users to listen to the impact of climate on composition.

I admire that it allows users to take the data and use it to turn it into their own creative compositions. This is possible because you can use the device to pre-record the climate data of a certain place at a certain time. The musician can capture moments that he has found inspiring to create new melodies on his own.

Danny Cho – Project 4 – String Art

LineDrawing

// Danny Cho
// changjuc
// Section: A

var rate1 = 0;
var rate2 = 0;
var rate3 = 0;
var rate4 = 0;

function setup() {
  createCanvas(400, 300);

  noStroke(); 
}


function draw(){
	background(0);
	//living vertex with two moving curves (exploration)
	noFill();
	strokeWeight(1);
	for (var i = 0; i <= 20; i++) {
	noFill();
	strokeWeight(1);
	stroke(100);
	beginShape();
	vertex(0, 30 * cos(radians(rate2)));
	quadraticVertex(20 * i, i * 30 * cos(radians(rate2)), 400, 300);
	quadraticVertex(20, i * 30 * sin(radians(rate2)), 0, 20 * i);
	vertex(400, 0);
	endShape();
	}
	
	//first curve: waves horizontally at rate1
	for (var i = 0; i <= 20; i++) {
			stroke('green');
		line(20 * i * cos(radians(rate1)), 0, 0, 300 - (20 * i) * sin(radians(rate1)));
	}
	rate1 = rate1 + .6;
	//second curve: waves horizontally at rate2

	for (var i = 0; i <= 20; i++) {
		stroke('blue');
		line(20 * i * sin(radians(rate2)), 0, 0, 300 - (20 * i) * cos(radians(rate2)));
	}
	rate2 = rate2 + 1;
	//third curve: waves in a clockwise direction
	for (var i = 0; i <= 20; i++) {
			stroke('red');
		line(0, 300 - (20 * i) * cos(radians(rate4)), 20 * i * tan(radians(rate4)), 0);
	}
	rate4 = rate4 + .6;
	//fourth curve: waves of changing strokeweight

	for (var i = 0; i <= 40; i++) {
		if (i%2 == 0) {strokeWeight(5);}
		else {strokeWeight(1);
			
		}
		stroke(200);
		line(400, i * 10 * cos(radians(rate3)), width - (i * 10 * cos(radians(rate3))), 300);
	}
	rate3 = rate3 + 0.8;


}


I wanted to continue to work with constantly changing geometry at an organic rate. The next step might be making a solid form that also morphs in an organic way?

Lauren Park- Looking Outwards -04

“Cycling Wheel” performance (2017) by Keith Lam, Seth Hon and Alex Lai

“Cycling Wheel” is inspired by Marcel Duchamp’s Bicycle Wheel, but takes this project on a new level of interactive performance that creates light and music. Using the mechanics of this instrument, the sound and visuals are generated by using a software made from computational language called “Processing”, along with three other units that control light bean, music, and LED strips.

I found it really impressive and interesting that the artists chose to take Duchamp’s sculptural piece and transform it into a new way of experimenting with the bicycle wheels and add another element of audio to it as well. Inspired by a very physical, tangible artwork, these artists create abstract patterns using lights and smoke that really made this experience exciting. What is important is that these artists did not only create an interactive instrument, but also used it to hold a performance for an audience.

Ankitha Vasudev-Looking Outwards-05

Growth: Mysterious Gallery (1983) is a five-minute long animation sequence that was created by Yoichiro Kawaguchi – an artist who became popular for his unique style of art using computer graphics.

In this project, Kawaguchi created a self-organizing, procedural, modelling algorithm that could make many complex life forms. The inspiration for this project was natural and organic objects that exhibit repetitive patterns, such as shells, claws and spiraling plants. Kawaguchi wanted to create an algorithm to recreate these forms artistically. 

A scene from Growth:Mysterious Gallery

I admire this artist and project because of how realistic it’s 3D animation is. Additionally, this technique was one of the first of its kind. Kawaguchi used two process related to image rendering to create this animation: ray tracing and metaballs. Ray tracing defined the color to be rendered in order to add depth to the 3D image. Metaballs were first used by Kawaguchi to represent organic looking, n-dimensional objects. 

After this project, Kawaguchi continued to produce animated short films using 3D computer graphics. Some of his other notable works include Embryo(1988), Gigalopolis(1995) and Cytolon(2002).

Various clips from Growth: Mysterious Galaxy, 1983
Kawaguchi explaining the idea behind his animations

Janet Peng-LookingOutwards-04

Video showing the project Sorting by Ren Yuan

The project Sorting by Ren Yuan provides an innovative intersection between sound, visualization, and algorithmic thinking. The project represents different sorting algorithms using both visuals and sounds. These pair well together to increase the appeal of the sorting algorithm. As well, it makes sorting seem very technical and complicated. I really like this project because it uses sound in a way I never expected. Sorting seems very far detached from the world of “Art and Music” so I found it surprising that this project merged the two. I believe there are three animations representing the sorting in progress. As well, I believe the sounds represent different parts in the sorting process. For example, the short beep-y sounds probably represent a comparison between two numbers being made the long swooping sound probably represents that the sorting has been completed. Using the sorting algorithm of choice, these visuals and sounds are probably mapped to different steps as the computer loops through the algorithm. It’s clear that the creator is from a more technical field because of the way the visuals and sounds end up being represented. I believe they do not represent sorting in a way that can be understood by someone without prior exposure. Therefore, the creator might have designed this with a specific audience in mind.

Emma N-M-Project-04(String Art)


stringArt1

/* 
Emma Nicklas-Morris
Section B
enicklas
Project-04
String Art
*/

var x1StepSize = 4;
var y1StepSize = 1;
var x2StepSize = -2;
var y2StepSize = -20;
var x1;
var x2;
var y1;
var y2;


function setup() {
    createCanvas(400, 300);
    background("black");
    x1 = 0;
    y1 = 0;
    x2 = width/3 + 100;
    y2 = height/3 + 50;


}
 
function draw() {
    
    for (var i = 0; i < 350; i += 5) {
        push();
        translate(width/2, height);
        stroke(23, 233, 250);
        line(x1, y1, x2, y2);
        x1 += x1StepSize;
        y1 += y1StepSize;
        // x2 += x2StepSize;
        // y2 += y2StepSize;
        pop();

        stroke("hotpink");
        push();
        translate(width, height/2);
        rotate(degrees(90));
        line(x1, y1, x2, y2);
        // x1 += x1StepSize;
        // y1 += y1StepSize;
        x2 += x2StepSize;
        y2 += y2StepSize;
        pop();

        push();
        translate(0, 0);
        rotate(degrees(10));
        stroke("yellow");
        line(x1, height, width, y2);
        x1 += x1StepSize;
        pop();

        if (i % 25 === 0) {
            stroke("limegreen");
            line(0, y1, width-x2*2, height);
        }
    

    }

    
}

I started with playing around with different x and y positions, but then I didn’t like how static and boring it looked. So I moved to making circles with only lines.

stringArt2

/* 
Emma Nicklas-Morris
Section B
enicklas
Project-04
String Art
*/


var midpoinX;
var midpointY;
var r;
var ai;
var slope;
var b;
var x3;
var y3;
var x4;
var y4;
var k; 
var cosAg;
var sinAg;
var sinAi;
var scaledR;


function setup() {
    createCanvas(400, 300);
    

}
 
function draw() {
    background("black");

    var maxInc = 90; // maximum step increase in the for loop
    var minInc = 3; // minimum step increase in the for loop
    var d = (maxInc - minInc)/width; // value to change mouse position to a smaller value

    // keeps the mouse value inside the canvas
    if (mouseX >= width) {
        mouseX = width;
    }
    else if (mouseX < 0) {
        mouseX = 0;
    }

    if (mouseY > height) {
        mouseY = height;
    }
    else if (mouseY < 0) {
        mouseY = 0;
    }

    var r1 = mouseY/6 + 50; // as mouseY increases, radius increases (max radius = 100, min radius = 50)
    var r2 = 100 - mouseY/6; // as mouseY increases, radius decreases (max radius = 100, min radius = 50)
    var change1 = int(d * mouseX) + minInc; // mouseX changes the amount of lines to make the cirlce (max lines = 120, min lines = 4)
    var change2 = maxInc - int(d * mouseX); // mouseX changes the amount of lines to make the cirlce (max lines = 120, min lines = 4)
    
    // draws pink circle
    push();
    translate(width/3, height/2);
    circles(r2, 8, change1, "hotpink");
    pop();

    // draws light green circle
    push();
    translate(2 * width/3, height/2);
    circles(r1, 8, change2, "lightgreen");
    pop();

    // draws yellow circle
    push();
    translate(width/6, height - change1);
    circles(r1, 8, change1, "yellow");
    pop();

    // draws blue circle
    push();
    translate(width - change2, height/6);
    circles(r2, 8, change2, "aqua");
    pop();

} 


function circles(r, k, inc, hue) {
    for (var ag = 0; ag <= 360; ag += inc) {
        angleMode(DEGREES);
        ai = 90 - ag; // 3rd angle in the triangle created from the tangent line and x axis
        cosAg = cos(ag);
        sinAg = sin(ag);
        sinAi = sin(ai);
        scaledR = k * r; // makes the line longer (or shorter)
        midpointX = r * cosAg; // line's midpoint x position
        midpointY = r * sinAg; // line's midpoint y position

        if ((ag === 0) || (ag === 180)) { // verticle lines
            x3 = r * cosAg;
            y3 = -scaledR;
            x4 = r * cosAg;
            y4 = scaledR;
        }

        else if ((ag === 90) || (ag === 270)) { // horizontal lines
            x3 = -scaledR;
            y3 = r * -sinAg;
            x4 = scaledR;
            y4 = r * -sinAg;
        }

        // not a verticle or horizontal line
        // uses geometry, law of sines, and unit circle to get end points of line
        else {
            slope = ((r * -sinAg) / (r * cosAg - (r / sinAi)));
            b = -slope * (r / sinAi);
            x3 = r * cosAg - scaledR;
            y3 = (slope * x3) + b;
            x4 = r * cosAg + scaledR;
            y4 = (slope * x4) + b;
        }

        stroke(hue);
        line(x3, y3, x4, y4);
    }
}

It took a while to get the lines to move around tangential to the circle. There was a lot of math and geometry that I needed a refresher on to get the lines to make a circle. Once the circles were drawn statically, I then used the mouse position to make the circle change in various ways. 

Janet Peng Project 04 – String Art

jjpeng project 4

function setup() {
    createCanvas(400, 300);
}

function draw() {
	// outer curves
	drawCurve(0, 0, 0, 200, 12, 6, 40, 'upRight', monochromeColor());
	drawCurve(width, 0, width, 200, 10, 5, 60, 'upLeft', monochromeColor());
	drawCurve(width, 100, width, height, 8, 4, 60, 'downLeft', monochromeColor());
	drawCurve(0, 100, 0, height, 6, 3, 80, 'downRight', monochromeColor());

	// inner curves
	drawCurve(80, 80,
			  80, height / 2,
			  10, 6, 13, 'upRight', monochromeColor());
	drawCurve(width - 80, 80,
			  width - 80, height / 2,
			  8, 5, 15, 'upLeft', monochromeColor());
	drawCurve(width - 80, height / 2,
			  width - 80, height - 80,
			  6, 4, 19, 'downLeft', monochromeColor());
	drawCurve(80, height / 2, 80,
			  height - 80, 5,
			  3, 24, 'downRight', monochromeColor());

	// curves in the middle
	drawCurve(width / 2, 0, width / 2, height, 20, 10, 40, 'upRight', monochromeColor());
	drawCurve(width / 2, 0, width / 2, height, 20, 10, 40, 'upLeft', monochromeColor());
	drawCurve(width / 2, 0, width / 2, height, 20, 10, 40, 'downLeft', monochromeColor());
	drawCurve(width / 2, 0, width / 2, height, 20, 10, 40, 'downRight', monochromeColor());

	noLoop();
}

function monochromeColor(){
	return color(255, random(120, 200), random(120, 200))
}

// larger xstep = larger width
// larger ystep = larger height
function drawCurve(x1, y1, x2, y2, xstep, ystep, numOfLines, direction, color){
	var i = 0
	for (i = 0; i < numOfLines; i ++){
		stroke(color);
		line(x1, y1, x2, y2);

		if (direction === 'downRight'){
			// x1 stays the same, y1 increases
			// y2 stays the same, x2 increases
			y1 += ystep;
			x2 += xstep;
		} else if (direction === 'upRight'){
			y2 -= ystep;
			x1 += xstep;
		} else if (direction === 'downLeft'){
			y1 += ystep;
			x2 -= xstep;
		} else if (direction === 'upLeft'){
			y2 -= ystep
			x1 -= xstep
		}
	}
}

I started by experimenting with curves and how controlling what and how much I added and subtracted from affected the curve (its direction, density, width, height, etc.). This led me to writing a function to draw a curve given different parameters (x1, y1, x2, y2, xstep, ystep, number of lines, direction, color). Finally, I sketched out some curve designs and recreated it using the function I wrote.

lee chu – looking outwards – 04

Porter Robinson, a renown EDM artist is also known for amazing visuals at his live performances. His visuals usually consist of animation-esque landscapes and futuristic cityscapes which shift and morph to the music. Some of his visuals seem more computational than others, but I assume that most of them are animated completely digitally. The clip below was recorded during Porter’s Worlds tour probably last year or the year before. Porter Robinson’s personal tastes and artistic sensibilities translate directly to his visuals, as they seem to be inspired greatly by anime and consist of pastel colors.