Lauren Park – Project 04 – String Art

sketch

function setup() {
  createCanvas(400, 300);
  strokeWeight(0.75);
}

function draw() {
  background(10);
  
  for(var a = 0; a < 400; a+=8){
    stroke('#3FABA2');
    line(a, mouseY, 400, a);
  }
  
  for(var b = 0; b < 400; b +=8){
    stroke('#5AE6AC');
    line(b, mouseX, 0, b)
  }
  
  for(var c = 0; c < 400; c +=8){
    stroke(250);
    line(c, mouseX, b, 300)
  }
  
  for(var d = 0; d < 400; d +=8){
    stroke('#D0E778');
    line(d, mouseY, c, 300);
  }
    
  
}

I was interested in exploring how I can create the movement of waves with curves. By using different curve shapes and different colors and have them combine by moving the mouse and flow like a water ripple.

Mihika Bansal – Project 04 – String Art

sketch

//Mihika Bansal 
//mbansal@andrew.cmu.edu 
//Section E 
//Project 4

var x1Step = 5; 
var y1Step = 5; 

function setup() {
    createCanvas(400, 300);
   
  }

function draw() {

    background (255); 
    fill(0); 
    rect(50, 0, 300, 300); 

    stroke(255, 251, 217); 
    for(var j = 1; j <= 30; j++){
        line(50, 0 + y1Step * j, width / 2 - x1Step * j, 0); 
    } // curve with flats on left and top in the top left curving downwards 
    for(var j = 1; j <= 30; j++){
        line(50, height - y1Step * j, width / 2 - x1Step * j, height); 
    } // curve with flat on left and bottom, bottom left, curving upwards 
    for(var j = 1; j <= 30; j++){
        line(width - 50, height / 2 - y1Step * j, width - 50 - x1Step * j, 0); 
    } // curve with flat on top and right, top right, curving downwards 
    for(var j = 1; j <= 30; j++){
        line(width - 50, height / 2 + y1Step * j, width - 50 - x1Step * j, height); 
    } // curve with flat on right and bottom, bottom right, curving upwards

    stroke("white"); 
    for(var i = 1; i <= 30; i++){
        line(width / 2, 0 + y1Step * i, width / 2 + x1Step * i, height / 2); 
    } //curve starting in middle on top right, curving upwards, flat side is in middle of canvas
    for(var x = 1; x <= 30; x++){
        line(width / 2, height - y1Step * x, width / 2 + x1Step * x, height / 2); 
    } // curve starting in the middle on bottom right, curving downwards, flat sides are on the middle of canvas 
    for(var x = 1; x <= 30; x++){
        line(50 + x1Step * x, 0, width / 2, 0 + y1Step * x); 
    } //curve on top left , with flat part on top and middle, curving downwards
    for(var x = 1; x <= 30; x++){
        line(50 + x1Step * x, height, width / 2, height - y1Step * x); 
    } // curve on bottom left, with flat on bottom and middle, curving downwards

    stroke (194, 237, 231)
    for(var j = 1; j <= 30; j++){
        line(width / 2, 0 + y1Step * j, width / 2 - x1Step * j, height / 2); 
    } // curve in top left, with flat part in middle on both sides, curving upwards
    for(var j = 1; j <= 30; j++){
        line(width / 2, height / 2 + y1Step * j, width / 2 + x1Step * j, height); 
    } // curve  in bottom left, with flat in middle, curving downwards 
    for(var j = 1; j <= 30; j++){
        line(50 + x1Step * j, height / 2, width / 2, height / 2 + y1Step * j); 
    } // curve with flat in the middle and bottom, in the bottom right, curve upwards
    for(var j = 1; j <= 30; j++){
        line(width / 2 + x1Step * j, 0, width / 2, height / 2 - y1Step * j); 
    } // curve with flats on the top and the middle, in the top right, curve downwards 

    stroke(252, 204, 212); 
    for(var j = 1; j <= 30; j++){
        line(50, height / 2 - y1Step * j, width / 2 - x1Step * j, height / 2); 
    } // flat on the left side and the middle, curve upwards, in the top left 
    for(var j = 1; j <= 30; j++){
        line(50, height - y1Step * j, 50 + x1Step * j, height / 2); 
    } // flat on the left and the middle, in the bottom left, curve downwards
    for(var j = 1; j <= 30; j++){
        line(width - 50, height / 2 - y1Step * j, width / 2 + x1Step * j, height / 2); 
    } // flat on the middle and middle, in the top right, curving upwards
    for(var j = 1; j <= 30; j++){
        line(width - 50, height - y1Step * j, width - 50 - x1Step * j, height / 2); 
    } // flat on the right and the middle, in the bottom right, curbing downwards 
 
}

I really enjoyed this project. I have made string art before by hand using the actual string and nails and wood, so it was interesting making it through the computer this time.

Angela Lee – Project – 04

sketch

/*
 * Angela Lee
 * Section E
 * ahl2@andrew.cmu.edu
 * Project 4 String Art
 */

function setup() {
    createCanvas(400, 300);
    background("black");
}

function draw() {
    spacing1 = 40;
    spacing2 = 10;
    spacing3 = 5;
    red = mouseX;
    green = mouseX;
    blue = mouseY

    // LOOP FOR OUTERMOST STRINGS
    // the strings span the boundary of the canvas
    for(var a = 0; a <= 400; a += spacing1){
        // left bottom strings
        stroke(red, 0, 162);
        line(0, a, a, 300);

        // right top strings
        stroke(153, green, 0);
        line(400, a, a, 0);
    }

    // LOOP FOR GREEN, BLUE STRINGS
    // the strings are contained by the outermost strings 
    for(var b = 0; b <= 200; b += spacing2){
        stroke(0, 187, mouseY);
        // left top strings
        line(100 + b, 50, 100, 250 - b);
        // right top strings
        line(100 + b, 250, 300, 250 - b);
    }

    // LOOP FOR INNERMOST SQUARE
    // the strings are contained within a box 
    // the box specs: rect(150, 100, 100, 100)
    for(var a = 0; a <= 100; a += spacing3){
        // bottom left
        stroke(red, green, 162);
        line(150, 100 + a, 150 + a, 200);

        // top left
        stroke(150, green, blue);
        line(150 + a, 100, 150, 200 - a);

        // top right
        stroke(red, 150, blue);
        line(150 + a, 100, 250, 100 + a);

        // bottom right
        stroke(red, 100, blue);
        line(250, 100 + a, 250 - a, 200);

    }


}

For this project, I wanted to make a composition that had a fixed form but some element that was controlled by the user. I stuck to a strict geometry that relied on square and rectangle boundaries but allowed the colors of the strings to change based on the users’ mouse position.

Some of my notes when planning: first, it took me a while to understand how to program the string curves nicely. Then, I planned out the composition I wanted in my final piece.

Jai Sawkar – Looking Outwards – 04

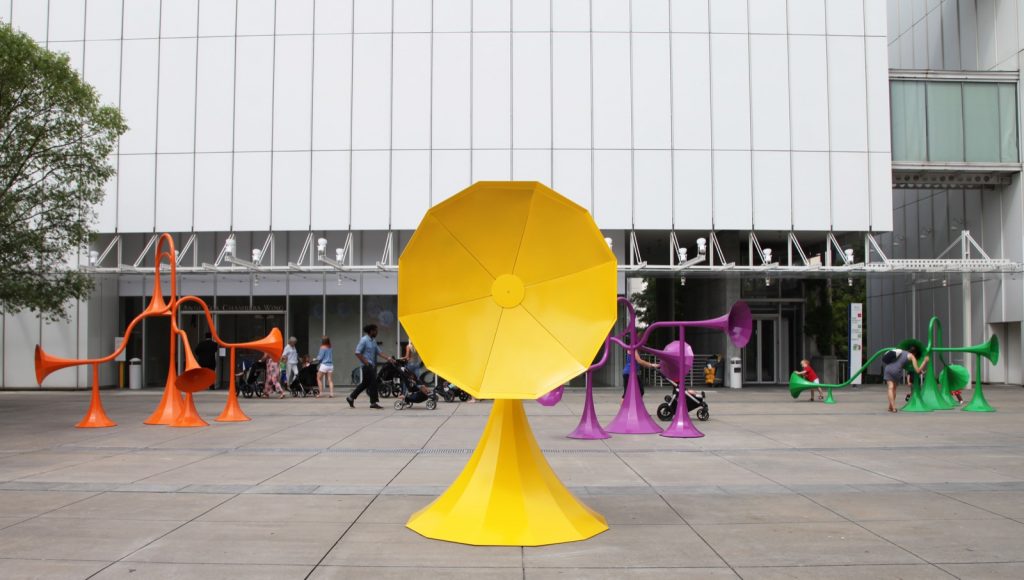
Sonic Playground is an outdoor sound installation that features ingenious, colorful sculptures that modify and transmit sound in unusual, engaging and playful ways. Atlanta, GA

This week, I found an outdoor sound installation by Yuri Suzuki: Sonic Playground. This outdoor sound installation, located in Atlanta, is made up of 6 interactive sound sculptures that manipulate sound based on where you are in the installation. Using grasshopper, a Rhino 3D Model plugin, Suzuki computationally designed these installations using 3D ray tracing in order to simulate how sound can travel. Through this, users can interact with one another through individual installation.

Having experience in Grasshopper, it is super cool to see the possibilities with not only grasshopper, but with how you can use computational design to not only design material, but design products that are made to interact with people’s senses.

Link to Article

Alice Cai Project 4

sketch

//Alice Cai
//alcai
//project#4
//Section E

//global variables
var x;
var y;
var aY;
var aX;

function setup() {
    createCanvas(480, 240);
    strokeWeight(3);
}

function draw() {
//background
    background(200) ;
    strokeWeight(1);

//defining variables 
    aX = mouseX
    aY = mouseY
    x = x * aY
    y = y * aX

//orange lines

    stroke('orange');
    for (var y = 100; y < 10000; y += 5) {
    line(y, aY, width - aX, y);
    line(y, aY, height - aY, y);

    }
//pink lines
    stroke('pink');
    for (var x = 100; x < height; x += 5) {
    line(x, aX, x, aY);
    line(aY, x, x, aX);

    }
//blue lines
    stroke('blue');
    for (var y = 100; y < width; y += 5) {
    line(aX, x, y, aY);
    line(aX, x - y - x, y, aY);

    }
//color changing
    stroke(mouseX,mouseY,mouseY);
    for (var y = 100; y < width; y += 5) {
    line(aX, x - aX, x, aY);
    line(aX, y - aX, y, aY);
    line(aY, y - aX, y, aX);
    }

}

This is my string art. At first, all my curves looked the same because I only used an i variable. After I added more the drawing became more dynamic. Each curve is drawn by a series of lines that are slightly shifted using a for loop and small increments that tilt the line and form a curve.

Stefanie Suk – Project 04 – String Art

sketch

//Stefanie Suk
//15-104 D
//ssuk@andrew.cmu.edu
//Project-04: String Art

var x = 75
var y = 500

function setup() {
    createCanvas(640, 480);
    background(171, 186, 255);
}

function draw() {
    stroke(255);
//    for (var i = 10; i <= 640; i += 15) 
//        line(width/2, 0, i, y)
    for (var i = 10; i <= 640; i += 30)
        line(width - i, 0, 0, height)
    for (var i = 10; i <= 640; i += 30)
        line(0, height, 640, i)
    stroke(150);
    for (var i = 10; i <= 640; i += 15)
        line(width/2, i, width/2 + i, height)
    for (var i = 10; i <= 640; i += 15)
        line(width/2, i, width/2 - i, height)
    for (var i = 0; i <= 300; i += 10)
        line(width - i, 0, 0, i)
    for (var i = 0; i <= 300; i += 10)
        line(i, height, width, height - i)
    stroke(10);
    for (var i = 10; i <= 640; i += 70)
        line(0, height/2, 640, i)
    for (var i = 10; i <= 640; i += 70)
        line(640, height/2, 0, i)

}

For this project, I tried to incorporate different possible string arts I can create into one single piece of work. By adding straight, curved, twisted lines, I explored the varieties of lines in string art and tried to create unity with the different lines. 

Stefanie Suk – Looking Outwards – 04

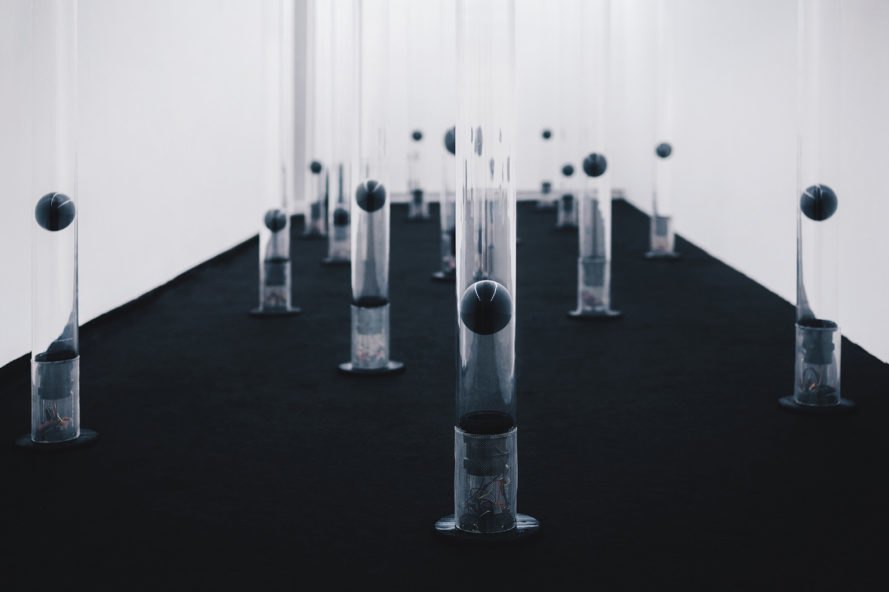
Image of CarbonScape in Process 

CarbonScape, a kinetic data sound installation that incorporates both traditional and futuristic concepts of technology, is a work by a Chinese artist Chris Cheung. This work consists of 18 different tracks of synthesized sound samples that visualizes the carbon dioxide levels from data received by NOAA (National Oceanic and Atmospheric Administration). Inspired by the artist’s natural environment, the installation is designed like a series of bamboo forest with black spheres inside representing the carbon dioxide levels in the atmosphere. This black sphere changes its position from top to bottom (to show the changes in carbon dioxide levels) as the sounds are emitted under the bamboo-like tube. I am deeply admired by this installation because of the combination of man-made object (sphere & tube) and natural energy (sound) to create a single piece of art that represents our world’s natural disaster. I know that the data from the NOAA that is computed to automatically send its information to the installation generated this artwork. I can see from the installation that the artist pursues minimalistic design, which also attracted me because the simple black and white structure made the installation easy to see/read and also made it visually appealing. 

Demonstration Video of CarbonScape 

Sammie Kim – Project 04 – String Art


sketch

//Sammie Kim
//sammiek@andrew.cmu.edu
//Section D
//Project 4

function setup() {
    createCanvas(400, 300);
    //Variables to modify the coordinates of line sets
    //pink lines set a
    aY1Gap = 50;
    aY2Gap = 0.9;
    //light blue lines set b
    bY2Gap = 0.5;
    //Purple lines set c
    cY1Gap = 300;
    cX2Gap = 100;
    cY2Gap = 0.8;
    //Green lines set d
    dY1Gap = 200;
    dY2Gap = 0.75;
}

function draw() {
    background("black");
    //for loop to create series of lines with increments of 10
    for (var i = 0; i < 400; i += 10) {
        //Red line sets a
        stroke(255, 112, 112);
        line(i, mouseY / 2 - aY1Gap, width, i * aY2Gap);
        //light blue lines sets b
        stroke(181,255,221);
        line(i, mouseY, 0, i * bY2Gap);
        //Purple lines sets c
        stroke(122, 114, 240);
        line(i, -mouseY + cY1Gap, width / 3 + cX2Gap, i * cY2Gap);
        //Green lines set d
        stroke(28, 151, 45);
        line(i, -mouseY + dY1Gap, width, i * dY2Gap);
    }
  }

This project was challenging as I had to visualize the lines coordinates to create the curves. Sketching the picture first really helped me, since I got to picture the starting and ending points. By utilizing the “for function” to repeatedly create the line sets, I realized once more how much more convenient it is rather than writing a ton of line codes. 

Sammie Kim– Looking Outwards – 04

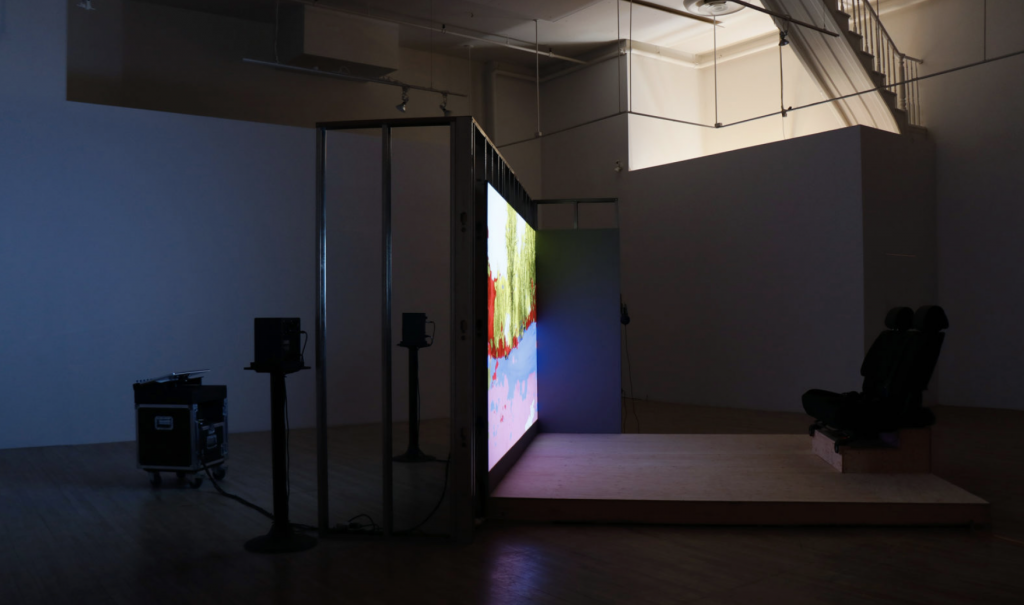
Interaction between audience and the installation (Quevillon)

“Algorithmic Drive” is an interactive installation created by Francois Quevillon, who was inspired by dash cam recordings and autonomous cars. Generated with a database of recordings from the car’s built-in camera, the captured videos are synchronized with information, including speed, location, orientation, altitude, as well as temperature of various motor sensors. This mechanism utilizes data analysis and computer vision algorithms that statistically sorts the content, then fabricates endless videos made with specific parameters related to the car’s activity and its current location. The interactive aspect comes with a controller and screen that allows the audience to engage and maneuver the system. I found it inspiring how the artist gained his creative spark from a technological venture, and developed an art piece that raises many ethical questions in our minds. According to Quevillon, he wanted to signify the issue of technical, legal, and moral issues that are involved in autonomous vehicles that can function without human intervention by “feeding and following algorithmic procedures” (Quevillon). As such, spontaneous events can always occur, especially road accidents due to unexpected causes.

Algorithmic Drive installation (Quevillon)

Algorithmic Drive – Spectacular car(au)tonomy

Carly Sacco – Project 04 – String Art

sketch

//Carly Sacco
//Section C
//csacco@andrew.cmu.edu
//Project 4

var x1 = 5;
var x2 = 9;
var y1 = 5;


function setup() {
	createCanvas(400, 300);
}

function draw() {
	background(0);
	
	for (var i = x1; i < 400; i += y1){
		
	  //blue curves
	  stroke(95, 158, 176); 
	  line(i + 200, 300, i * x2 + mouseX, i); 
	  line(i + 200, 300, -i * x2 + -mouseX, i);
	  
	 //green
	  stroke(109, 199, 111);
	  line(i, 0, x1 * 80, i);
	  
	 //orange
	  stroke(214, 56, 39); 
	  //line(i + 400, 0,  -x2 * 10, i * 5); 
	  line(i, 300,  0, i);
	 
	  //purple
	  stroke(173, 142, 212);
	  line(i * x1, y1, 500, i * 10);
	  
	} 
}


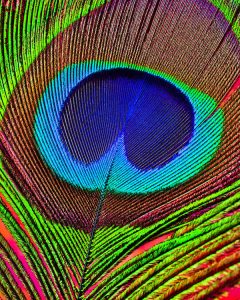
Once I had made the blue curves that work oppositely of each other they reminded me of wings of a bird. I then decided to make the other curves mimic the shape of a peacock’s feather and chose the colors accordingly.