Mihika Bansal – Final Project

sketch

//Mihika Bansal 
//mbansal@andrew.cmu.edu 
//Section E 
//Project 12

var ripples = []; 
var color = []; 
var b = 238;
var g = 238;  
//color for background 


function setup() {

    createCanvas(480, 480); 

}
   
function draw() {

	background(175, g, b); // randomization of background

	if (mouseIsPressed){ 
		//when new ripple is created
		var newRip = makeRipple(mouseX, mouseY); 
		//ripple based on mouse position
		ripples.push(newRip); 
		b = random(200, 250); 
		g = random(200, 240); 
		//background color changes based on mouse color
	}
   	
   	for(var i = 0; i < ripples.length; i++){
   		//for the length of the array draw each of the ripples 
   		var r = ripples[i]; 
   		r.display(); 
   		//display the ripple
   	} 
   	if(ripples.length > 35){ 
   	// makes it so that when ripples are displayed, they will be removed from array 
   		ripples.shift();
   		ripples.shift();
   		ripples.shift();
   		ripples.shift();//removes 4 ripples  
   	}

}

//making the ripples objects 
function makeRipple(rX, rY){
	var ripple = { x: rX, 
				y: rY,
				diam: 0, 
				out: 0,  
				fade: 0, 
				colorR: generateRandom(0, 75), 
				colorG: generateRandom(100, 200), 
				colorB: generateRandom(50, 200), //color stays in blue range
				display: drawRipple}; 

	return ripple; 
}

function drawRipple(){ // how to display ripple 

	for (var i = 0; i < 5; i++){
		 this.diam = this.out - 25 * i; // makes circle size increase

		if(this.diam > 0){ 
			// fading out fill and stroke 
			this.fade = map(this.diam, 0, 300, 255, 100); 
			//mapping the fill to part of the canvas, so it fades in a certain time 
			push(); 
			strokeWeight(1); 
			//stroke will be background color 
			stroke(175, g, b, this.fade);  
			fill(this.colorR, this.colorG, this.colorB, this.fade);
			//fill is based on the color of the ripple object  
			ellipse(this.x, this.y, this.diam); 
			//multiple ripples made from the ellipse 
			pop(); 
		}

	}
	// when more ripples in the array/screen, more waves and speed 
	if(ripples.length > 25){ 
		this.out += 4; // amount ripple changes 
	}
	else {
		this.out += 2; //slower speed of ripples 
	}
	 
	
}

function generateRandom(x, y){
	var r = floor(random(x, y)); 
	//creates random variable + returns it 
	return r;
}


For my final project, I created a program that creates and animates ripples based on where your mouse touches. The color of the ripples changes randomly but stays in the blue range. The background color also changes randomly. The ripples fade using the map function, and if there are more ripples on the water, they move together faster.

Mihika Bansal – Project 12 – Proposal

For the final project, I want to create an animation that changes based on the way that the user interacts with the screen. I want to specifically create ripples in water that mimic actual ripples in water.

I will also specifically work to create a strong flat graphic visualization with those, and create a strong graphic look. The ripples will form when the user clicks on the screen and ripple out a random amount, and depending on where the user clicks that spacing of the ripples will be different. The types of colors that the ripples form in will also depend on where the user clicks on the screen. These ripples will also fade out in the manner that ripples do in the water, based on a certain amount of time.

The background will also change slightly based on the position of the mouse, which will help create a different look.

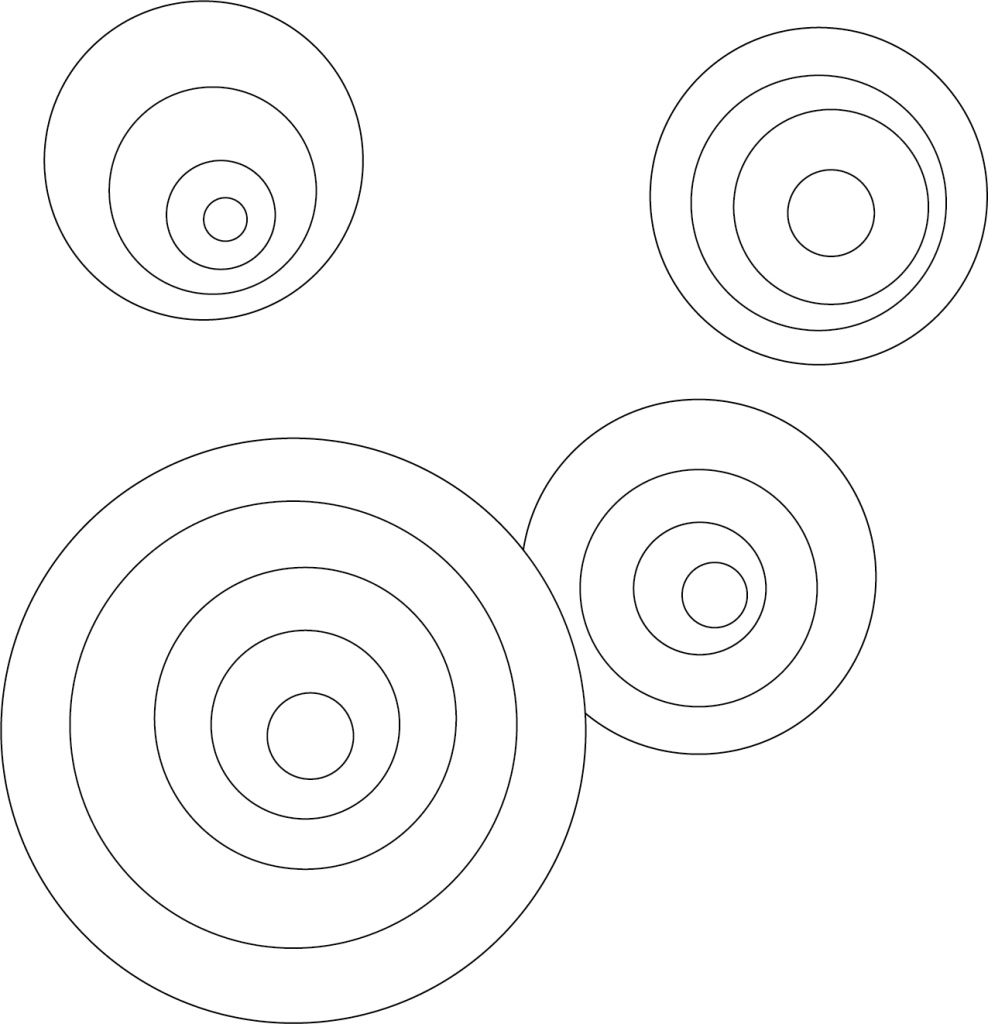
Sketch of what the space looks like

Mihika Bansal – Looking Outwards – 12

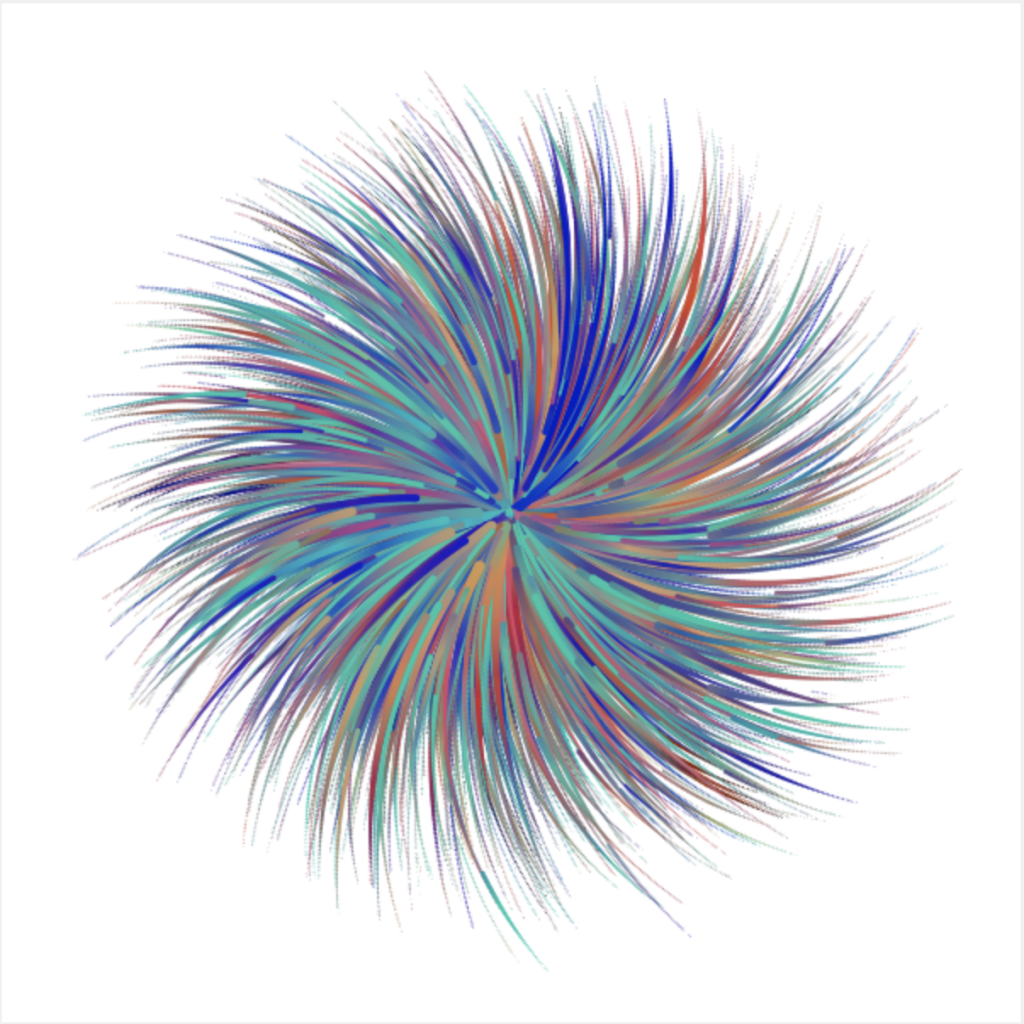
For the final project I want to play with creating animations based on the manner in which the user interacts with the keyboard and the mouse. So I am looking specifically at artists that have interesting styles in the manner that they create work. The first project that I am looking at is by an artist: Carlos de Oliveira Junior. The project is a generative flower piece, and many of his works resemble this style of work. I think his usage of color and imagery is very strong which I find to be interesting.

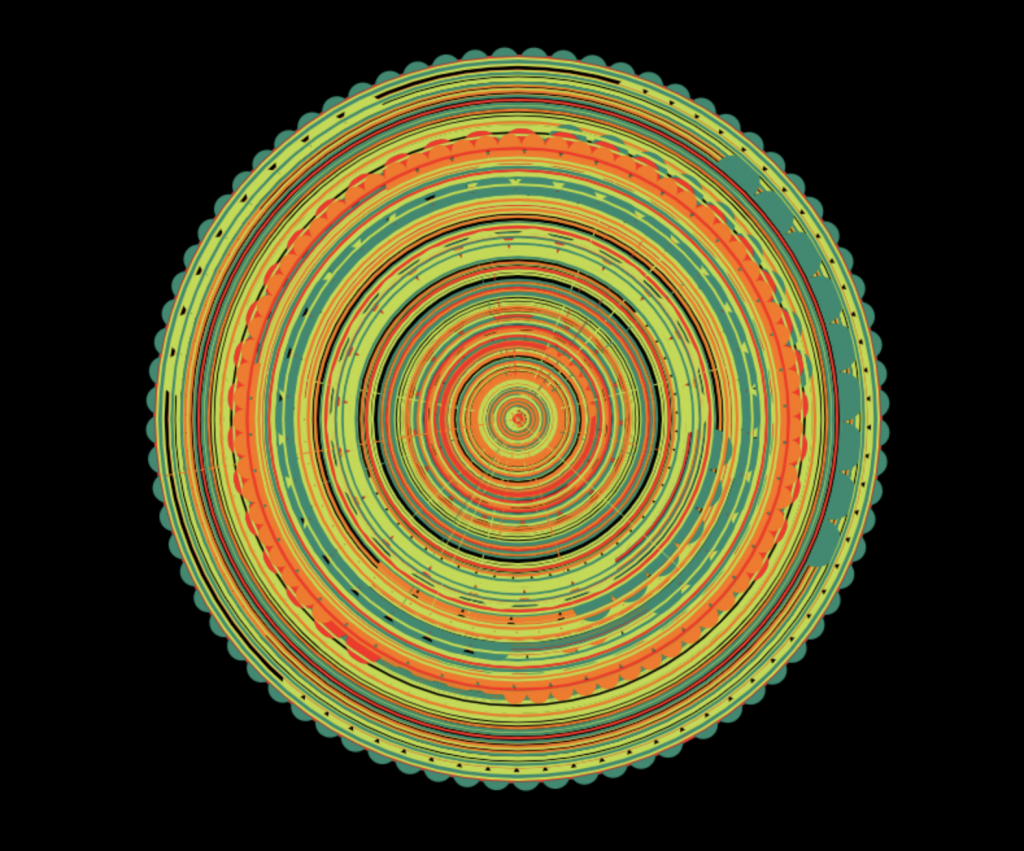
The second artist I am looking at I Benedikt Gross. This artist is very interesting because he uses data to create specific interesting visualizations. It isn’t apparent that Oliveira uses specific data to create his visualizations, he just has a strong visual sense. The project by Gross that I think is particularly interesting is “All Roads Lead to Rome.”

486.713 routes to Rome, 120cm × 80cm, lambda print / interactive web map
All Roads lead to Rome Image

The project has a strong visual sense, but uses data and a space that people are familiar with to create an image and feeling.

So these are the two artists that I am interested in using as inspiration for my final project for this class.

Mihika Bansal – Project 11 – Landscape

sketch

//Mihika Bansal 
//mbansal@andrew.cmu.edu 
//Section E 
//Project 9

var bubbles; 
var move = 5; 
var cx = 100; //starting location of clouds
var cy = 100; 
var clouds = []; 
var ripples = []; 
var terrainSpeed = 0.0005; 
var terrainDetail = 0.005; 

function setup() {

    createCanvas(480, 480); 
    frameRate(4); //slowed down for ripples 

    //initial display of clouds  
    for(var i = 0; i < 3; i++){
    	var cX = random(width); 
    	var cY = random(75, 150); 
    	clouds[i] = makeClouds(cX, cY); 

    }

}
   
function draw() {
	background("#F05353");

	//draw sun
	noStroke(); 
	fill("#F7915B");
	ellipse(width / 2, height / 3, 125, 125);  

	var mountain1 = mountains("#E2BE9A", height * 0.20, height * 0.65, 4); //backmost mountain
	var mountain2 = mountains("#EFAD6C", height * 0.37, height * 0.65, 2); // middle ground mountains 
	var mountain3 = mountains("#EF8F30", height * 0.50, height * 0.65, 3); //foreground mountains 


	//draw ocean 
	noStroke(); 
	fill("#006160"); 
	rect(0, height * 0.65, width, height * 0.35); 

	//draw sun reflection 
	noStroke(); 
	fill(250, 103, 71, 100); 
	arc(width / 2, height * 0.65, 125, 125, 0, PI, OPEN);

	//draw ripples that are changing like waves
	noStroke(); 
	fill(171,209,197, 100); 
	for(var i = 0; i < 6; i ++){
		var xR = random(-205, 205); 
		var yR = random(10, 125); 
		var w = random(50, 100); 
		var h = random(5, 10); 

		ellipse(width / 2 + xR, height * 0.65 + yR, w, h);
	}


	update(); 
	removeClouds(); 
	addCloud();   
    
}

function update(){ //update all the clouds 
	for(var i = 0; i < clouds.length; i++){
		clouds[i].move(); 
		clouds[i].display(); 
	}
}

function removeClouds(){ //checks to see where clouds are and changes positions accordingly
	var cloudKeep = []; 
	for(var i = 0; i < clouds.length; i++){
		if(clouds[i].x + 25 > 0){ // cloud is 50 wide, so 25 is point from center
			cloudKeep.push(clouds[i]); 
		}
	}
	clouds = cloudKeep; //keep only clouds still on screen
}

function addCloud(){ //randomly adds clouds at intervals 
	var newCloud = 0.03; 
	if(random(0,1) < newCloud){
		var cloudY = random(75, 150); 
		clouds.push(makeClouds(480, cloudY)); 
	}
}

function cloudMove(){ // move the clouds 
	this.x += this.speed; 
}

function cloudDisplay(){ //draw the clouds 
	fill("#FFD79E"); 
	noStroke(); 
	ellipse(this.x, this.y, 90, 15); 
	ellipse(this.x - 25, this.y - 10, 35, 30);
	ellipse(this.x, this.y - 20, 40, 40);
	ellipse(this.x + 20, this.y - 15, 35, 30);  

}

function makeClouds(cloudLocX, cloudLocY){ //cloud object definition 
	var cloud = { x: cloudLocX,
				y: cloudLocY,
				speed: -5, 
				move: cloudMove, 
				display: cloudDisplay}

	return cloud; 
} 
function mountains(color, min, max, noiseS) {

	noStroke(); 
	fill(color); 
	noiseSeed(noiseS); 

	beginShape(); 
	for(var x = 0; x < width; x++){
		var t = (x * terrainDetail + (millis() * terrainSpeed)); 
		var y = map(noise(t), 0, 1, min, max); 
		vertex(x, y); 
	}
	vertex(width, height); 
	vertex(0, height); 
	endShape(); 


}


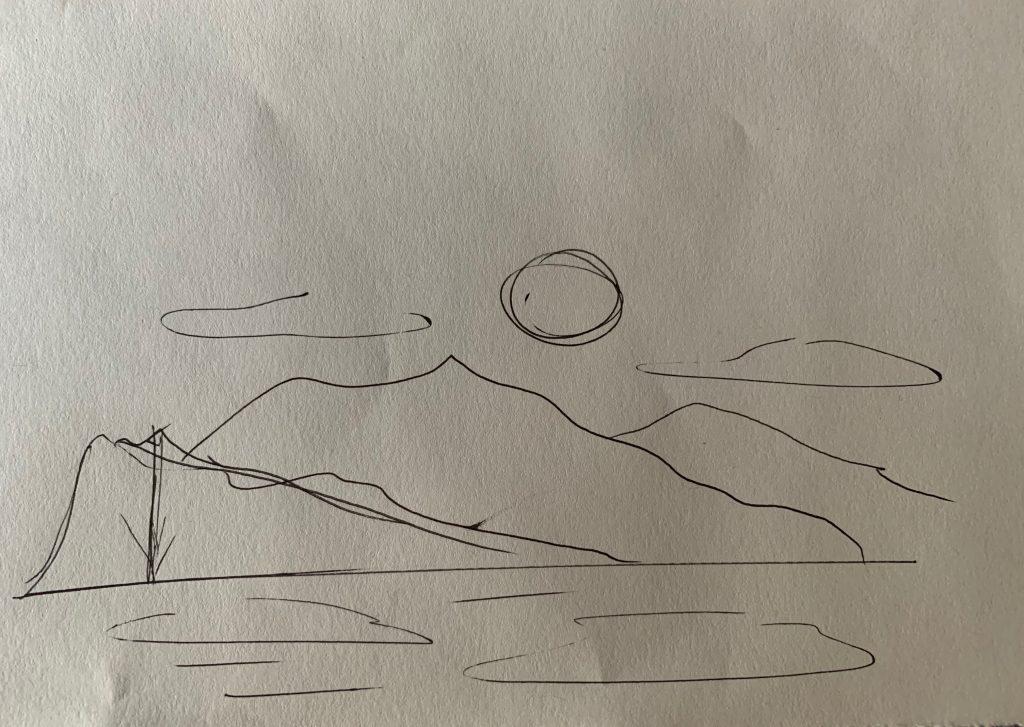
This project was very fun to do. I was inspired by the mountain terrain that was shown in the deliverable section. I immediately thought to the serene sunset nights that a person could see when they are on a cruise ship. So I worked with this color palette and recreated an ocean scene with ripples in the ocean, a setting sun, and mountain ranges.

Sketch of the concept

Mihika Bansal – Looking Outwards – 11

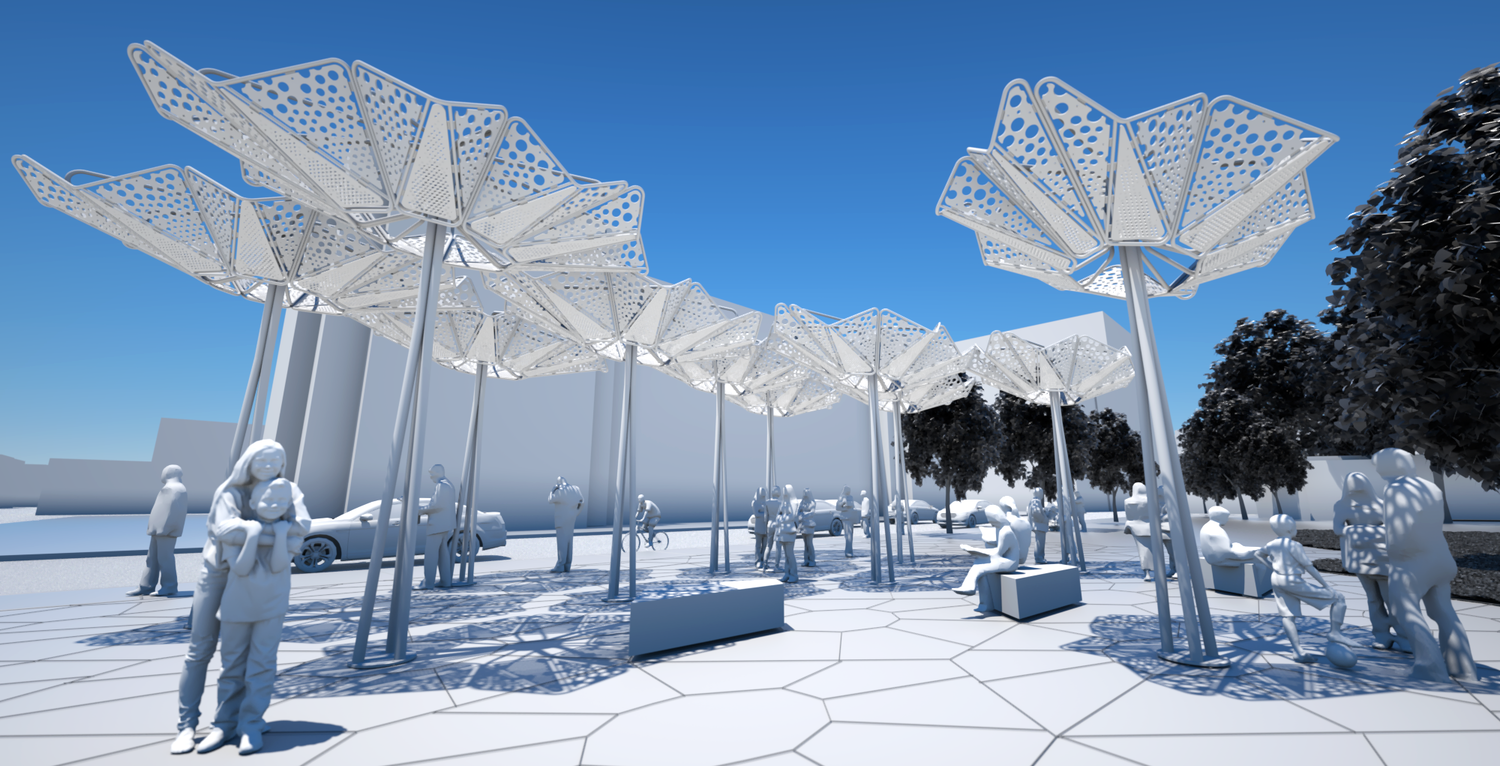
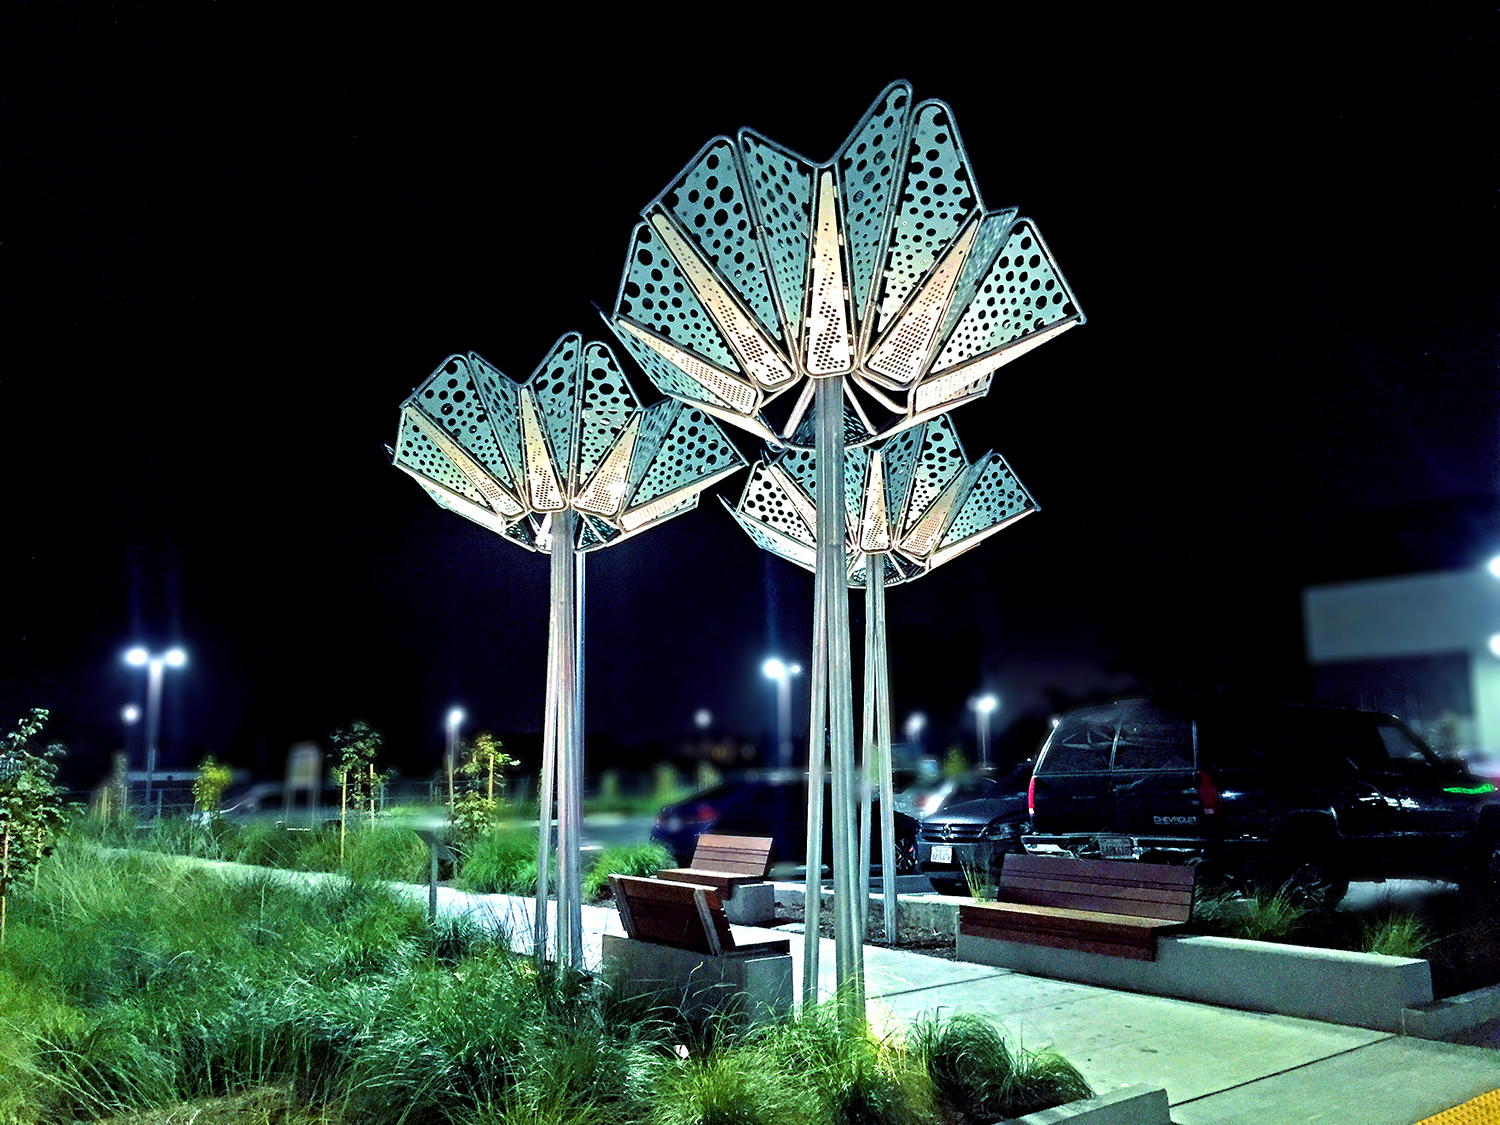
For this post I will be analyzing the work by Nataly Gattegno. She creates very interesting work that explores the use of physical space in her physical interactions and digital interactions. The specific project I am looking at is Anemone, an immersive pedestrian experience.

The piece itself is instillation art and is located in Albany, California. Anemone creates a place to engage in conversation with people. The manner in which the sculpture works with light and space also allows the views to enjoy the animated play of light and shadow created by the artwork’s intricate geometric structure.

The space is immersive and creates a new sense of place for conversation which works well with the space that it is located in. Gattegno creates other similar pieces that serve similar purposes, all very cleanly made and designed.

Anemone Canopy Clusters:  The hexagonal tiling pattern allows for larger canopy clusters to be formed (Phase 2 is unbuilt)
Digital Model of the space
ANEMONE-1.jpg
Picture of the in which they are located

Mihika Bansal – Looking Outwards – 10

For this post I will be looking at the project, Sounding Circuits – Audible Histories. This piece is an interactive audio system surrounded by rare objects, artifacts, and recordings from the early history of electronic music. It was installed at Columbia University with their Department of Music. this exhibition highlights the significant contributions of pioneering electronic and computer music composers Otto Luening, Pauline Oliveros, Edgar Varèse, and Charles Dodge. The piece specifically highlights the manner in which their different way of thinking caused so much progress in the music world.

The audio itself is presented in a 360 degree manner causing the users to become completely immersed into the space. This piece was curated by Seth Cluett.

Image of the exhibit space
Video that displays what the exhibit is like

Mihika Bansal – Project 10 – Sonic Sketch

sketch


// Mihika Bansal 
// Section E 
// mbansal@andrew.cmu.edu
// Project 10

var h1 = 35; // varying heights
var h2 = 80;  
var h3 = 50; 

var w1 = 10; //varying widths 
var w2 = 15; 
var w3 = 20; 


function preload() {
    // call loadImage() and loadSound() for all media files here
    //mySnd = loadSound("waves.wav"); 
   // mySnd.setVolume(0.5);
}


function setup() {
    // you can change the next 2 lines:
    rectMode(CENTER); 
    createCanvas(480, 400);
   
    //======== call the following to use sound =========
    useSound();
}


function soundSetup() { // setup for audio generation
    // you can replace any of this with your own audio code:
    s1 = new p5.Oscillator(); //the 4 tones I will be manipulating
    s1.setType('sine');

    s2 = new p5.Oscillator();
    s2.setType("sine"); 

    s3 = new p5.Oscillator();
    s3.setType("sine"); 
    
    s4 = new p5.Oscillator();
    s4.setType("sine"); 

    //starting all the audio files, so all sounds are playing at the same time
    s1.start();
    s2.start(); 
    s3.start();
    s4.start();

}


function draw() {

    //creating visual elements 
    background(15); 
    noStroke(); 

    h1 = map(mouseY, 0, height, 50, 80); 
    h2 = map(mouseX, 0, height, 100, 200);
    h3 = map(mouseY, 0, height, 80, 120); 

    w1 = map(mouseX, 0, width, 10, 30);
    w2 = map(mouseY, 0, width, 20, 40);
    w3 = map(mouseX, 0, width, 15, 35); 

    fill("#355C7D"); 
    rect(26, 200, w1, h1); 
    rect(185, 200, w1, h1);
    rect(344, 200, w1, h1);


    fill("#F67280"); 
    rect(79, 200, w2, h2);
    rect(238, 200, w2, h2);
    rect(397, 200, w2, h2);

    fill("#C06C84"); 
    rect(132, 200, w3, h3);
    rect(291, 200, w3, h3);
    rect(450, 200, w3, h3);

    if(mouseX > 0 & mouseX < 120){ //determing sound based on the mouse, moving the mouse changes the sound
        freq1 = map(mouseX, 0, width, 0, 200); //lowest frequency is to the left of the screen
        //amp1 = map(mouseY, 0, height, 0, 0.3); 
        s1.freq(freq1); 
        s1.amp(0.5); //when in that section of the screen the audio is louder
        //s1.start(); 
    }
    else{
        s1.amp(0); //when outside of that section of the screen, the audio is softer 
    }
    if(mouseX > 120 & mouseX < 240){
        freq2 = map(mouseX, 0, width, 200, 400); // increeasing frequency
        s2.freq(freq2);
        s2.amp(0.5); // louder sounds
        //s2.start(); 
    }
    else{
        s2.amp(0); //softer sounds 
    }
    if(mouseX > 240 & mouseX < 360){
        freq3 = map(mouseX, 0, width, 400, 600); // increasing the frequency 
        s3.freq(freq3);
        s3.amp(0.5); //louder sound
        //s3.start(); 
    }
    else{
        s3.amp(0); //softer sound  
    }
    if(mouseX > 360 & mouseX < 480){
        freq4 = map(mouseX, 0, width, 600, 800); //final increase in the frequency
        s4.freq(freq4);
        s4.amp(0.5);
        //s4.start(); 
    }
    else{
        s4.amp(0);  
    }

}

With this project, I created a sound piece that depends on the location of the mouse on the page. When the mouse is off of the screen the sound stops, but as long as it is on the page, a frequency will be emitted. The visuals correspond with the sound that is being emitted because I used the map function for both. Move the mouse completely to the left to stop emitting the sound on wordpress.

Mihika Bansal – Project 09 – Portrait

sketch

//Mihika Bansal 
//mbansal@andrew.cmu.edu 
//Section E 
//Project 9

var portrait; 

function preload(){
    var url = "https://i.imgur.com/rh2ehQc.jpg"; 
    portrait = loadImage(url); 
}

function setup() {
    createCanvas(480, 480);
    background(0);
    portrait.loadPixels(); 
    frameRate(2000); 
}
   
function draw() {
    //random pixel 
    var px = floor(random(width)); 
    var py = floor(random(height)); 

    //color variables for that pixel 
    var cx = constrain(px, 0, width - 1); 
    var cy = constrain(py, 0, height - 1); 

    var colorLoc = portrait.get(cx, cy); 

    noStroke(); 
    fill(colorLoc); 

    //person (rectangles)
    if(px > 120 & px < 430 && py > 30 && py < height){
        rect(px, py, 5, 5); 
    }
    //background (ellipses)
    else{
        ellipse(px, py, 10, 10); 
    }
    
}
  

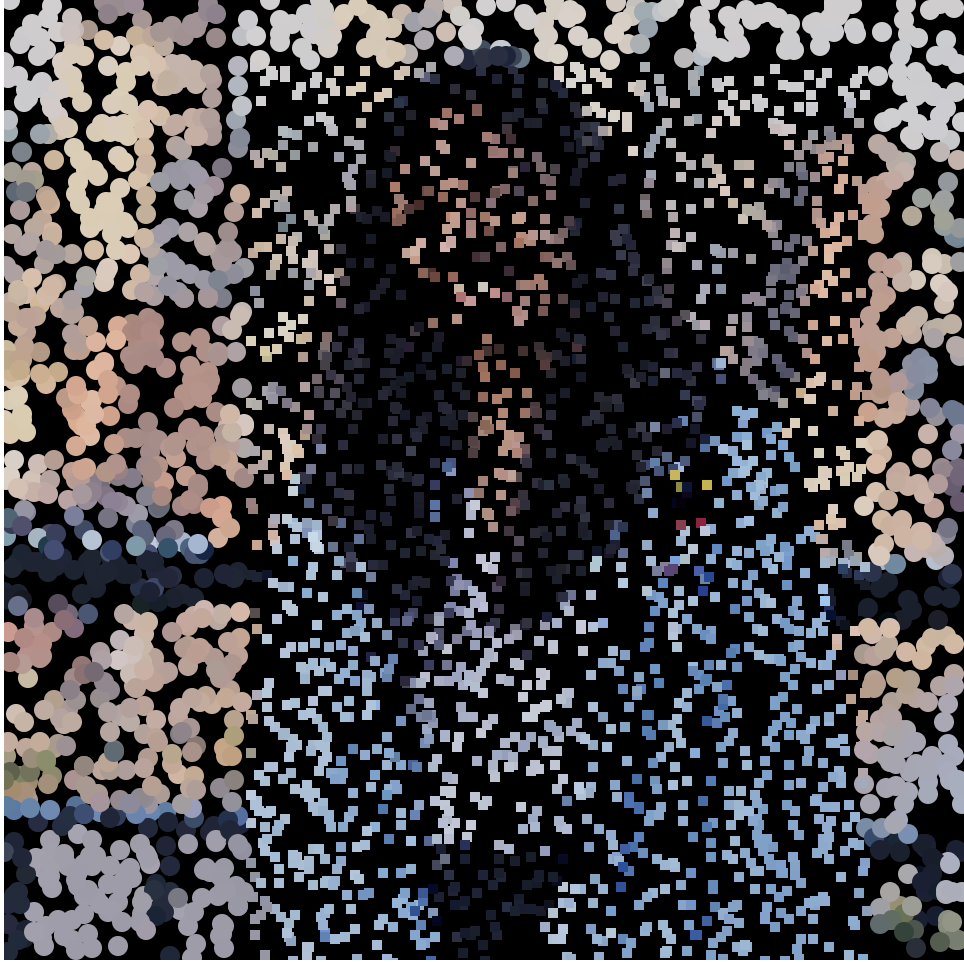
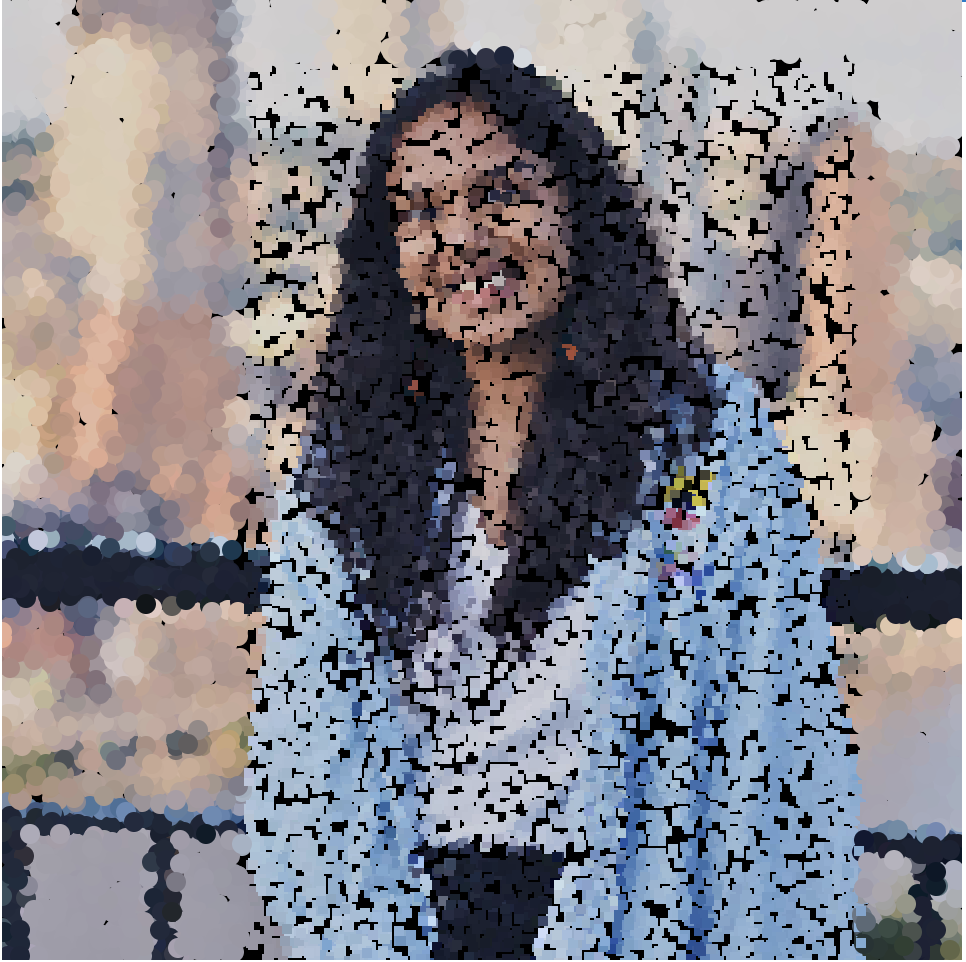
This project was very interesting to complete. I enjoyed the process of playing with different shapes to complete the different colored sections that worked together to form the portrait. I wanted to use larger ellipses in the background to create a more hazy background.

Screenshot 1
Nearly final image
The original image

Mihika Bansal – Looking Outwards – 09

The looking outwards post I want to look at for this post is Angela Lee’s post from week 6. This post deals with the artist Matt Deslauriers. The piece of work she specifically analyzes is a generative art piece that creates random colors and lines that generate based on the click of the mouse. I agree with Angela’s analysis of the importance of color in the artist’s piece. The artist used color palettes that pre-exist and are already established as well liked. This move is particularly smart as it is something that will appeal to the masses which is important in the pieces that he is creating. Angela also notes this in her own post. She also touches upon the importance of finding a balance in his piece which can be hard with the randomness of it, but she addresses this situation well as well.

Image of the piece that is created when you click the canvas.

Mihika Bansal – Looking Outwards – 08

The creative person I am analyzing with this post is Rachel Binx. Currently Rachel Binx is working at Netflix with the Content and Data team in Los Angeles. Before that Rachel worked at Mapzen, NASAJPL, and Stamen. Rachel describes herself as a data visualizer, developer, and designer.

In the lecture, Rachel specifically talks about new ways to visualize data, methods that transcend the way that we have typically thought about data in the past. She emphasizes the importance of the practicality of the manner in which the data is visualized, not just creating something that is “eye candy.” One of her projects that I find to be particularly interesting is the GPX Jewelry project, which creates interesting jewelry based on maps that she has used before.

She is a very engaged presenter which makes it more interesting to watch her work being presented as it engages the user and the audience.

Link to website: https://rachelbinx.com

Rachel’s Lecture