As I scoured the internet for computational data visualization projects, I happed to find this installation, a physical project that I’ve walked by countless times on my way to various cities across the United States. This project is called eCloud, a data-driven project located in San Jose Airport that changes according to live weather patterns across the world. eCloud is a sculpture inspired by the formation and properties of an actual cloud, hence the clor and positioning in space. The design takes into account the sky weather, temperature, wind speed, wind direction, relative humidity, and visibility. With this information the polycarbonate tiles transition from full transparency to opaqueness, creating an elegant array of floating components. Some of the cities include Prague, Berlin, Los Angeles, and Rio De Janeiro
Complimentary digital interface
To accompany the installation, there’s a digital interface that shows all of the data currently used. This project really fascinated me because it takes a form in nature and abstracts it into something so artistic, yet still computational. This project is a good example of a design system—that is alone, each tile means nothing. However, when together, you get a beautiful cluster of data titles.
//Sewon Park
//sewonp@andrew.cmu.edu
//Section B
//Project-07

function setup() {
    createCanvas(480, 480);

}

function draw() {
	background(0,0,0);
	push();
	translate(width/2, height/2); //placing curve at center
	drawBicorn();
	pop();
}

function drawBicorn(){

	var x;
	var y;
	var w = map(mouseX,0,width,0,200); // changes length of the curve through mouse control
	var h = map(mouseY,0,height,0,200) // changes height of the curve through mouse control

	stroke(255,0,0);
	beginShape();
	for(var i = 0; i <200; i ++){
	var t = map (i, 0, 200, 0 ,200);
	x = (w*sin(t)); //x coordinate equation for Bicorn
	y = (h*sin(t)*cos(t)); //y coordinate equation for Bicorn
	vertex(x,y); // placing curve at center
	}
	endShape(CLOSE);

}
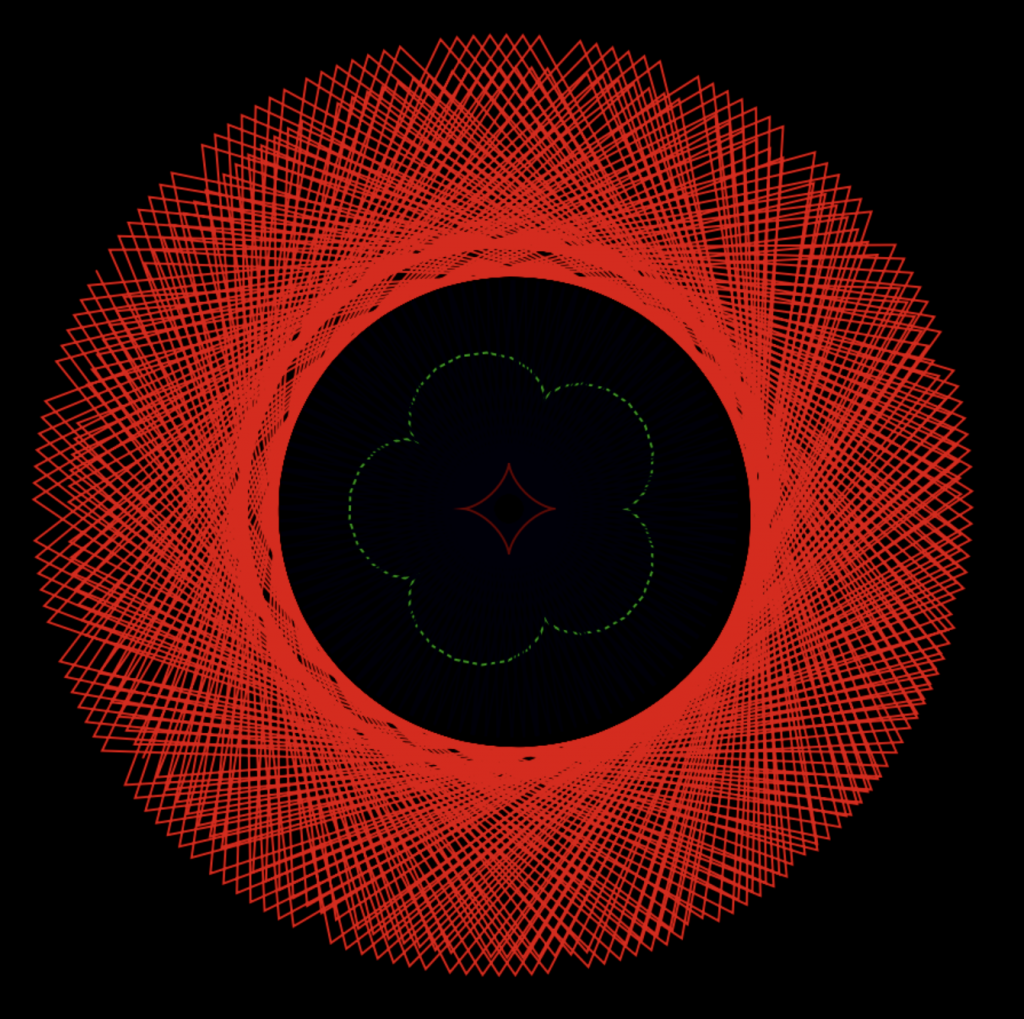
For this project, I was very conflicted about choosing the curve as I was not knowledge about the realm of mathematical graphs. Having only known parabolas and hyperbolas, I was surprised to see the myriad of curves on the reference website. Many of the curves seemed somewhat randomly drawn without specific symmetry or shape. As I appreciate symmetry, I decided to select the Bicorn curve. The curve represented a variety of objects such as a ribbon, the infinity sign, and a mask. I tried to develop an abstract visualization of Deadpool’s mask.
I also thought of Spiderman whilst making the project, prompting me to create a web like structure to assimilate spiderwebs when creating the mask.
//Jamie Park           jiminp@andrew.cmu.edu
//15-104          Section E        Project 7

//Global Variables
var maxIVal = 300;

function setup(){
    createCanvas(450, 450);
    frameRate(40);
}

function draw(){
    background("black");
    drawHypotrochoid();
    drawRanunculoid();
    drawHypotrochoid2();
    drawAstroid();
}

function drawRanunculoid(){
        //http://mathworld.wolfram.com/Ranunculoid.html

    //push and translate the drawing to the center of the canvas
    push();
    translate(width / 2, height / 2);

    //constrain mouseX and map mouse movement
    var canvaWidth = constrain(mouseX, 0, width);
    var angle = map(canvaWidth, 0, width, 0, 360);
    var a = map(canvaWidth, 0, width, 10, width / 18);

    //change stroke color according to mouse movement, begin shape, and rotate
    noFill();
    stroke(canvaWidth, 150, canvaWidth - 20);
    beginShape();
    rotate(radians(angle));

    //forLoop that creates the shape
    for (var i = 0; i < TWO_PI; i += 0.1){
    //equation for the shape and vertex (high points)
        var x = a * (6 * cos (i) - cos (6 * i));
        var y = a * (6 * sin (i) - sin (6 * i));
        vertex(x, y);
    }
    endShape();
    pop();
}

function drawHypotrochoid(){
    //http://mathworld.wolfram.com/Hypocycloid.html

    //push and translate the drawing to the center of the canvas
    push();
    translate(width / 2, height / 2);

    //constrain mouseX, mouseY and map mouse movement
    var canvaLength = constrain(mouseX, 0, width);
    var canvaHeight = constrain(mouseY, 0, height);
    var a = map(canvaLength, 0, width, 10, width / 30);
    var b = map(canvaHeight, 0, height, 2, height / 30);
    var radAngle = 200;

    //change stroke color according to mouse movement and begin shape
    noFill();
    stroke(230, canvaHeight, canvaLength);
    beginShape();

    //forLoop that creates the shape
    for (var i = 0; i < maxIVal; i++){
        //variable rotation that maps the i value into angles
        var rotation = map(i, 0, 360, 0, 360);
        //equation for the shape and vertex
        var x = (a - b) * cos(rotation) + radAngle * cos((a - b * rotation));
        var y = (a - b) * sin(rotation) - radAngle * sin((a - b * rotation));
        vertex(x, y);
    }
    endShape();
    pop();
}

function drawHypotrochoid2(){
    //http://mathworld.wolfram.com/Hypocycloid.html

    //push and translate the drawing to the center of the canvas
    push();
    translate(width / 2, height / 2);

    //constrain mouseX, mouseY and map mouse movement
    var canvaLength = constrain(mouseX, 0, width);
    var canvaHeight = constrain(mouseY, 0, height);
    var a = map(canvaLength, 0, width, 2, width / 60);
    var b = map(canvaHeight, 0, height, 2, height / 60);
    var radAngle = 100;

    //change stroke color according to mouse movement and begin shape
    noFill();
    stroke(canvaLength, canvaHeight, 10);
    beginShape();

    //forLoop that creates the shape
    for (var i = 0; i < maxIVal; i += 2){
        //variable rotation that maps the i value into angles
        var rotation = map(i, 0, 360, 0, 270);
        //equation for the shape and vertex
        var x = (a - b) * cos(rotation) + radAngle * cos((a - b * rotation));
        var y = (a - b) * sin(rotation) - radAngle * sin((a - b * rotation));
        vertex(x, y);
    }
    endShape();
    pop();
}

function drawAstroid(){
    //http://mathworld.wolfram.com/Astroid.html

    push();
    translate(width / 2, height / 2);

    //variables necessary to define the curve
    var canvaLength = constrain(mouseX, 0, width);
    var a = map(canvaLength, 0, width, 20, width * 0.25);
    var angle = map(canvaLength, 0, width, 0, 360);
    //creating the curve
    noFill();
    stroke(100, canvaLength, canvaLength);
    beginShape();
    rotate(radians(angle));

    //forLoop for the curve and the math equation for the curves
    for (var i = 0; i < (2 * PI); i += 0.1){
        var angle = map(i, 360, 0, TWO_PI);
        var x = a * pow(cos(i), 3);
        var y = a * pow(sin(i), 3);
        vertex(x, y);
    }
    endShape();
    pop();
}
Similar to others, I struggled with understanding how to start the project. But after spending some time decoding the code on “notes” and “deliverables” sections, I had a good grasp on how things were supposed to be done. I ended up creating four curves that change color and size/complexity according to the mouse position. I am happy with the way it turned out.
/*
 * Angela Lee
 * Section E
 * ahl2@andrew.cmu.edu
 * Project 7 Curves
 */

 function setup() {
    createCanvas(480, 480);
 }

 function draw() {
    frameRate(20);
    background(0);

    push();
    // functions start at the middle of the canvas
    translate(width/2, height/2);
    // functions rotate with mouseX
    rotate(map(mouseX, 0, 480, 0, TWO_PI));
    hypotrochoid();
    epitrochoid();
    astroid();
    pop();
}

function astroid() {
    noStroke();

    // colors change smoothly by milliseconds
    r = 100 + 100 * sin(millis() / 1000.0);
    g = 150 + 40 * sin(millis() / 1000.0 + HALF_PI);
    b = 230 + 60 * sin(millis() / 1000.0 - HALF_PI);
    fill(r, g, b);

    // outer & inner radii depend on user's mouse
    a = map(mouseX, 0, width, 0, 100);
    b = map(mouseY, 0, height, 0, 100);

    // drawing the astroid
    beginShape();
    for (var i = 0; i < 2000; i ++ ) {
        // angle for astroid formula
        angle = map(i, 0, 2000, 0, TWO_PI);
        var x = pow(cos(angle), 3) * a;
        var y = pow(sin(angle), 3) * b;
        vertex(x, y);
    }
    endShape();
}

function hypotrochoid() {
    strokeWeight(1);
    fill(0);

    // colors change smoothly by milliseconds
    r = 230 + 60 * sin(millis() / 1000.0);
    g = 240 + 80 * sin(millis() / 1000.0 + HALF_PI);
    b = 155 + 90 * sin(millis() / 1000.0 - HALF_PI);
    stroke(r, g, b);

    // outer & inner radii depend on user's mouse
    a = map(mouseX, 0, width, 50, 150);
    b = map(mouseY, 0, height, 5, 10);
    h = map(mouseY, 0, height, 100, 200);

    // drawing the hypotrochoid
    beginShape();
    for (var i = 0; i < 2000; i ++) {
        // angle for hypotrochoid formula
        angle = map(i, 0, 2000, 0, TWO_PI);
        var x = (a - b) * cos(angle) + h * cos((a - b) / b * angle);
        var y = (a - b) * sin(angle) + h * sin((a - b) / b * angle);
        vertex(x, y);
    }
    endShape();
}


function epitrochoid() {
    strokeWeight(1);
    // fill allows it to have no overlap with hypotrochoid
    fill(0);
    // color changes smoothly by milliseconds
    r = 50 + 20 * sin(millis() / 1000.0);
    g = 150 + 150 * sin(millis() / 1000.0 + HALF_PI);
    b = 230 + 120 * sin(millis() / 1000.0 - HALF_PI);
    stroke(r, g, b);

    // inner & outer radii depend on user's mouse
    a = map(mouseX, 0, width, 50, 100);
    b = map(mouseY, 0, height, 0, 3);
    h = map (mouseX, 0, width, 0, 25);

    // drawing the epitrochoid
    beginShape();
    for (var i = 0; i < 2000; i++) {
        angle = map(i, 0, 2000, 0, TWO_PI);
        var x = (a + b) * cos(angle) - h * cos((a + b) / b * angle);
        var y = (a + b) * sin(angle) - h * sin((a + b) / b * angle);
        vertex(x, y);
    }
    endShape();
}
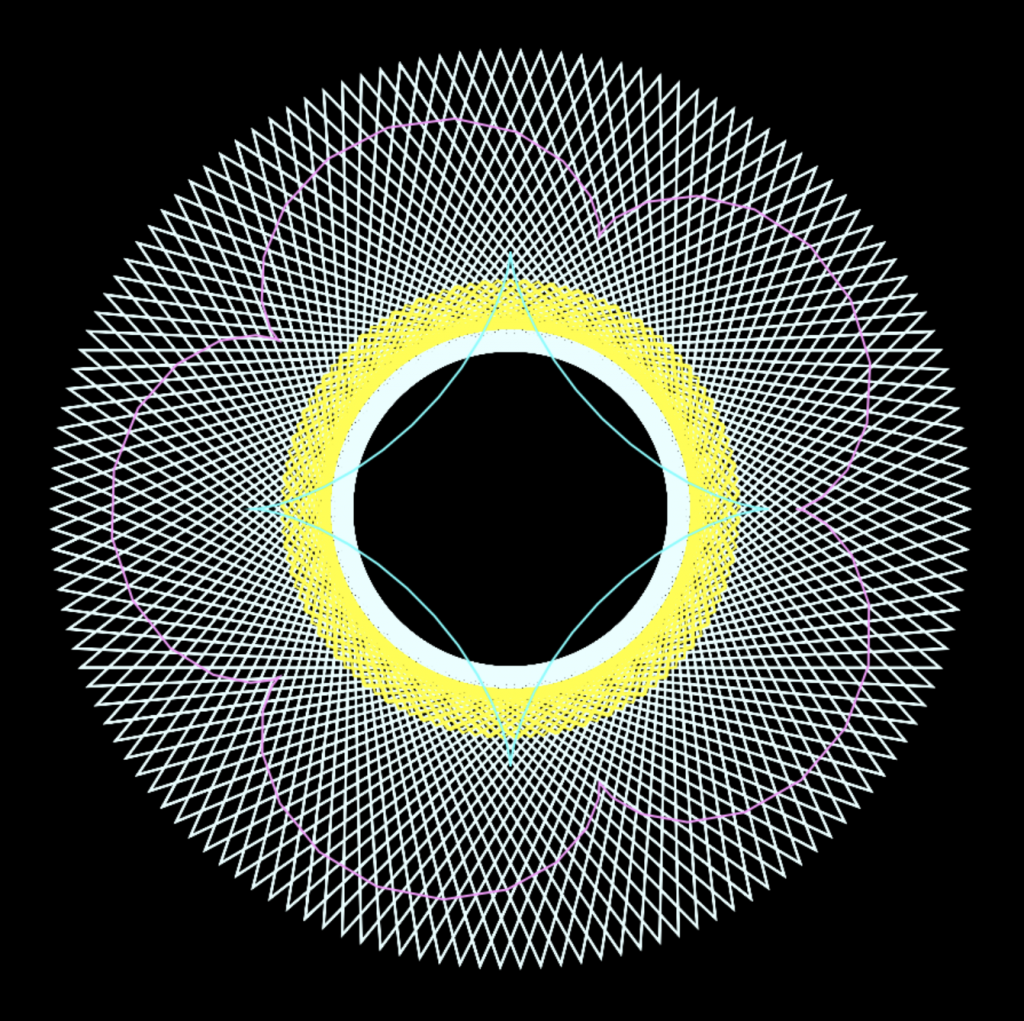
For this project, I was interested in seeing how multiple curves could overlap, interact, or mirror each other’s movements. So, I made the rotation for all three curves the same, but each curve’s parameter depends on mouseX and mouseY a little differently. Although I liked seeing how the curves could overlap, it got a very visually chaotic sometimes when they did, so I wanted to make the order of the curves constant so one curve was always the smallest, etc. The last part I tweaked about my curves was making the curves go out of the canvas, because the composition looked very restrained otherwise.
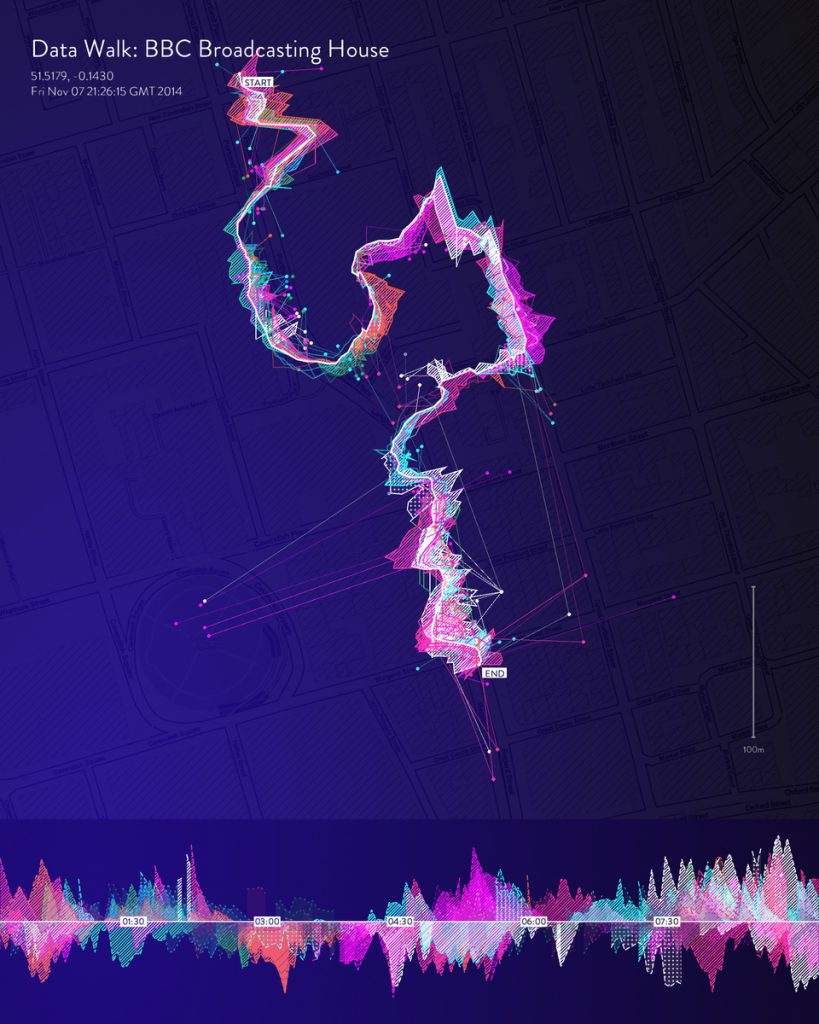
Phantom Terrains by Stefanie Posavec, Frank Swain and DanielJones
This week, I read about the work of Stefanie Posavec in Information Visualization. In her case, she used the silent wireless signals that surround us, converted into a sound that can be heard through specially modified hearing aids. She created a system of visualizing the wireless signals as they were heard on walks around London.
Stefanie describes this as an “experimental platform which aims to answer this question by translating the characteristics of wireless networks into sound”. I find the graphic not only very interesting but find the premise in which it was derived interesting as well. She essentially brings a sonic ambiance into a visual resolution, creating a conversation about what else can we not visualize but can represent it through information visualization.
//Jai Sawkar
//Section C
//jsawkar@andrew.cmu.edu
//Project 07: Abstract Clock

function setup() {
    createCanvas(480, 480);
    frameRate(60);
}

var pts = 200;

function draw(){
    background(0);

    // using push & pull to orient the Bicorn
    push()
    translate(width/2, height/2) //center focused
    drawCurve();
    pop();

    push();
    rotate(PI);  //upside down
    translate(-width/2, -height/2);
    drawCurve();
    pop();

    push();
        rotate(PI/2); // clokcwise
        translate(width/2, -height/2)
    drawCurve();
    pop();

    push();
    rotate(-PI/2); //counter clockwise
        translate(-width/2, height/2)
    drawCurve();
    pop();

}

function drawCurve(){

    //fill(255)
    noFill();
    stroke(255)
    //noStroke();
    var g = map(mouseX, 0, width, 0, width/2); //moving the parameters of mouse x
    var g = map(sq(mouseY), 0, height, 0, 1); //moving parameters of mouse y

    beginShape();
        for (i = 0; i < pts; i++){
            var j = map(i, 0, pts, 0, radians(360));
            x = g * sin(j); //forumla
            y = (g * cos(j) * cos(j) * (2+ cos(j))) / (3 + sin(j) * sin(j)); //formula
            var w = map(mouseX, 0, height, 1, 70) //remapping width
            var h = map(mouseY, 0, width, 1, 60) //remapping heigth
            ellipse(x, y, w, h); //ellipse
        }
        endShape(CLOSE);
}
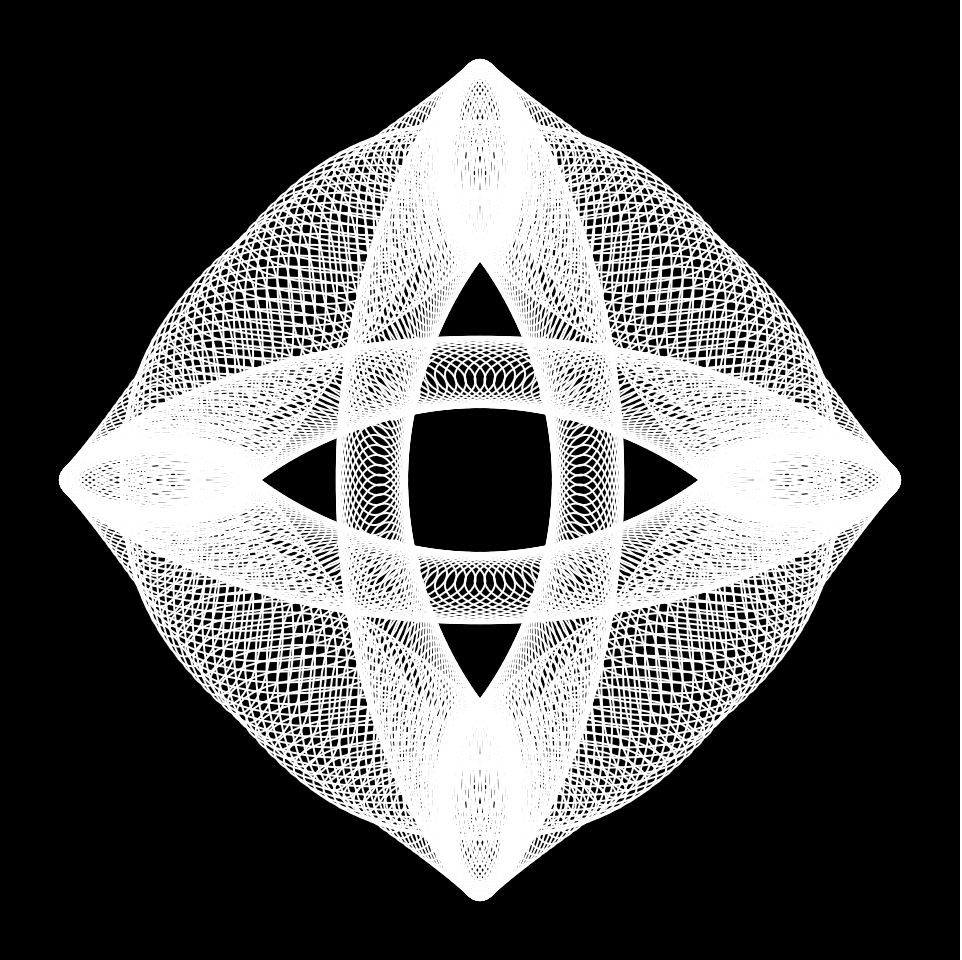
For this project, I found the Bicornal Curve interesting, so I decided to explore its possibilities. Once I drew it using the math equation provided, I found it a tad dull. I then decided to create 3 more, creating 4 bicornal curves
//Zee Salman
//SECTION E
//fawziyas@andrew.cmu.edu
//Project- 07

var nPoints = 100;
var EPITROCHOID = 0; // Cartesian Parametric Form  [x=f(t), y=g(t)]
var curveMode = EPITROCHOID;


function setup() {
    createCanvas(400, 400);
    frameRate(50);
}


function draw() {
    background(180,190,175);

    // draw the frame
    fill(0);
    noStroke();
    noFill();

    // draw the curve
    push();
    translate(width / 2, height / 2);
    switch (curveMode) {
    case EPITROCHOID:
        drawEpitrochoidCurve();
        break;
    }
    pop();
}

//--------------------------------------------------
function drawEpitrochoidCurve() {
    // Epicycloid:
    // http://mathworld.wolfram.com/Epicycloid.html

    var nPoints = 20;
    var radius = 50;
    var separation = 125;

    var x;
    var y;

    var a = mouseX / 10;
    var b = a / 10.0;
    var h = constrain(mouseY / 20.0, 20, b *50);
    var ph = mouseX / 50.0;

    stroke(255, 250, 100);
    strokeWeight(3);
//BIGGER SHAPE
    beginShape();
    for (var i = 0; i < nPoints; i++) {
        var t = map(i, 0, nPoints, 0, TWO_PI);

        x = (a +30 + b) * cos(t) - h * cos(ph + t * (a + b) / b);
        y = (a+30 + b) * sin(t) - h * sin(ph + t * (a + b) / b);
        vertex(x, y);
    }
    endShape(CLOSE);


   //// smaller shape
    stroke(245, 20, 200);
    beginShape();
    for (var i = 0; i < nPoints; i++) {
        var t = map(i, 0, nPoints, 0, TWO_PI);

        x = (a + b) * cos(t) - h * cos(ph + t * (a + b) / b);
        y = (a + b) * sin(t) - h * sin(ph + t * (a + b) / b);
        vertex(x, y);
    }
    endShape(CLOSE);


    push();
    translate(5*separation, height / 2);
    var qx = 0;
    var qy = 0;
    for (var i = 0; i <= nPoints; i++) {
        var theta = map(i, 0, nPoints, 0, TWO_PI);
        var px = radius * cos(theta);
        var py = radius * sin(theta);
        if ((i % 2 == 0) & (i > 1)) {
            line(qx, qy, px, py);
        }
        qx = px;
        qy = py;
    }
    pop();

    //// smallest shape
    //// smaller shape
  	stroke(mouseY,45,mouseX)
    beginShape();
    for (var i = 0; i < nPoints; i++) {
        var t = map(i, 0, nPoints, 0, TWO_PI);

        x = (a/2 + b) * cos(t) - h * cos(ph + t * (a + b) / b);
        y = (a/2 + b) * sin(t) - h * sin(ph + t * (a + b) / b);
        vertex(x, y);
    }
    endShape(CLOSE);

//outer shape
	stroke(mouseY, mouseX, 200);
    push();
	rotate(mouseX*6/ mouseY*6);
    strokeWeight(2);
    beginShape();
    for(var i = 0; i < 200; i +=2) {
        var x =   a * (10 * cos(i) - cos(i));
        var y =   a * (10 * sin(i) -sin(i));
        vertex(x, y);
    }
    endShape();
    pop();


}
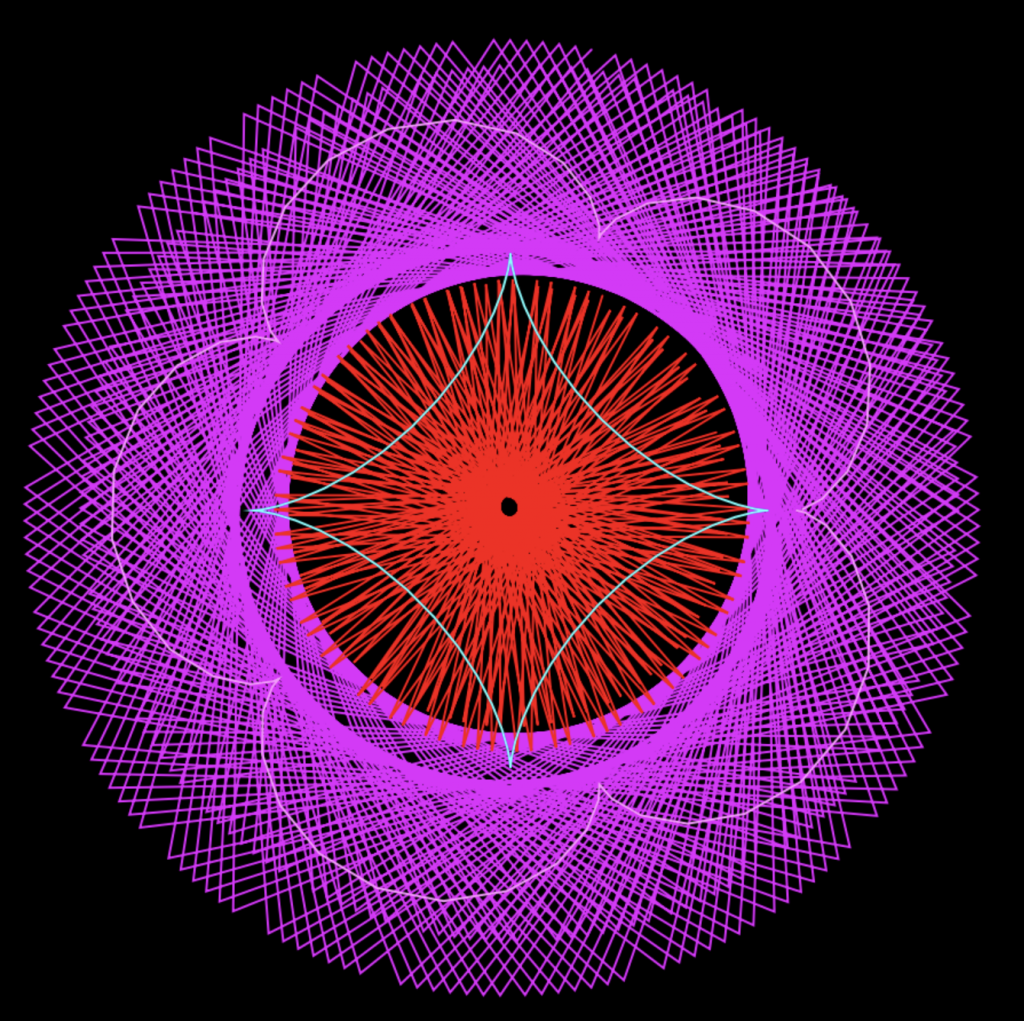
I started out wanting to do something floral or something almost pufferfish like but I started to stray away from those because I started to experiment more with my code. I started looking at the constraints and seeing where I can really try to make the piece interesting without losing sight of the project. Also trying to make each part visible to the user. I also played around with repetition and space which I really liked together in the composition. I would also like to take this project further and see how maby Epitrochoids I can fit onto one canvas and how I can make them more complex while again, making it clear.
Marked at (0, height)Marked at center (200,200)Marked at (width, 0)
Giorgia Lupi is an information designer at Accurat (data-driven research, innovation, and design), based in New York and Milan. She works to create visual narratives that use data to connect it to what it is: knowledge, behaviors, people. Stefanie Posavec is a data designer from the UK. She tends to use hand-crafted methods to create non-traditional representations of data from language, literature, or scientific areas.
I really enjoyed how they collaborated together and learned new things about each other through data and drawings. I am also really interested in design, so for the dear data project cards to hold data, but in an interesting visual way was cool to me. I liked their thought process of how they created the data visualization.
They talk a lot about their thought process and how they were feeling/felt throughout it. They also mentioned their insights and a reflection of the project. To convey the project, they almost told it as if it were story, after all, postcards are short stories. I think it’s important to include insights and reflection/things you learned when sharing a project. It shows that the project was more than just “moving through the motions” and helps you understand what you’ve learned.
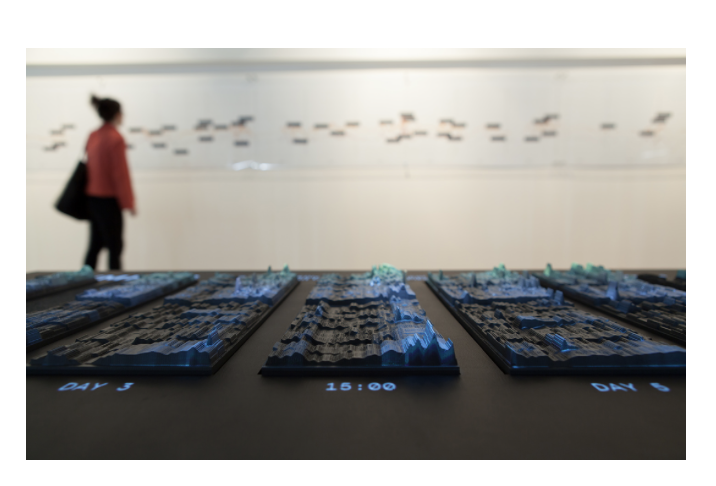
This is the physical installation created by Studio NAND.
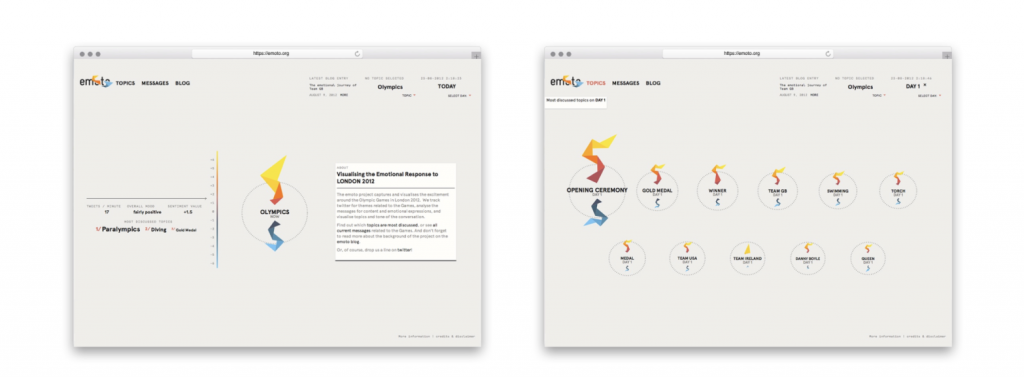
This week, I looked at emoto’s project for the London 2012 Olympics. I thought this design was interesting because it was able to capture and visualize the global response to the 2012 Olympic Games. Studio NAND created emoto. Emoto is a dual part project that is an online visualization and physical installation that showed the responses to the Olympics. This project seems extremely interesting because you are able to see responses from all around the world, allowing you to see new perspectives.
On the left image, it shows the Twitter activity. On the right image, it shows the Topic view, which shows the most discussed topics on the first day of the Games.
For their data, they used millions of tweets that talked about events, players, and teams during the Olympics. The live online component occurred at the same time as the games and translates “real-time global sentiment into custom visualizations.” This platform allowed people to utilize online discussions through tweets which helped calculate the sentiment.
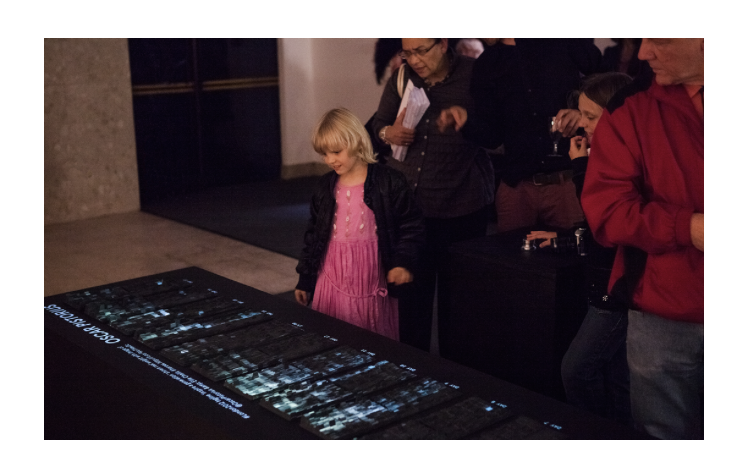
The interactive installation allowed people to scroll through the data that represented the emotional response of the Games.The physical data visualization in combination with a 10 meters long printed timeline.
The physical model had a button to start the experience. Once you press it, it starts the time which helps go through all the tweets that were made during the Olympics. I thought it was interesting because you can see everyones opinion in such a tight space. In addition, they would show the tweet above the physical model. It would project what tweet was made. Visitors could navigate a generative physical sculpture representing all responses over time with over layered information from posted tweet.
///RAYMOND PAI
///SECTION D
///RPAI@ANDREW.CMU.EDU
///PROJECT 07

function setup(){
    createCanvas(480, 480);
}

function draw() {
    background(mouseX, mouseY, mouseX);
    //Draw Curves 1 and 2
    drawE1();
    drawE2();
    drawE3();
    drawE4();
}

function drawE1() {
    push();
    //Color
    fill(mouseX + 50, 50, mouseY + 50);
    //Center
    translate(width / 2, height / 2);
    var a = map(mouseX, 0, width, 0, 250);
    var b = map(mouseY, 0 , height, 0, 250);
    beginShape();
        for (var i = 0; i < 250; i++) {
            //Angle
            var t = map(i, 0, 250, 0, 2 * PI);
            //Epicycloid equations
            x = (a + b) * sin(t) - b * sin((a + b) * t / b);
            y = (a + b) * cos(t) - b * cos((a + b) * t / b);
            vertex(x, y);
        }
    endShape();
    pop();
}

function drawE2() {
    push();
    //Color
    fill(0, mouseX + 50, mouseY + 50);
    //Center
    translate(width / 2, height / 2);
    var a = map(height-mouseX, 0, width, 0, 250);
    var b = map(height-mouseY, 0 , height, 0, 250);
    beginShape();
        for (var i = 0; i < 250; i++) {
            //Angle
            var t = map(i, 0, 250, 0, 2 * PI);
            //Epicycloid equations
            x = (a + b) * sin(t) - b * sin((a + b) * t / b);
            y = (a + b) * cos(t) - b * cos((a + b) * t / b);
            vertex(x, y);
        }
    endShape();
    pop();
}

function drawE3() {
    push();
    //Color
    fill(200, mouseY + 50, mouseX + 50);
    //Center
    translate(width / 2, height / 2);
    var a = map(height/2-mouseX, 0, width, 0, 250);
    var b = map(height/2-mouseY, 0 , height, 0, 250);
    beginShape();
        for (var i = 0; i < 250; i++) {
            //Angle
            var t = map(i, 0, 250, 0, 2 * PI);
            //Epicycloid equations
            x = (a + b) * sin(t) - b * sin((a + b) * t / b);
            y = (a + b) * cos(t) - b * cos((a + b) * t / b);
            vertex(x, y);
        }
    endShape();
    pop();
}

function drawE4() {
    push();
    //Color
    fill(mouseX + 50, mouseX + 50, 200);
    //Center
    translate(width / 2, height / 2);
    var a = map(height/1.5-mouseX, 0, width, 0, 250);
    var b = map(height/1.5-mouseY, 0 , height, 0, 250);
    beginShape();
        for (var i = 0; i < 250; i++) {
            //Angle
            var t = map(i, 0, 250, 0, 2 * PI);
            //Epicycloid equations
            x = (a + b) * sin(t) - b * sin((a + b) * t / b);
            y = (a + b) * cos(t) - b * cos((a + b) * t / b);
            vertex(x, y);
        }
    endShape();
    pop();
}
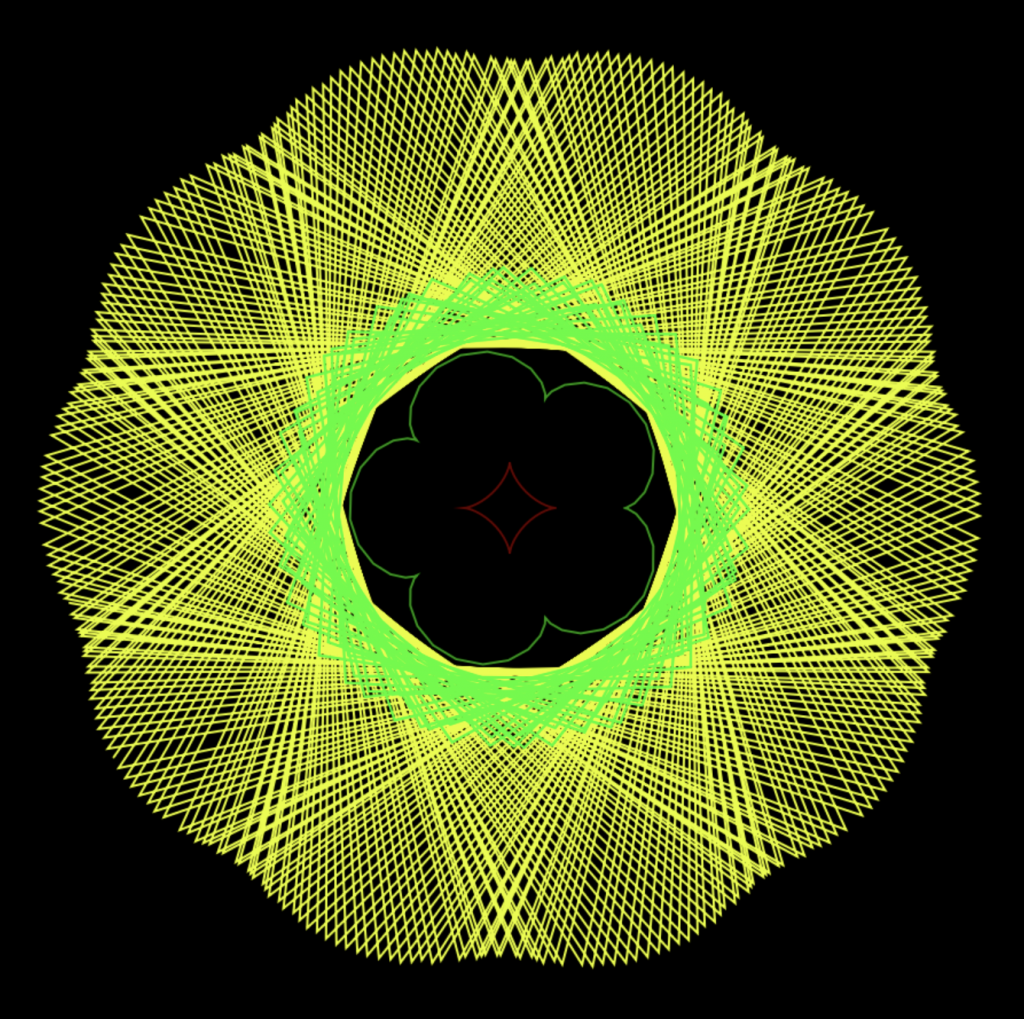
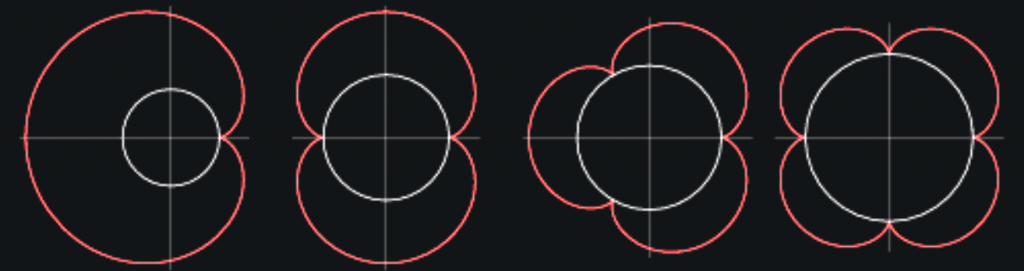
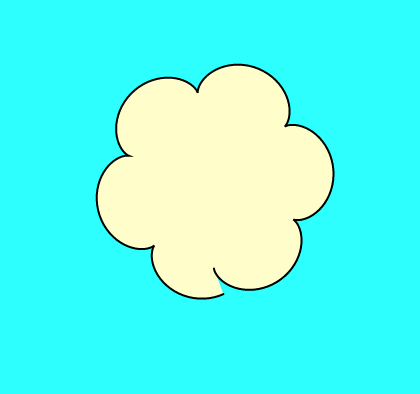
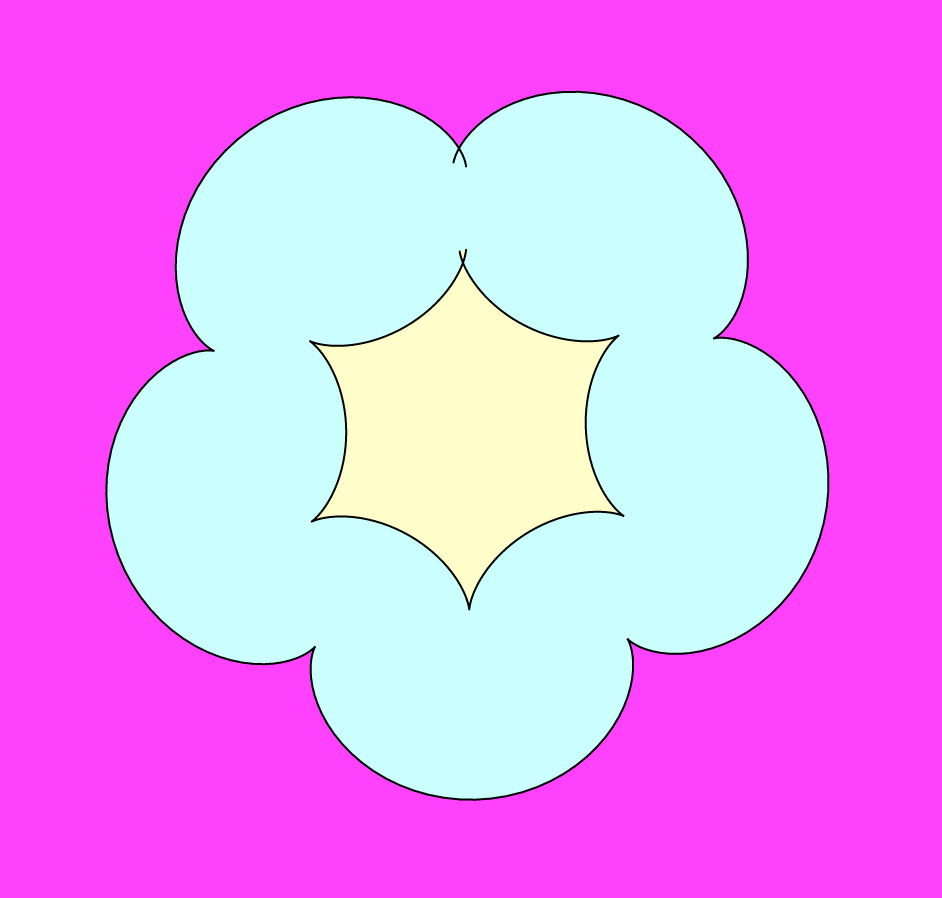
Flower Power!
The curve I used is the Epicycloid. I like how it creates petals that resemble flowers.
I used 4 Epicycloids of varying sizes to create the effect of flowers without making it obvious that they’re flowers. I decided to do this because the flowers looked pretty lonely.
Lonely Flower
The more curves I added the more interesting the floral patterns became.
The colors are based on the mouse position, but I limited them slightly to more pastel and ‘Spring’ colors, such as pink, green, yellow, etc.
The final product is an abstract and colorful depiction of flowers. Sometimes the flowers invert and create interesting sharp objects, like thorns of a rose. They also contribute to more detailed flowers, such as the process image above.
![[OLD FALL 2019] 15-104 • Introduction to Computing for Creative Practice](../../../../wp-content/uploads/2020/08/stop-banner.png)