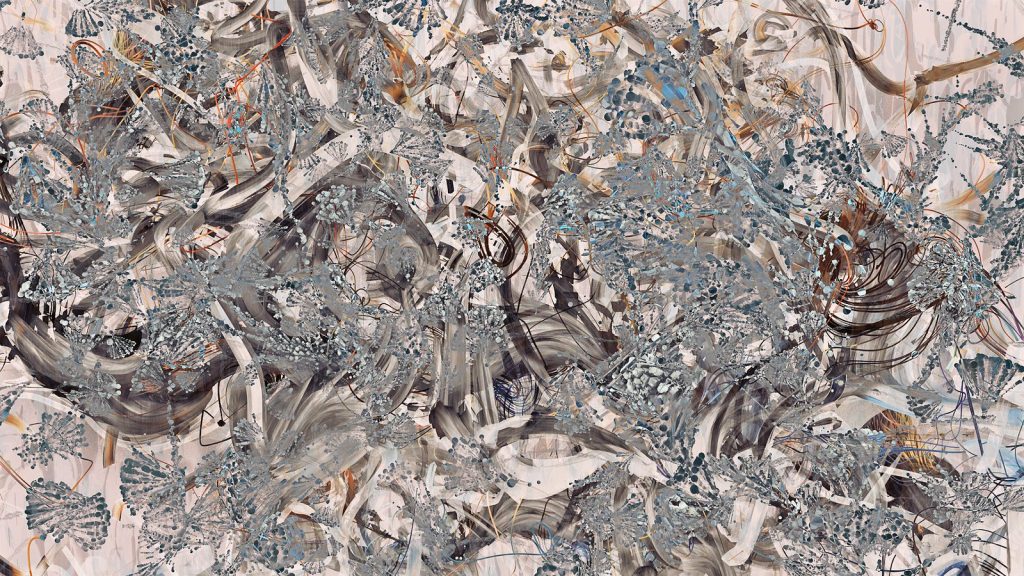
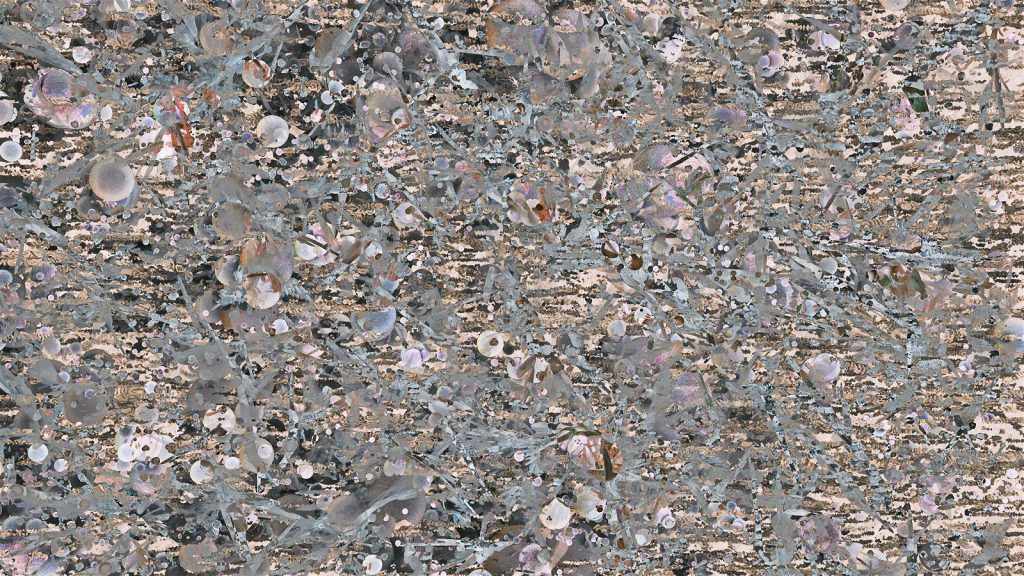
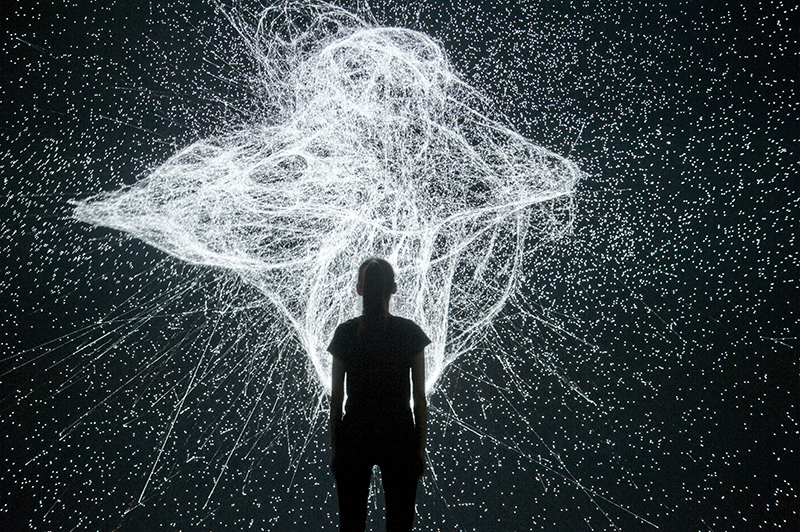
Entanglement I by Markos Kay Photo taken from mrkism.comSuperposition I by Markos Kay Photo taken from mrkism.com
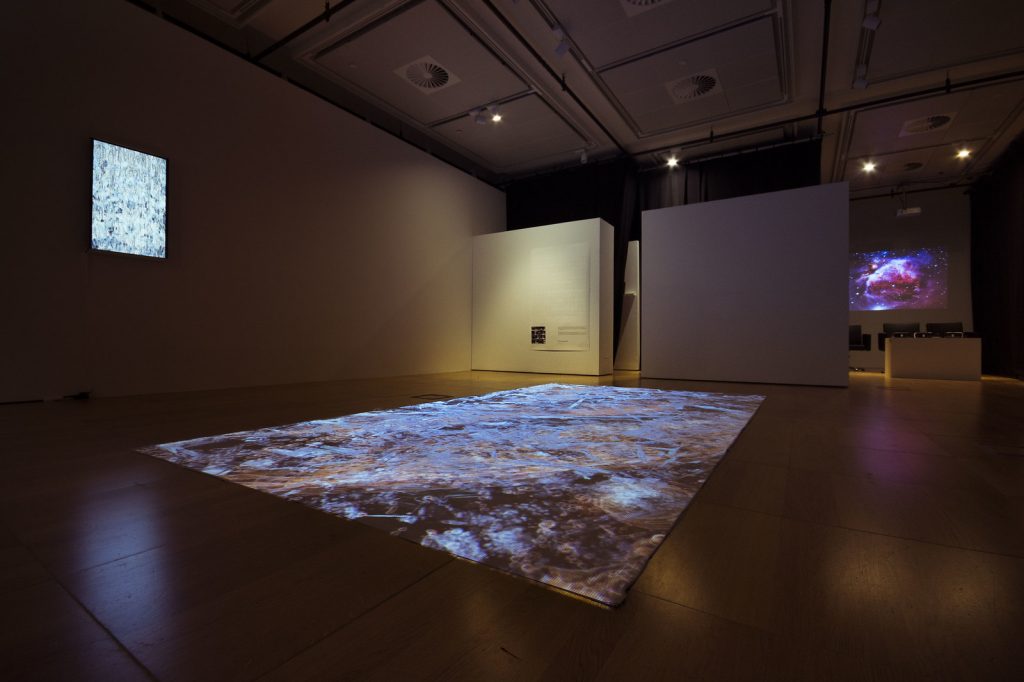
Quantum Superpositions is a moving image installation create from particle simulations inspired by the physics that goes on inside the Large Hadron Collider. These simulations are superimposed to create random yet intricate digital paintings that allude to quantum properties such as wave-particle duality, superposition, entanglement etc. The image is projected onto the floor to allow viewers to experience the unstable nature of life as random microscopic patterns are blown up in proportional contrast to their own bodies.
I really appreciate how Markos Kay bases the subject of his art on such intangible matters and uses it to elicit sensorial awareness from the viewer. I also admire how he beautifully merges the physics and art to create an unfamiliar yet intriguing image as you don’t quite know what it is actually suppose to be at first glance. The randomness of the patterns reflects what we don’t see in reality, leaving viewers to reflect on our state of being as humans.
Projected art onto floor. Photo taken from mrkism.com
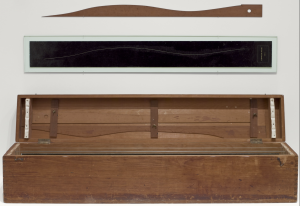
Marcel Duchamp was a French American artist who enjoyed the creation of conceptual art. He created an artwork in 1913-14 called “3 Standard Stoppages”. The artist dropped three meter long threads from one meter above three canvases, and the threads naturally adhered to the canvases with the random curves upon landing. The canvas was later cut along the threads, and the shapes were being preserved. The artwork was intended as a satire against the metric system that Duchamp described as an “intellectual construct rather than a universal absolute”(moma.org). I found it interesting how Duchamp utilized chance operations to distort the unit of length, creating a breakthrough to conventional measuring systems. The artwork is now displayed in MoMA in Manhattan.
//Fanjie Jin
//Section C
//fjin@andrew.cmu.edu
//Project 6

function setup() {
    createCanvas(480,480);
}

function draw() {
   background(15, 20, 60);

//change the hour, min and sec into variables
    var S = second();
    var M = minute();
    var H = hour();

//display the grid for percentages
    stroke(255)
    strokeWeight(1)
    line(240, 25, 240, 455)

    stroke(255)
    strokeWeight(1)
    line(20, 240, 480, 240)

//display the percentage signs
    fill(255);
    text(" 0% ", 450, 237);
    fill(255);

    text(" 25% ", 228, 470);
    fill(255);

    text(" 50% ", 5, 237);

    fill(255);
    text(" 75% ", 228, 18);

//outer circle
    stroke(255);
    noFill();
    ellipse(240, 240, 400, 400);

//arc plate displays hours overall percentage of hour
    MappedH = H / 24;
    strokeWeight(1);
    fill(100, 140, 222);
    arc(240,240, 400, 400, 0, MappedH *2 * PI);

//outer circle
    fill(15, 20, 60);
    stroke(255);
    ellipse(260, 240, 300, 300);

//display the grid for hours
    for(a = 0 ;a < 360; a += 15){
      push();
      translate(240,240);
      strokeWeight(1);
      stroke(255, 255, 0);
      rotate(radians(a));
      line(0,0,200,0);
      pop();
    }

//outer circle
    fill(15, 20, 60);
    stroke(255);
    ellipse(260, 240, 300, 300);

//display the grid for seconds and how many seconds have passed
    for(i = 0 ;i < 360; i += 6){
      push();
      translate(260,240);
      stroke(255, 0, 0);
      rotate(radians(i));
      line(0,0,150,0);
      pop();
    }
      push();
      translate(260,240);
      rotate(radians(6 * S));
      stroke(255);
      line(0,0,150,0);
      pop();

    fill(15, 20, 60);
    ellipse(270, 240, 200, 200);

//display how many minutes have passed
    MappedM = M / 60;
    push();
    translate(270, 240);
    noStroke();
    fill(100, 108, 222);
    arc(0,0, 200, 200, 0, MappedM *2 * PI);
    pop();

//draw grid for minutes
    for(a = 0 ;a < 360; a += 6){
      push();
      translate(270,240);
      strokeWeight(1);
      stroke(255, 255, 0);
      rotate(radians(a));
      line(0,0,100,0);
      pop();
    }

//inner ellipse 3
    fill(15, 20, 60);
    stroke(255);
    ellipse(249, 240, 150, 150);

//circle at the center would expand based on seconds
    fill(50, 20, 60);
    noStroke();
    ellipse(249, 240, S * 2.5, S * 2.5);

//display the actual time at the middle of the canvas
    fill(255);
    text(nf(H, 2,0) + ":", 220, 237);
    text(nf(M, 2,0) + ":", 240, 237);
    text(nf(S, 2,0), 260, 237);

//line showing the beginning
    stroke(255);
    strokeWeight(2);
    line(240, 240, 600, 240);
}
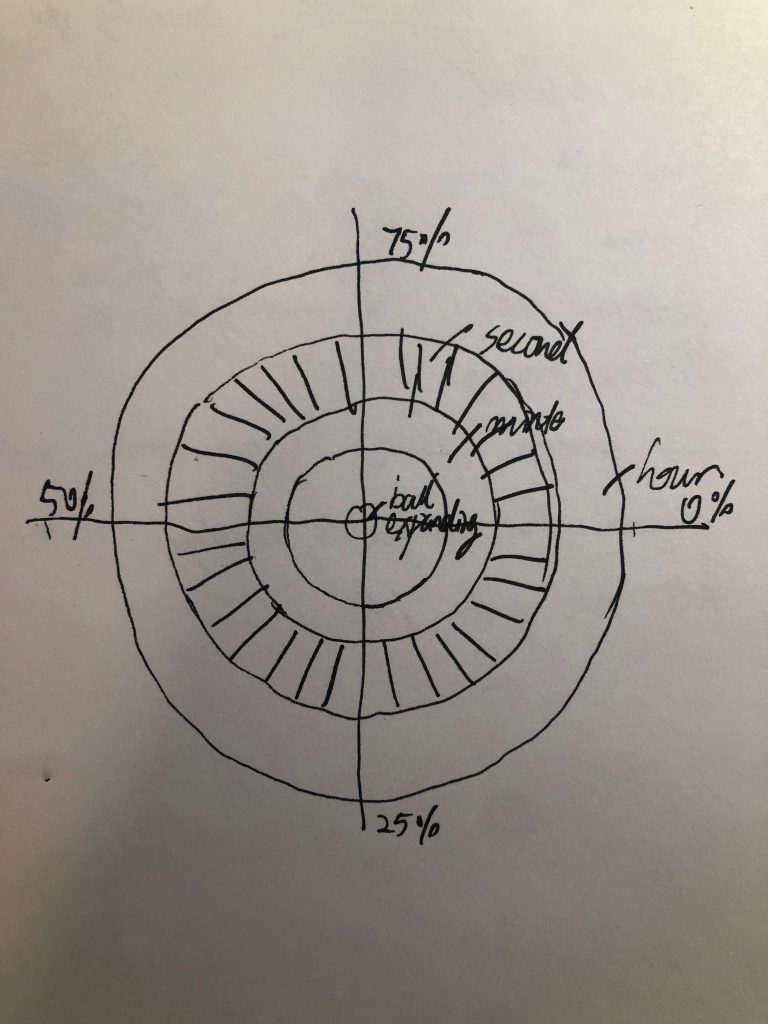
In this abstract clock project, I have decided to treat it with a minimalistic approach. Overall, there are three rings, and from the center to the outer ring, the minutes, seconds, and hours are being displayed. The gird has showed the percentage, so from the clock, viewer will be understand how much percent of the day has been passed. There is a circle expanding constantly at the center of the clock based on how many seconds have been passed. Lastly, I have experimented with the idea of offset so compositionally, its more intriguing.
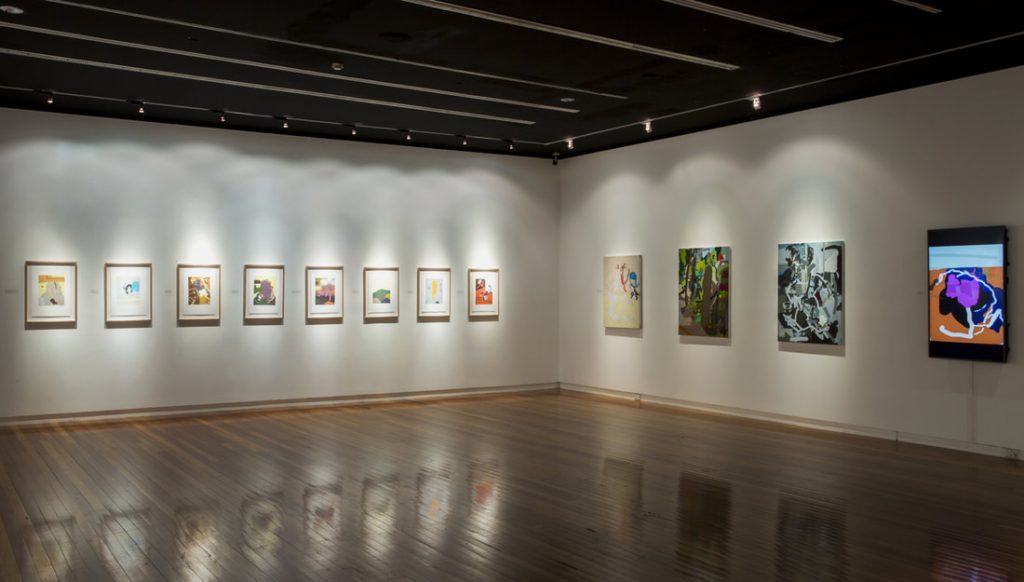
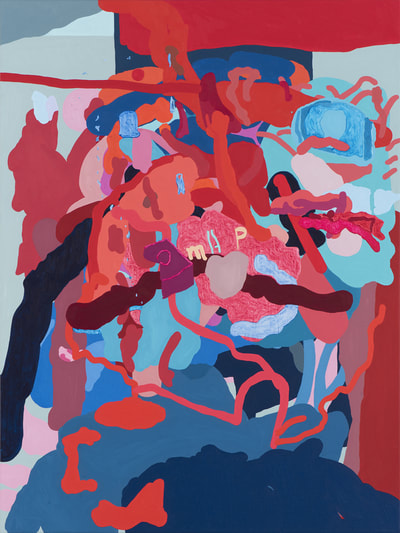
Tony Curran’s Random Feels Familiar in the Wagga Wagga Art GalleryArt titled: ‘Just not enough blue to hold it down’ in the exhibition
Random Feels Familiar by Tony Curran is a randomly generated series of art pieces on oil on linen. Created in 2017 and currently exhibited at the Wagga Wagga Art Gallery, art hangs on the wall encompassing the viewer in fine art that feels familiar but is quite different. Abstract designs hang on the wall are printed on canvas yet are, in reality, randomly generated by code. The art piece use texture and expressive techniques to confuse the viewer if it’s created by code or done by a human. What I admire about this series is how it blurs the lines between who has ownership of the painting. Although the computer uses pseudo-random generation, the foundation remains on the artist’s visual language.
Norimichi Hirakawa is a Japanese artist whose work centralizes in real-time digital audio-visual installations. The series of video, The Irreversible, is generated by a time-evolutionary algorithm. The process starts from randomizing the initial constants. As described by the artist, “everything within the video is just a result of meaningless calculation.” Math calculation is Hirakawa’s variables and parameters, and the final results are somehow confusing but appealing at the same time. The audience are astonished by the strong visual impact. The background sound fits into the visual rhyme well. Through two-dimensional media, such as lines and points, Hirakawa achieves a three-dimensional effect.
Aaron Tobey generated a project that involved the mechanics of brainstorming and coding architecture. In his Vimeo video showing the code running, we see 36 rectangular frames generating a randomized series of shapes drawn in each frame. I admired that while the overall piece looked organized, it also included a factor in which it created a chaotic yet cohesive mood. The boundaries of each rectangular frame created a clean structure that contained the chaotic randomness of the architecture shapes inside. I suppose that Tobey first drew the rectangular frames in the code and then generated loops that drew random architecture shapes within each frame. This algorithm then creates the piece that we observe in Tobey’s Vimeo.
//sarah kang
//section c
//sarahk1@andrew.cmu.edu
//project-06-clock

 function setup() {
   createCanvas(480, 480);
   background(0);
 }

 function draw() {
    //current time
    var S = second();
    var M = minute();
    var H = hour();

    //remap
    var RMH = map(H, 0, 23, 0, 360);
    var RMM = map(M, 0, 59, 0, 360);
    var RMS = map(S, 0, 59, 0, 360);
    var sec = S / 60;

    var rad = 100;
    var dim = 80;
    var dim2 = 40;
    var dim3 = 30;
    var x1 = 220;
    var y1 = 160;
    var x2 = 350;
    var y2 = 260;
    var x3 = 200;
    var y3 = 340;
    var x4 = 80;
    var y4 = 390;
    var x5 = 400;
    var y5 = 60;

    angleMode(DEGREES);

    //first bubble
    fill(63, 57, 64);
    noStroke();
    ellipse(220, 160, sec * dim, sec * dim); //center
    //big ring for hours
    noFill();
    stroke(105, 9, 46);
    strokeWeight(1);
    arc(x1, y1, rad + 80, rad + 80, 0, RMH);
    //med ring for minutes
    stroke(240, 192, 201);
    strokeWeight(4);
    arc(x1, y1, rad + 50, rad + 50, 0, RMM);
    //small ring for seconds
    stroke(201, 231, 255);
    strokeWeight(7);
    arc(x1, y1, rad, rad, 0, RMS);


    //second bubble
    fill(94, 86, 93);
    noStroke();
    ellipse(350, 260, sec * dim, sec * dim); //center
    //big ring for seconds
    noFill();
    stroke(105, 9, 46);
    strokeWeight(4);
    arc(x2, y2, rad + 100, rad + 100, 0, RMS);
    //med ring for minutes
    stroke(240, 192, 201);
    strokeWeight(8);
    arc(x2, y2, rad + 75, rad + 75, 0, RMM);
    //small ring for hours
    stroke(201, 231, 255);
    strokeWeight(12);
    arc(x2, y2, rad + 20, rad + 20, 0, RMH);

    //third bubble
    fill(99, 101, 115);
    noStroke();
    ellipse(200, 340, sec * dim2, sec * dim2); //center
    //big ring for seconds
    noFill();
    stroke(105, 9, 46);
    strokeWeight(1);
    arc(x3, y3, rad + 40, rad + 40, 0, RMS);
    //med ring for seconds
    stroke(240, 192, 201);
    strokeWeight(2);
    arc(x3, y3, rad + 20, rad + 20, 0, RMS);
    //small ring for seconds
    stroke(201, 231, 255);
    strokeWeight(4);
    arc(x3, y3, rad, rad, 0, RMS);

    //4th bubble
    fill(140, 143, 161);
    noStroke();
    ellipse(80, 390, sec * dim2, sec * dim2); //center
    //big ring for seconds
    noFill();
    stroke(105, 9, 46);
    strokeWeight(1);
    arc(x4, y4, rad, rad, 0, RMS);
    //med ring for seconds
    stroke(240, 192, 201);
    strokeWeight(2);
    arc(x4, y4, rad - 10, rad - 10, 0, RMS);
    //small ring for seconds
    stroke(201, 231, 255);
    strokeWeight(4);
    arc(x4, y4, rad - 20, rad - 20, 0, RMS);

    //5th bubble
    fill(149, 140, 161);
    noStroke();
    ellipse(400, 60, sec * dim3, sec * dim3); //center
    //big ring for seconds
    noFill();
    stroke(105, 9, 46);
    strokeWeight(1);
    arc(x5, y5, rad - 20, rad - 20, 0, RMS);
    //med ring for seconds
    stroke(240, 192, 201);
    strokeWeight(2);
    arc(x5, y5, rad - 30, rad - 30, 0, RMS);
    //small ring for seconds
    stroke(201, 231, 255);
    strokeWeight(4);
    arc(x5, y5, rad - 45, rad - 45, 0, RMS);

}
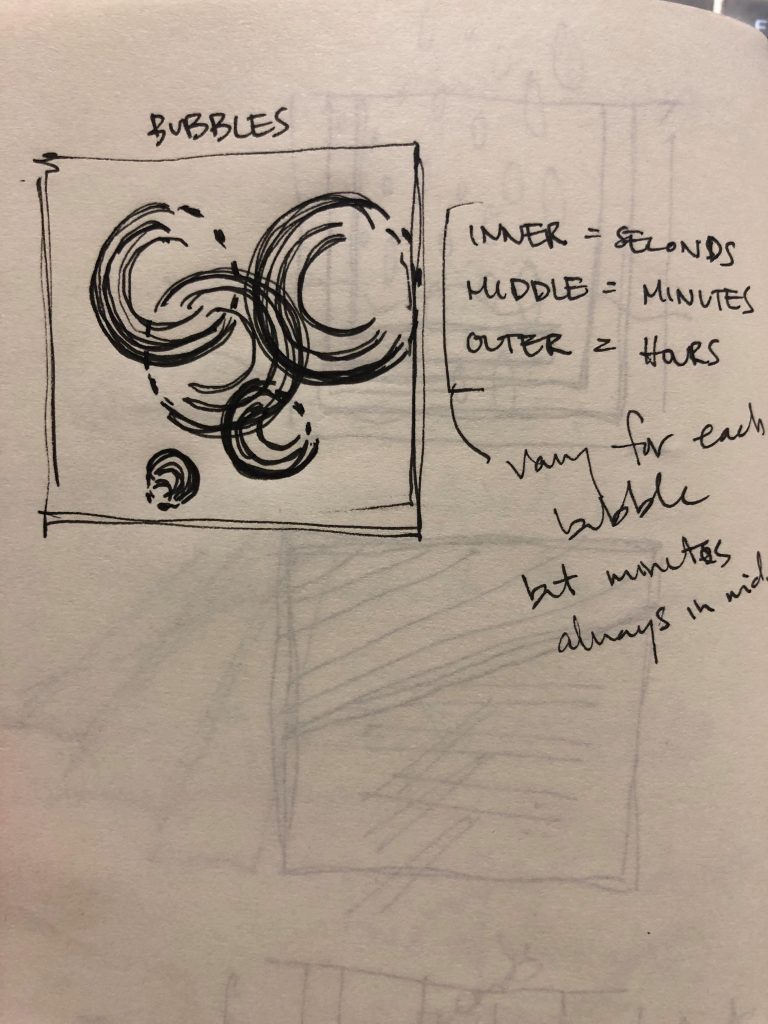
I wanted to make a bubble clock and vary the hour, minute, and second variables by the layers of the bubbles. To make the frame changes more apparent, I used more seconds variables in the visualization.
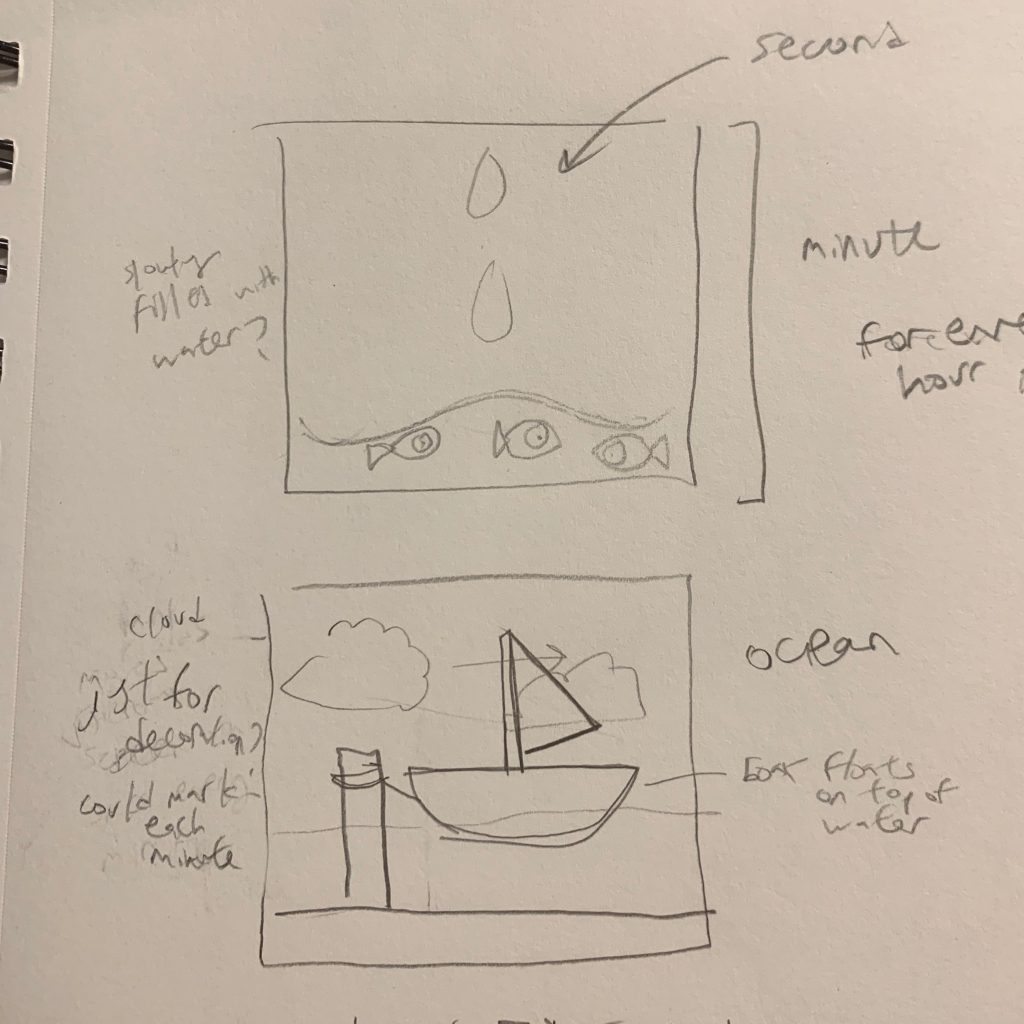
For my clock I made a scene at the ocean. The small clock shows the progression of an hour (when it’s near the end of the screen the hour’s about to change) and the big cloud shows the progression of a minute. The water is controlled by a sin function so it makes a whole cycle in a minute. There is a transparent layer on top of the water (called oceanLight) that also expands and contracts sinusoidally. It has the same x,y value (0,2*height/3+yMin) so that it follows the blue water exactly.
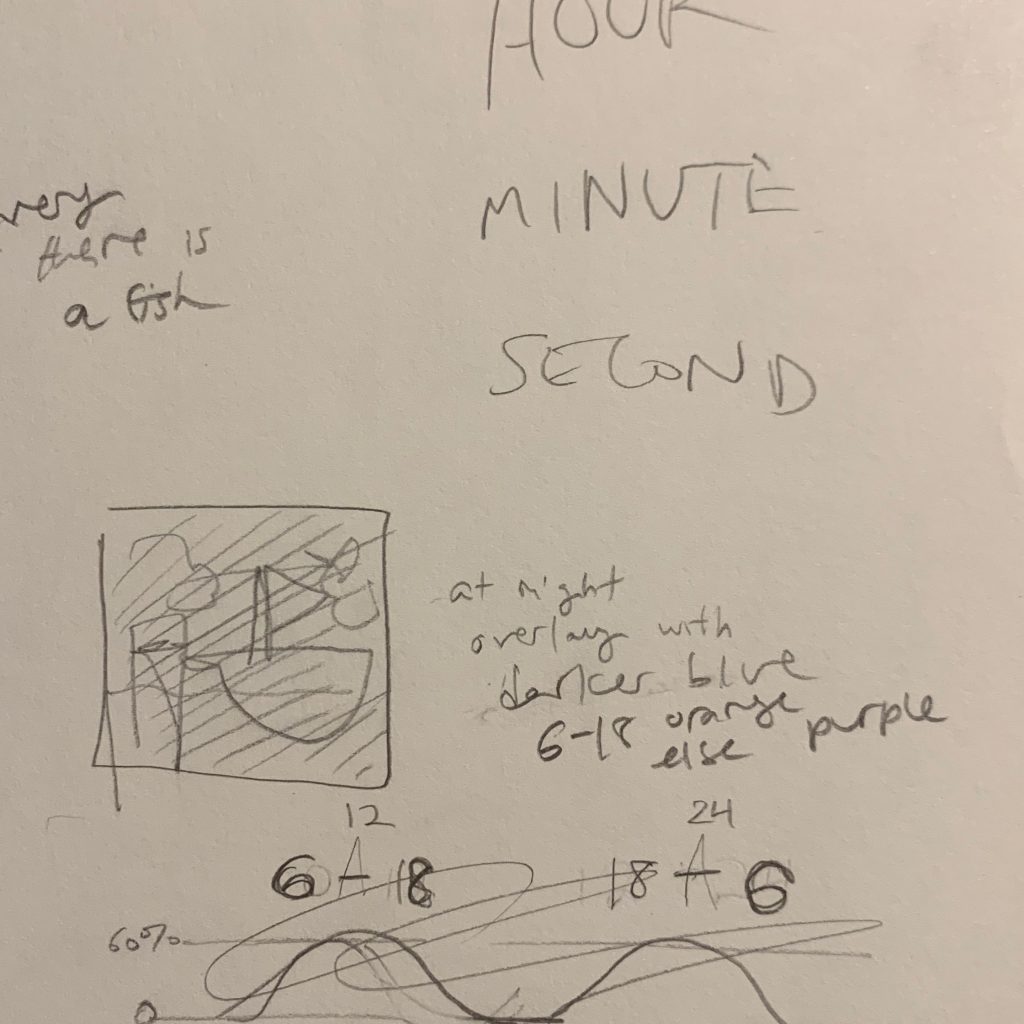
There is also a simple function to make the sky more orange during specific hours (6am to 6pm) and more blue otherwise.
/*
Ellan Suder
15104 1 D
esuder@andrew.cmu.edu
Project-06
*/

var skyColor;
var oceanColor;
var oceanColorLight;
var sandColor;
var logColor;
var notchColor;
var orangeSky;
var purpleSky;
var boatColor;

var prevSec;
var millisRolloverTime;
var hr;

function setup() {
    skyColor = color(140,220,240);
    oceanColor = color(60,140,190);
    oceanColorLight = color(219,222,236,150);
    sandColor = color(220,190,110);
    logColor = color(97,54,35);
    notchColor = color(141,94,43);
    orangeSky = color(248,170,66,40);
    purpleSky = color(129,36,229,40);
    boatColor = color(200,50,50);
    createCanvas(480, 480);
    noStroke();

//gets accurate starting time
    hr = hour() + minute()/60 + second()/60/60;
}

function draw() {
    background(skyColor);

//fetch current time
    var H = hour();
    var M = minute();
    var S = second();
    if (prevSec != S) {
        millisRolloverTime = millis();
    }
    prevSec = S;
    var mils = floor(millis() - millisRolloverTime);
//smooth out seconds and minutes
    var secondsWithFraction = S + (mils / 1000.0);
    var minutesWithFraction  = M + (mils / 60000.0);
    var cloudPositionSec = map(secondsWithFraction,  0, 60, -150, width + 50);
    var cloudPositionMin = map(minutesWithFraction,  0, 60, -75, width + 25);


//ocean - full cycle every minute
    var seconds = hr + (millis() * 0.001) /60;
    var yMin = sin(seconds * TWO_PI) * height/4; //highest value is 2*height/3 + height/4, lowest is 2*height/3 - height/4. one full cycle is a minute
    var yMin2 = sin(seconds * TWO_PI) * height/20;
    fill(oceanColor);
    rect(0,2*height/3+yMin,
         width,height/4-yMin); //2*height/3 is middle value/start of sin wave. goes up and then down


//sand + log + light water
    fill(logColor);
    rect(height/4,height/2-30,55,height/2-30,5,5);
    fill(notchColor);
    triangle(height/4+55,2*height/3-5, //top
             height/4+35,2*height/3,
             height/4+55,2*height/3+10);

    fill(oceanColorLight);
    rect(0,2*height/3+yMin,
         width,height/20+yMin2);//sits on top of blue water/yMin

    fill(sandColor);
    ellipse(width/2,height-30,width+500,70);
    ellipse(height/4+55/2,height-53,120,30);


//cloud that moves across screen in an hour
    fill(225,235,240);
    drawCloud(cloudPositionMin,height/3,50);
//cloud that moves across screen in a minute
    fill(250,250,250);
    drawCloud(cloudPositionSec,height/5);

    boatY=2*height/3+yMin+20;

    drawBoat(width/2,boatY);


//night and day overlay color
    if(H >= 6 & H < 18) {
      fill(orangeSky);
    } else {
      fill(purpleSky);
    }
      rect(0,0,width,height);
}

function drawCloud(x,y,size = 100) {
    push();
    noStroke();
    //fill(230);
    ellipse(x, y, size, size);
    ellipse(x + size*.5, y + size*.05, size, size);
    ellipse(x + size, y, size, size*.8);
    ellipse(x + size*.3, y - size*.2, size*.8, size*.8);
    ellipse(x + size*.7, y - size*.35, size*.8, size*.8);
    pop();
}

function drawBoat(x=width/2,y=height/2) {
  fill("black");
  rect(x+30,y-220,
       12,220);
  fill("white");
  triangle(x+42,y-220,
           x+150,y-103,
           x+42,y-90);
  fill(boatColor);
  beginShape();
  vertex(x-20, y-80);
  vertex(x+220, y-80);
  vertex(x+170, y);
  vertex(x, y);
  endShape(CLOSE);
}
My representation of the clock showed three different parts of the clock. I wanted to portray hours, minutes, and seconds in three different manners. By doing this, I was able to code the outside of the circle with an arc, showing the hour. I made an inner loop with the minutes by using stroke lines. And finally, the seconds were done with the squares in the perimeter.
//Crystal Xue
//15104-section B
//luyaox@andrew.cmu.edu
//Project_06


var eyeballSize = 180;
var eyeChange = 20;

function setup() {
    createCanvas(600, 600);
}

function draw() {
    background(230, 194, 152);
    frameRate(600);
    var h = hour();
    var m = minute();
    var s = second();
    var eyeWidth = 150;

    //eyebag
    translate(120, 400)
    fill(210, 180, 152);
    noStroke();
    beginShape();
    for (var i = - 1; i < 12; i++) {
         curveVertex(0.1 * PI * eyeWidth * i - 50, sin(0.1 * i * PI) * (110 + m) - 50);
    }
    endShape();

    //drawing the eye shape
    translate(-50, - 100);
    stroke(0);
    strokeWeight(10);
    fill(255);

    //drawing upper half of the eye
    beginShape();
    for (var i = -1; i < 12; i++) {
         curveVertex(0.1 * PI * eyeWidth * i, -sin(0.1 * i* PI) * (110 + m));
    }
    endShape();

    //drawing lower half of the eye
    fill(255);
    beginShape();
    for (var i = - 1; i < 12; i++) {
         curveVertex(0.1 * PI * eyeWidth * i, sin(0.1 * i * PI) * (110 + m));
    }
    endShape();

    //change of eyeball colors
    var r1 = 200 + 25 * sin(millis() / 100.0 );
    var g1 = 200 + 25 * sin(millis() / 100.0 + HALF_PI);
    var b1 = 200 + 25 * sin(millis() / 100.0 - HALF_PI);
    var eyeballX = 5 * h;
    var eyeballY = 0;
    x = sin(frameCount / 10) * eyeChange;
    y = cos(frameCount / 10) * eyeChange;

    //drawing eyeball
    translate(200, 0);
    noStroke();
    fill(r1, g1, b1);
    ellipse(eyeballX, eyeballY, eyeballSize + x,  eyeballSize + y);
    if (s % 2 == 0) {
        fill(0);
        ellipse(eyeballX, eyeballY, 100, 100);
        fill(255);
        ellipse(eyeballX + 20, eyeballY - 20, 10, 10);
    }else {
        fill(0);
        ellipse(eyeballX, eyeballY, 130, 130);
        fill(255);
        ellipse(eyeballX + 20, eyeballY -20, 15, 15);
    }

    //closing lid and eye bag when tired
    if (h < 8) {
        translate(-200,0);
        fill(230, 194, 152);
        stroke(0);
        strokeWeight(10);
        beginShape();
        for (var i = -1; i < 12; i++) {
             curveVertex(0.1 * PI * eyeWidth * i, -sin(0.1 * i* PI)* (110 + m));
        }
        endShape();
    }

}
This is a project represent a normal student eye in a day. The pupil is changing its size every second, and the eye size is increasing based on minutes. And the entire eyeball is moving from left to right based on hours. during sleeping hours (12:00 – 8:00 am) the top eyelid is closed because of fatigues.
![[OLD FALL 2019] 15-104 • Introduction to Computing for Creative Practice](../../../../wp-content/uploads/2020/08/stop-banner.png)