Alec Albright – Final Project

sketch

// Alec Albright
// aalbrigh
// Section B
// Project 12 - Final Project

var video;
var nPoints = 100; // number of points used to draw curves

var previous; // previous image from camera
var threshold = 150; // used to determine if a pixel is different enough to consider it "moving"
var motionX = 0; // main coordinate of X motion
var motionY = 0; // main coordinate of Y motion
var lerpX = 0; // X coordinate for smoothing of motion
var lerpY = 0; // Y coordinate for smoothing of motion

var higherLove; // Whitney Houston's "Higher Love"
var low; // Flo Rida's "Low"
var irreplaceable; // Beyonce's "Irreplaceable"
var newBooty; // Bubba Sparxxx's "Ms. New Booty"
var higherVol; // Higher love volume
var lowVol; // low volume
var irrepVol; // irreplaceable volume
var bootyVol; // new booty volume

function preload(){
    higherLove = loadSound("https://courses.ideate.cmu.edu/15-104/f2019/wp-content/uploads/2019/12/Higher-Love.wav");
    low = loadSound("https://courses.ideate.cmu.edu/15-104/f2019/wp-content/uploads/2019/12/Low.wav");
    irreplaceable = loadSound("https://courses.ideate.cmu.edu/15-104/f2019/wp-content/uploads/2019/12/Irreplaceable.wav");
    newBooty = loadSound("https://courses.ideate.cmu.edu/15-104/f2019/wp-content/uploads/2019/12/New-Booty.wav");
}

function soundSetup() { // setup for audio generation
    // making sine
    sine = new p5.Oscillator();
    sine.setType("sine");
    //sine.start();

    // making sawtooth
    sawtooth = new p5.Oscillator();
    sawtooth.setType("sawtooth");
    //sawtooth.start();

    // making square wave
    square = new p5.Oscillator();
    square.setType("square");
    square.freq(440);
    //square.start();
}

function setup(){
    createCanvas(480, 480);
    angleMode(RADIANS);

    video = createCapture(VIDEO);
    video.size(480, 480); // attempt to size the camera. 
    video.hide(); // this hides an unnecessary extra view.
    // prepping to copy previous frame for difference in motion
    previous = createImage(480, 480, RGB);

    useSound();

    higherLove.play();
    higherLove.setVolume(0);
    higherLove.loop();

    low.play();
    low.setVolume(0);
    low.loop();

    irreplaceable.play();
    irreplaceable.setVolume(0);
    irreplaceable.loop();

    newBooty.play();
    newBooty.setVolume(0);
    newBooty.loop();
}

function draw(){
    var count = 0; // number of pixel instances we've looped through
    var sumX = 0; // sum of motion X coordinates
    var sumY = 0; // sum of motion X coordinates

    // making camera actually mirror user
    push();
    translate(width, 0);
    scale(-1, 1);
    image(previous, 0, 0);
    pop();

    loadPixels();
    video.loadPixels(); // this must be done on each frame.
    previous.loadPixels();

    // comparing all pixels to previous image
    for (var x = 0; x < video.width; x ++) {
        for (var y = 0; y < video.height; y ++) {
            var location = (x + y * video.width) * 4;
            // finding previous and current colors
            // previous
            var red1 = previous.pixels[location]; 
            var green1 = previous.pixels[location + 1];
            var blue1 = previous.pixels[location + 2];
            // current
            var red2 = video.pixels[location];
            var green2 = video.pixels[location + 1];
            var blue2 = video.pixels[location + 2];

            var diff = distSquared(red1, green1, blue1, red2, green2, blue2);

            // checking whether they are different enough to call motion
            if (diff > threshold * threshold) {
                sumX += x;
                sumY += y;
                count ++;
            }
        }
    }
    updatePixels();

    // only count it as a different frame if more than 30 pixels have changed
    // find main X and Y coordinate of motion, this will be our control for everything
    if (count > 100) { 
        motionX = sumX / count;
        motionY = sumY / count;
    }
      
    // maintaining mirrored scale for user interface
    push();
    translate(width, 0);
    scale(-1, 1);
    // smoothing out how the point of focus is travelling
    lerpX = lerp(lerpX, motionX, 0.1); 
    lerpY = lerp(lerpY, motionY, 0.1); 

    // drawing point so user knows where the main motion point is
    stroke("black");
    fill("white");
    ellipse(lerpX, lerpY, 20, 20);
    pop();

    push();
    translate(width / 2, height / 2);
    
    // draw all the shapes
    drawHippopede();
    drawEpicycloid();
    drawHypotrochoid();

    pop();

    previous.copy(video, 0, 0, video.width, video.height, 0, 0, video.width, video.height);
    
    // creating slight boundaries for better sound isolation
    if(lerpY < 200 || lerpY > 320) {
        // letting contrast between top and bottom come through
        bootyVol = 0;
        irrepVol = 0;
        newBooty.setVolume(bootyVol);
        irreplaceable.setVolume(irrepVol);

        // as we move up, more higher love/less low
        // volume 0 to 1
        higherVol = map(lerpY, 0, width, 0, 1);
        higherLove.setVolume(1 - higherVol);
        lowVol = map(lerpY, 0, width, 0, 1);
        low.setVolume(lowVol);
    } else {
        // letting contrast between right and left come through
        higherVol = 0;
        lowVol = 0;
        higherLove.setVolume(higherVol);
        low.setVolume(lowVol);

        // as we move right, more new booty/less irreplaceable
        // volume 0 to 1
        bootyVol = map(lerpX, 0, width, 0, 1);
        newBooty.setVolume(1 - bootyVol);
        irrepVol = map(lerpX, 0, width, 0, 1);
        irreplaceable.setVolume(irrepVol);
    }
}

// draws Hippopede
function drawHippopede() {
    var x; // x coordinate of vertex
    var y; // y coordinate of vertex
    var r; // polar coordinate
    var a = lerpX / 3 // main parameter of the curve
    var b = map(a, 0, 480, 100, 200); // circle radius
    var rotation = map(lerpY, 0, 480, 0, TWO_PI); // amount of rotation

    // thickness of line proportional to the circle radius
    strokeWeight(b / 6);
    stroke(255, 255, 255, 150);
    noFill();

    // rotate shape
    push();
    rotate(rotation);

    // start drawing the shape, one point at a time
    beginShape();
    for(var i = 0; i < nPoints; i++){
        var t = map(i, 0, nPoints, 0, TWO_PI);
        
        // find r (polar equation)
        r = sqrt(4 * b * (a - b * sinSq(t)));

        // convert to x and y coordinates
        x = r * cos(t);
        y = r * sin(t);

        // draw a point at x, y
        vertex(x, y);
    }
    endShape();
    pop();
}

// draws hypotrochoid
function drawHypotrochoid() {
    var x; // x coordinate of vertex
    var y; // y coordinate of vertex
    var a = map(lerpX, 0, 480, 20, 100); // radius of the interior circle
    var b = 3; // radius of the petals
    var h = lerpX / 10; // distance from center of interior circle
    var red = map((lerpX + lerpY) / 2, 0, 480, 0, 255); // how much red
    var blue = map(lerpY, 0, 480, 0, 255); // how much blue
    var alpha = map(lerpX, 0, 480, 50, 150); // how opaque
    var rotation = map(lerpY, 100, 300, 0, TWO_PI); // amount of rotation

    strokeWeight(2)
    stroke(255, 255, 255, 150);

    // control color and opacity with mouse location
    fill(red, 0, blue, alpha);

    // control rotation with lerpY
    push();
    rotate(rotation);

    // create the shape itself
    beginShape();
    for(var i = 0; i < nPoints; i++) {
        var t = map(i, 0, nPoints, 0, TWO_PI);

        // use parametric euqations for hypotrochoid to find x and y
        x = (a - b) * cos(t) + h * cos((a - b) / b * t);
        y = (a - b) * sin(t) - h * sin((a - b) / b * t);

        // draw a point at x, y
        vertex(x, y)
    }
    endShape(CLOSE);
    pop();
}

// draws an epicycloid
function drawEpicycloid() {
    var x; // x coordinate of vertex
    var y; // y coordinate of vertex
    var a = map(lerpX, 0, 480, 20, 100); // radius of interior circle
    var b = map(lerpY, 0, 480, 5, 30); // radius of petals
    var blue = map((lerpX + lerpY) / 2, 0, 480, 0, 255); // how much blue
    var red = map(lerpY, 0, 480, 0, 255); // how much red
    var rotation = map(lerpY, 100, 300, 0, TWO_PI); // how muhc rotation

    // control color with mouse location
    strokeWeight(10)
    stroke(red, 0, blue, 150);

    // control rotation with mouse location
    push();
    rotate(rotation);

    // start drawing shape
    beginShape();
    for(var i = 0; i < nPoints; i++) {
        var t = map(i, 0, nPoints, 0, TWO_PI);

        // find coordinates using epicycloid parametric equations
        x = (a + b) * cos(t) - b * cos((a + b) / b * t);
        y = (a + b) * sin(t) - b * sin((a + b) / b * t);

        // draw a point at x, y
        vertex(x, y);
    }
    endShape();
    pop();
}

// defines sin^2 using trigonometric identities
function sinSq(x) {
    return((1 - cos(2 * x)) / 2);
}

function distSquared(x1, y1, x2, y2) {
    let dx = x2 - x1;
    let dy = y2 - y1;
    return (dx * dx) + (dy * dy);
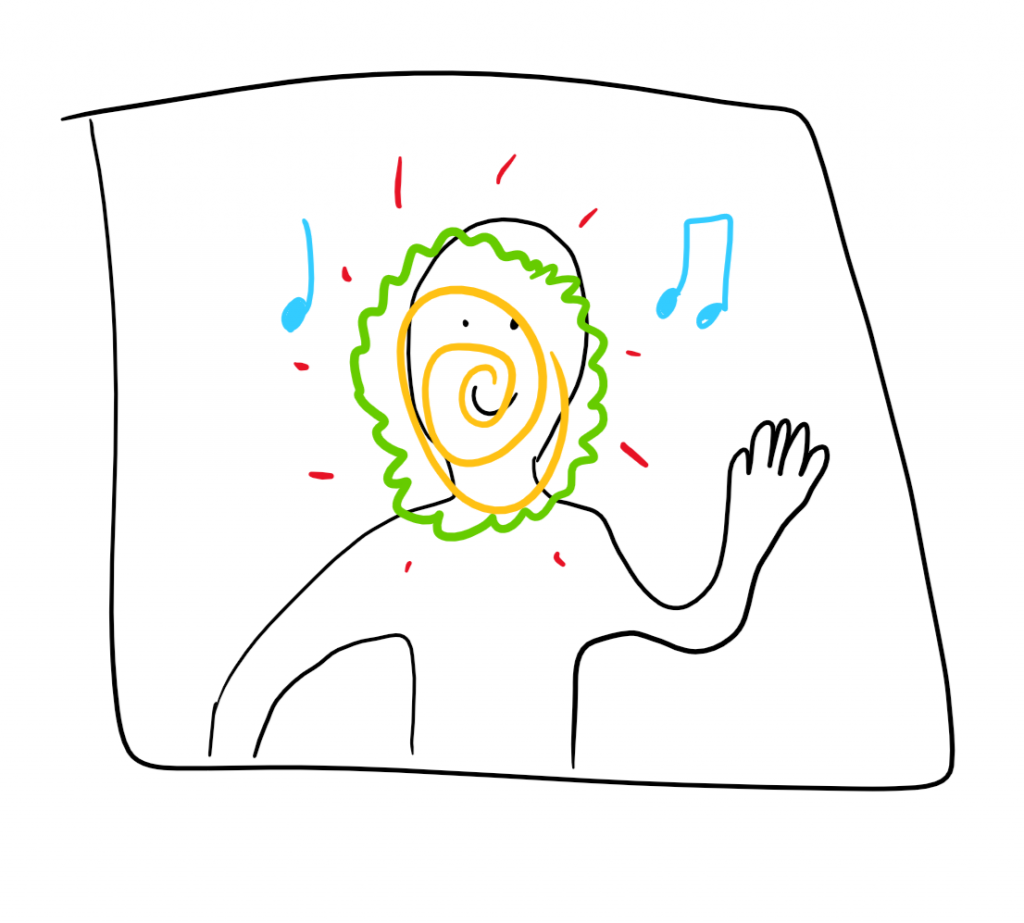
}

For the Final Project, I wanted to do something that had to deal with music, as it is my primary focus at CMU, but I also wanted to try doing something computationally complex that I would certainly be challenged by. Thus, the idea to create a motion detection music player was born! I also wanted to keep it fun, so I decided to play music related to each quadrant: “Irreplaceable” – Beyonce for the left (to the left, to the left…), “Higher Love” – Whitney Houston for the top, “Low” – Flo Rida for the bottom, and “Ms. New Booty” – Bubba Sparxxx for the right (get it right, get it right get it tight). For better user interfacing, I also included a floating point that denotes where the program has tracked the average motion.

The process was most difficult in rendering and comparing one frame to its previous frame in order to create a successful motion detection program. It was interesting mapping the visualization to the motion detection as well, giving each song its own visual identity.

In order to run the program, you must allow the website to access your video camera. However, I have included a demo video below for those who would rather see that.

Alec Albright – Project 12 – Proposal

For the Final Project, I plan on creating an audio synthesizer that uses motion detection of the user’s hand from their camera to generate sound and visualizations that will be displayed on the screen. The visualizations will probably be layered over the user, and the sound will be constantly generated. Sound properties that will be controlled include volume, pitch, and wavetype, with perhaps occasional “sweet spots” on the screen in which a special sound is played.

As for the visualizations, these will be made to simulate the timbre of the sound itself. For example, if a sine wave is being generated, a more smooth visualization will be drawn, whereas a square wave will imply more rigidity. A rough sketch of how this might play out (without sound) is depicted below.

VERY rough sketch, will make more sense with audio.

Alec Albright – Looking Outwards – 12

“Skataviz” by Theo Watson and Emily Gobeille.
“Music Animation Machine” by Stephen Malinowski.

“Skataviz” (2012) by Theo Watson and Emily Gobeille and “Music Animation Machine” (2013) by Stephen Malinowski are two very different yet interesting projects that could serve as inspiration for my final project. The first, “Skataviz”, is a live motion detection program that visualizes the path of a skateboard as it travels in real time. This is admirable because it finely tracks the orientation of the board and is able to focus on only the subject’s board at any given time. However, it seems to overlook the potential use of these mappings. Instead, it simply displays the mapping rather than generating new innovative works from it.

The second project is more focused on demonstrating the cadence and dynamics of music through a computer visualization. This is different from “Skataviz” in that it does not do this in real time. Rather, it takes a musical score as an input and generates a visualization that is traversed in a rhythmical pattern specified by the user. This is admirable because of the way it is able to sync up with instrumental performance as well, as demonstrated in the video. Unlike “Skataviz”, this seems to overlook any real-time processing that, though computationally complex, could move as a function of the sound being produced by the performer.

Alec Albright – Project 11 – Landscape

sketch

// Alec Albright
// aalbrigh@andrew.cmu.edu
// Section B
// Project 11

var time = 0; // time of day (by frame rate)
var timeRate = 1; // rate of time passing
var angle = 0; // rotation angle of sun/moon system
var angleRate = 180 / 255; // rate of change of the angle 
var birdsX = []; // xcoords of birds on the screen
var birdsY = []; // ycoords of birds on the screen
var birdsSpeed = []; // speeds of all birds on the screen
var birdsColor = []; // colors of all birds on the screen

function setup() {
    createCanvas(480, 400);
    ellipseMode(CENTER);
    frameRate(30);
    angleMode(DEGREES);

    // birds
    for (var i = 0; i <= 30; i ++){
        birdsSpeed.push(random(1, 10));
        birdsX.push(600);
        birdsY.push(random(70, 320));
        birdsColor.push(color(random(0, 255), random(0, 255), random(0, 255)));
    }
}

function draw() {
    // managing time
    time += timeRate;
    if (time == 255) {
        timeRate = -1;
    } else if (time == 0) {
        timeRate = 1;
    }

    // coloring sky
    colorSky(time);
    
    // drawing sun/moon
    push();
    translate(240, 250);
    rotate(angle);
    drawSun(0, 200);
    drawMoon(0, -200);
    pop();
    
    angle -= angleRate

    // ground
    ground();
    
    for (var i = 0; i < birdsY.length; i ++){
        drawBird(birdsX[i], birdsY[i], birdsColor[i]);
        birdsX[i] -= birdsSpeed[i];

        if (birdsX[i] < -10) {
            birdsX[i] = 600;
        }
    }
}

function drawSun(x, y) {
    // draws sun
    noStroke();
    fill("yellow");
    ellipse(x, y, 100);
}

function drawMoon(x, y) {
    // draws moon
    noStroke();
    fill("grey");
    ellipse(x, y, 70);
}

function colorSky(time) {
    // draws the sky according to the time of day
    var blue = time;
    var green = map(time, 0, 255, 0, 204);

    noStroke();
    fill(0, green, blue);
    rect(0, 0, width, height);
}

function drawBird(x, y, color) {
    fill(color);
    noStroke();

    triangle(x, y, x - 3, y + 5, x, y + 5);
    triangle(x + 7, y, x + 13, y - 7, x + 11, y)
    rect(x, y, 15, 5);
    triangle(x + 5, y, x + 8, y - 7, x + 8, y);
}

function ground() {   
    fill("darkgreen"); 
    beginShape(); 
    for (var x = 0; x < width; x++) {
        var t = (x * .005) + (millis() * .0005);
        var y = map(noise(t), 0, 1, 150, 350);
        vertex(x, y); 
    }
    vertex(width + 100, height);
    vertex(0, height);
    endShape();
}

For this project, I wanted to depict something creative based in something very realistic. Thus, I came up with the idea of doing a rolling landscape that depicted the passing of days in a logical manner but featuring an assortment of randomly placed and colored birds. In this way, I am also able to emphasize the pop on the screen that the birds have in an interesting way.

The process was very difficult for me in automating everything correctly while still maintaining readability of code while debugging. Thankfully, however, I was able to get past that! Below are some initial sketches from my laptop as to what my first idea was.

Sketch from my laptop (please excuse the poor birds)

Alec Albright – Looking Outwards – 11

I am using a grace day on this assignment.

Video demonstration of “Knee Deep” by Emily Gobeille

In Emily Gobeille’s interactive children’s work, “Knee Deep”, she provides a playground for children to immerse themselves in other worlds, be it the ocean, outer space, or an animated nature scene. This project is admirable because it teaches children the potential joy that can be brought about by experimenting with creative computing. It gives them a taste of augmented reality that is probably unlike anything they’ve ever seen before. It also is a very good demonstration of live green-screening and image manipulation, detecting depth in order to properly place the children in a world, not just on a world.

As an artist, Emily Gobeille has a strong background in immersive visual design, and is an avid integrator of creative design and visual technologies. She often has a playful yet meaningful approach to her works, which is well-presented in “Knee Deep”. She is from Amsterdam, but she now resides in Brooklyn where she studies visual design, motion graphics, and interaction.

Alec Albright – Project 10 – Sonic Sketch

I am using one of my grace days on this assignment

sketch

// Alec Albright
// aalbrigh@andrew.cmu.edu
// Section B
// Project 10

var margin = 150;
var radius = 30;
var r = 0;
var g = 0;
var b = 0;
var rotation = 0;
var sine; // sine oscillator
var sineAmp; // sine amplitude
var sineFreq; // sine frequency
var sawtooth; // sawtooth oscillator
var sawtoothAmp; // sawtooth amplitude
var sawtoothFreq; // sawtooth frequency
var square; // square oscillator
var squareAmp; // square amplitude
var squareFreq; // square frequency

function setup(){
    createCanvas(640, 480);
    angleMode(DEGREES);
    useSound();
}

function soundSetup() { // setup for audio generation
    // making sine
    sine = new p5.Oscillator();
    sine.setType("sine");
    sine.start();

    // making sawtooth
    sawtooth = new p5.Oscillator();
    sawtooth.setType("sawtooth");
    sawtooth.start();

    // making square wave
    square = new p5.Oscillator();
    square.setType("square");
    square.freq(440);
    square.start();
}

function draw(){
    background("white");
    fill(r, g, b);

    // mapping angle of rotation to mouseY
    // as mouse moves up and down, shapes rotate
    rotation = map(mouseY, 0, height, 0, 360);

    // drawing hexagons with specified margin and rotation
    // center
    push();
    translate(width / 2, height / 2);
    rotate(rotation);
    hexagon(0, 0, radius);
    pop();
    // circle around center hexagon
    for(let i = 0; i < nvertex; i +=1){
        // finding exactly where the hexagon at hand is located
        // sin tells us where the y coordinate is
        var centerY = sin(angle) * margin;
        // cos tells us where the x coordinate is
        var centerX = cos(angle) * margin;
        // now draw the vertex at hand
        // setting up rotation for each individual hexagon
        push();
        translate(width / 2 + centerX, height / 2 + centerY);
        rotate(rotation);
        hexagon(centerX, centerY, radius);
        pop();
        // add the next portion of the angle
        angle = angle + (360 / 6)
    }
    
    // scaling mouseX to use the whole screen for size
    // as mouse moves right, shapes get bigger
    radius = map(mouseX, 0, width, 20, 70);
    
    // as mouse moves right, more red, more sine/less sawtooth
    r = map(mouseX, 0, width, 0, 255);
    // amplitude form 0 to 1
    sineAmp = map(mouseX, 0, width, 0, 1);
    sine.amp(sineAmp);
    // amplitude from .8 to 0 (bigger amplitude on left side)
    sawtoothAmp = map(mouseX, 0, width, .2, 1);
    sawtooth.amp(1 - sawtoothAmp);

    // as mouse moves down, more blue 
    b = map(mouseY, 0, height, 0, 255);
    // as mouse moves left, more green
    g = 255 - map(mouseX, 0, width, 0, 255);

    // frequency changes depending on whether we're in top half or bottom half
    if (mouseY <= height / 2) {
        // sine goes from 440 to 1760 Hz (2 octaves) if we're in the top half
        sineFreq = constrain(map(mouseY, 0, height / 2, 440, 1760), 440, 1760);
        sine.freq(sineFreq);

        // sawtooth frequency stabilizes at minumum value
        sawtooth.freq(110);
    } else {
        // sawtooth goes from 110 to 440 Hz (2 octaves) if we're in the bottom half
        sawtoothFreq = constrain(map(mouseY, height / 2, height, 110, 440), 110, 440);
        sawtooth.freq(sawtoothFreq);
     
        // sine frequency stabilizes at maximum value
        sine.freq(1760);
    }

    // if mouse is pressed, square wave can be changed
    if (mouseIsPressed) {
        // frequency mapped to the average of mouseX and mouseY, can go from 110 to 440 Hz 
        squareFreq = constrain(map((mouseX + mouseY) / 2, 0, 640, 110, 440), 110, 440);
        square.freq(squareFreq);

        // amplitude mapped to the distance from the center of x axis
        squareAmp = constrain(map(mouseX - (width / 2), -320, 320, 0, .8), 0, .8);
        square.amp(squareAmp);
    }

    // margin depends on mouseX, keeping same distance throughout
    margin = map(mouseX, 0, width, 50, 150);
}

// 6 vertices, as a hexagon has
var nvertex = 6;
// angle we're working at (when we get to TWO_PI, we're done)
var angle = 0;

function hexagon(x, y, radius){
    // draw a hexagon at (x, y) using beginShape()
    beginShape();
    // find each vertex's specific location
    for(let i = 0; i < nvertex; i += 1){
        // finding exactly where the vertex at hand is located
        // sin tells us where the y coordinate is
        var vertexY = y + sin(angle) * radius;
        // cos tells us where the x coordinate is
        var vertexX = x + cos(angle) * radius;
        // now draw the vertex at hand
        vertex(vertexX, vertexY)
        // add the next portion of the angle
        angle += (360 / 6)
    }
    // connect beginning and end points
    endShape(CLOSE)
}

For this assignment, I added sonic features to my Project 3 – Dynamic Drawing. I added a sine wave oscillator, a sawtooth wave oscillator, and a square wave oscillator. The mappings for the amplitude and frequency of these oscillators are as follows:

  1. As the mouse moves from left to right, the sine wave amplitude increases and the sawtooth wave amplitude decreases.
  2. As the mouse moves from top to bottom on the top half of the screen, the sine wave frequency gets higher (scaling up to two octaves).
  3. As the mouse moves from top to bottom on the bottom half of the screen, the sawtooth wave frequency gets higher (scaling up to two octaves).
  4. As the average of mouseX and mouseY increases, so does the frequency of the square wave.
  5. The closer to the middle of the x-axis the mouse is, the louder the square wave becomes.

Note: the square wave can only be adjusted if the mouse is pressed!!

This process was very interesting in testing harmonic balances in my dynamic drawing, as manifested by these mappings. I certainly see a lot more dimensionality in my drawing now because of the added sound layers!

Alec Albright – Looking Outwards – 10

I am using a Looking Outwards grace day for this assignment.

Alphard, a piece generated by Iamus

In 2013, professor Francisco Vico of the University of Malaga created Iamus, a computer that can generate classical music scores at the touch of a button. According to Vico, Iamus’s scores become increasingly more complex as they evolve throughout their duration, giving them a dynamic flow beyond a random progression of notes. The algorithm behind Iamus is inspired by human biological processes, and then a human selects from the pieces Iamus provides. This work is admirable because it is ground breaking, introducing artificial intelligence to the world of art and music in a new way. It is very interesting to see the progression of these technologies, and Iamus is just the beginning of a new era in the world of music.

Alec Albright – Project 09 – Portrait

sketch

// Alec Albright
// aalbrigh@andrew.cmu.edu
// Section B
// Project 09

var original; // original image
var words; // bank of words to be displayed

function preload(){
    // original image URL
    var imageURL = "https://i.imgur.com/pfJvLUW.jpg";
    // load original image
    original = loadImage(imageURL);

    // populating the words array
    words = ["Years", "from", "now", "our", "past", "will", "be", "a", "story"];
}

function setup(){
    createCanvas(384, 480);

    // resize image to fit in constraints
    original.resize(384, 480);
    // load pixels
    original.loadPixels();

    background("black");
    frameRate(20);
}

function draw(){
    // initializing random places to place words
    var px = random(width);
    var py = random(height);

    // to be used for finding the color from the original image
    var ix = constrain(floor(px), 0, width-1);
    var iy = constrain(floor(py), 0, height-1);

    // getting color from original image
    var theColorAtLocationXY = original.get(ix, iy);

    // text size dependent on mouseX
    textSize(map(mouseX, 0, 384, 8, 14));


    // displaying words dependent on where they're placed
    // top row
    if(py < 160) {
        // "years"
        if(px < 128) {
            fill(theColorAtLocationXY);
            text(words[0], px, py);
        // "from"
        } else if(px >= 128 & px < 256) {
            fill(theColorAtLocationXY);
            text(words[1], px, py);
        // "now"
        } else {
            fill(theColorAtLocationXY);
            text(words[2], px, py);
        }
    // middle row
    } else if(py >= 160 & py < 320) {
        // "our"
        if(px < 128) {
            fill(theColorAtLocationXY);
            text(words[3], px, py);
        // "past"
        } else if(px >= 128 & px < 256) {
            fill(theColorAtLocationXY);
            text(words[4], px, py);
        // "will"
        } else {
            fill(theColorAtLocationXY);
            text(words[5], px, py);
        }
    // bottom row
    } else {
        // "be"
        if(px < 128) {
            fill(theColorAtLocationXY);
            text(words[6], px, py);
        // "a"
        } else if(px >= 128 & px < 256) {
            fill(theColorAtLocationXY);
            text(words[7], px, py);
        // "story"
        } else {
            fill(theColorAtLocationXY);
            text(words[8], px, py);
        }
    }

    // fill in dots depending on where the mouse is
    var mouseColor = original.get(mouseX, mouseY);
    noStroke();
    fill(mouseColor);
    ellipse(mouseX, mouseY, 5);
}

In approaching this project, I immediately knew I wanted to create a portrait of my long-time girlfriend, displaying our favorite quote: “Years from now, our past will be a story”. I wasn’t quite sure how to go about displaying the quote, so I decided to section off areas of the canvas for each specific word so it read like a book from left to right and top to bottom. Once this was ironed out, the difficult part was implementing text size so that the quote was readable but also allowed for a decently quick creation of the image. Thus, I used this as an opportunity to implement a cool feature, so I mapped text size to the x coordinate of the mouse.

30 seconds
1 minute
A couple minutes
Approximately 7 minutes
Original Image!

Alec Albright – Looking Outwards – 09

3D printed Adidas shoe
Inside look of the Carbon x Adidas collaboration

The Looking Outwards post that I found particularly interesting was Stefanie Suk’s Looking Outwards 03, in which she discussed Adidas’s recent initiative to create 3D printed shoes. This project has consisted of a partnership between Adidas and Carbon, and the above shoe is one of the first to be created through their method of Digital Light Synthesis.

I agree with Stefanie in the way that this project is admirable because its impact on the sustainability of the shoe manufacturing industry. The method that Adidas and Carbon are using to create these shoes is very environmentally friendly and minimizes waste. I would also add that the creation of 3D printed shoes is a progressive direction for the general clothing manufacturing industry, entering into a space with an abundance of potential. This is a groundbreaking project with a very positive upside.

Alec Albright – Looking Outwards – 08

Brian House is currently an Assistant Professor of Art and Studio Head of Digital Media at Lewis and Clark College in Portland, Oregon. He holds a PhD in Computer Music and Multimedia from Brown University. His artwork primarily involves the relationship between natural rhythms in the human body, the environment, and technology. He describes some of his current interests as “extractive industries and urban rats,” attesting to his research-oriented artworks.

His work is particularly admirable to me because it is largely data-driven, often incorporating music as well. One of his works, “Decomposition”, was a series of double bass music pieces derived from data describing the thousand-year process of plastic decaying if not properly disposed of.

His presentation skills involve a lot of trying to make the audience understand his methods of thinking throughout his creative process, embedding first point of view videos, quotes, etc. that make his presentation very intriguing. This could definitely be helpful for me in the future.

His website can be found at https://brianhouse.net/ .