Carly Sacco – Project 04 – String Art

sketch

//Carly Sacco
//Section C
//csacco@andrew.cmu.edu
//Project 4

var x1 = 5;
var x2 = 9;
var y1 = 5;


function setup() {
	createCanvas(400, 300);
}

function draw() {
	background(0);
	
	for (var i = x1; i < 400; i += y1){
		
	  //blue curves
	  stroke(95, 158, 176); 
	  line(i + 200, 300, i * x2 + mouseX, i); 
	  line(i + 200, 300, -i * x2 + -mouseX, i);
	  
	 //green
	  stroke(109, 199, 111);
	  line(i, 0, x1 * 80, i);
	  
	 //orange
	  stroke(214, 56, 39); 
	  //line(i + 400, 0,  -x2 * 10, i * 5); 
	  line(i, 300,  0, i);
	 
	  //purple
	  stroke(173, 142, 212);
	  line(i * x1, y1, 500, i * 10);
	  
	} 
}


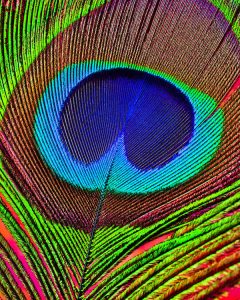
Once I had made the blue curves that work oppositely of each other they reminded me of wings of a bird. I then decided to make the other curves mimic the shape of a peacock’s feather and chose the colors accordingly.

Alec Albright – Project 04 – String Art

sketch

// Alec Albright
// aalbrigh@andrew.cmu.edu
// Section B
// Project 04


var x1StepSize = 5;
var y1StepSize = 0;
var x2StepSize = 0;
var y2StepSize = -4;
var x1 = 0;
var y1 = 150;
var x2 = 200;
var y2 = 150;


function setup() {
    createCanvas(400, 300);
    background("black");
}
 
function draw() {
    // top left 
    makeCurve("red");

    // top right
    x1 = 400;
    y1 = 150;
    x2 = 200;
    y2 = 150;
    x1StepSize = -5;
    y2StepSize = -4;
    makeCurve("limegreen");

    // bottom left
    x1 = 0;
    y1 = 150;
    x2 = 200;
    y2 = 150;
    x1StepSize = 5;
    y2StepSize = 4;
    makeCurve("yellow");

    // bottom right
    x1 = 400;
    y1 = 150;
    x2 = 200;
    y2 = 150;
    x1StepSize = -5;
    y2StepSize = 4;
    makeCurve("purple");

    // bottom left, top left
    x1 = 0;
    y1 = 225;
    x2 = 100;
    y2 = 225;
    x1StepSize = 2.5;
    y2StepSize = -1.75;
    makeCurve("red");

    // bottom left, bottom left
    x1 = 0;
    y1 = 225;
    x2 = 100;
    y2 = 225;
    x1StepSize = 2.5;
    y2StepSize = 1.75;
    makeCurve("yellow");

    // bottom left, top right
    x1 = 200;
    y1 = 225;
    x2 = 100;
    y2 = 225;
    x1StepSize = -2.5;
    y2StepSize = -1.75;
    makeCurve("limegreen");

    // bottom left, bottom right
    x1 = 200;
    y1 = 225;
    x2 = 100;
    y2 = 225;
    x1StepSize = -2.5;
    y2StepSize = 1.75;
    makeCurve("purple");

    // top left, top left
    x1 = 0;
    y1 = 75;
    x2 = 100;
    y2 = 75;
    x1StepSize = 2.5;
    y2StepSize = -1.75;
    makeCurve("red");

    // top left, bottom left
    x1 = 0;
    y1 = 75;
    x2 = 100;
    y2 = 75;
    x1StepSize = 2.5;
    y2StepSize = 1.75;
    makeCurve("yellow");

    // top left, top right
    x1 = 200;
    y1 = 75;
    x2 = 100;
    y2 = 75;
    x1StepSize = -2.5;
    y2StepSize = -1.75;
    makeCurve("limegreen");

    // top left, bottom right
    x1 = 200;
    y1 = 75;
    x2 = 100;
    y2 = 75;
    x1StepSize = -2.5;
    y2StepSize = 1.75;
    makeCurve("purple");

    // top right, top left
    x1 = 200;
    y1 = 75;
    x2 = 300;
    y2 = 75;
    x1StepSize = 2.5;
    y2StepSize = -1.75;
    makeCurve("red");

    // top right, bottom left
    x1 = 200;
    y1 = 75;
    x2 = 300;
    y2 = 75;
    x1StepSize = 2.5;
    y2StepSize = 1.75;
    makeCurve("yellow");

    // top right, top right
    x1 = 400;
    y1 = 75;
    x2 = 300;
    y2 = 75;
    x1StepSize = -2.5;
    y2StepSize = -1.75;
    makeCurve("limegreen");

    // top right, bottom right
    x1 = 400;
    y1 = 75;
    x2 = 300;
    y2 = 75;
    x1StepSize = -2.5;
    y2StepSize = 1.75;
    makeCurve("purple");

    // bottom right, top left
    x1 = 200;
    y1 = 225;
    x2 = 300;
    y2 = 225;
    x1StepSize = 2.5;
    y2StepSize = -1.75;
    makeCurve("red");

    // bottom right, bottom left
    x1 = 200;
    y1 = 225;
    x2 = 300;
    y2 = 225;
    x1StepSize = 2.5;
    y2StepSize = 1.75;
    makeCurve("yellow");

    // bottom right, top right
    x1 = 400;
    y1 = 225;
    x2 = 300;
    y2 = 225;
    x1StepSize = -2.5;
    y2StepSize = -1.75;
    makeCurve("limegreen");

    // bottom right, bottom right
    x1 = 400;
    y1 = 225;
    x2 = 300;
    y2 = 225;
    x1StepSize = -2.5;
    y2StepSize = 1.75;
    makeCurve("purple");
}

// makes a curve based on any color
// x1, y1, x2, y2, and step sizes must be predefined
function makeCurve(color){
    for (i = 0; i < 41; i ++) {
        stroke(color);
        line(x1, y1, x2, y2);
        x1 += x1StepSize;
        y1 += y1StepSize;
        x2 += x2StepSize;
        y2 += y2StepSize;
        noLoop();
    }
}

Throughout my process of creating this visualization, I had to get more familiar with how exactly the string art is generated in terms of the size of steps in the sequence. Once I got a good feel for that, I was able to utilize my knowledge of the coordinate system to make the same image in a variety of interesting places.

Danny Cho – Project 4 – String Art

LineDrawing

// Danny Cho
// changjuc
// Section: A

var rate1 = 0;
var rate2 = 0;
var rate3 = 0;
var rate4 = 0;

function setup() {
  createCanvas(400, 300);

  noStroke(); 
}


function draw(){
	background(0);
	//living vertex with two moving curves (exploration)
	noFill();
	strokeWeight(1);
	for (var i = 0; i <= 20; i++) {
	noFill();
	strokeWeight(1);
	stroke(100);
	beginShape();
	vertex(0, 30 * cos(radians(rate2)));
	quadraticVertex(20 * i, i * 30 * cos(radians(rate2)), 400, 300);
	quadraticVertex(20, i * 30 * sin(radians(rate2)), 0, 20 * i);
	vertex(400, 0);
	endShape();
	}
	
	//first curve: waves horizontally at rate1
	for (var i = 0; i <= 20; i++) {
			stroke('green');
		line(20 * i * cos(radians(rate1)), 0, 0, 300 - (20 * i) * sin(radians(rate1)));
	}
	rate1 = rate1 + .6;
	//second curve: waves horizontally at rate2

	for (var i = 0; i <= 20; i++) {
		stroke('blue');
		line(20 * i * sin(radians(rate2)), 0, 0, 300 - (20 * i) * cos(radians(rate2)));
	}
	rate2 = rate2 + 1;
	//third curve: waves in a clockwise direction
	for (var i = 0; i <= 20; i++) {
			stroke('red');
		line(0, 300 - (20 * i) * cos(radians(rate4)), 20 * i * tan(radians(rate4)), 0);
	}
	rate4 = rate4 + .6;
	//fourth curve: waves of changing strokeweight

	for (var i = 0; i <= 40; i++) {
		if (i%2 == 0) {strokeWeight(5);}
		else {strokeWeight(1);
			
		}
		stroke(200);
		line(400, i * 10 * cos(radians(rate3)), width - (i * 10 * cos(radians(rate3))), 300);
	}
	rate3 = rate3 + 0.8;


}


I wanted to continue to work with constantly changing geometry at an organic rate. The next step might be making a solid form that also morphs in an organic way?

Emma N-M-Project-04(String Art)


stringArt1

/* 
Emma Nicklas-Morris
Section B
enicklas
Project-04
String Art
*/

var x1StepSize = 4;
var y1StepSize = 1;
var x2StepSize = -2;
var y2StepSize = -20;
var x1;
var x2;
var y1;
var y2;


function setup() {
    createCanvas(400, 300);
    background("black");
    x1 = 0;
    y1 = 0;
    x2 = width/3 + 100;
    y2 = height/3 + 50;


}
 
function draw() {
    
    for (var i = 0; i < 350; i += 5) {
        push();
        translate(width/2, height);
        stroke(23, 233, 250);
        line(x1, y1, x2, y2);
        x1 += x1StepSize;
        y1 += y1StepSize;
        // x2 += x2StepSize;
        // y2 += y2StepSize;
        pop();

        stroke("hotpink");
        push();
        translate(width, height/2);
        rotate(degrees(90));
        line(x1, y1, x2, y2);
        // x1 += x1StepSize;
        // y1 += y1StepSize;
        x2 += x2StepSize;
        y2 += y2StepSize;
        pop();

        push();
        translate(0, 0);
        rotate(degrees(10));
        stroke("yellow");
        line(x1, height, width, y2);
        x1 += x1StepSize;
        pop();

        if (i % 25 === 0) {
            stroke("limegreen");
            line(0, y1, width-x2*2, height);
        }
    

    }

    
}

I started with playing around with different x and y positions, but then I didn’t like how static and boring it looked. So I moved to making circles with only lines.

stringArt2

/* 
Emma Nicklas-Morris
Section B
enicklas
Project-04
String Art
*/


var midpoinX;
var midpointY;
var r;
var ai;
var slope;
var b;
var x3;
var y3;
var x4;
var y4;
var k; 
var cosAg;
var sinAg;
var sinAi;
var scaledR;


function setup() {
    createCanvas(400, 300);
    

}
 
function draw() {
    background("black");

    var maxInc = 90; // maximum step increase in the for loop
    var minInc = 3; // minimum step increase in the for loop
    var d = (maxInc - minInc)/width; // value to change mouse position to a smaller value

    // keeps the mouse value inside the canvas
    if (mouseX >= width) {
        mouseX = width;
    }
    else if (mouseX < 0) {
        mouseX = 0;
    }

    if (mouseY > height) {
        mouseY = height;
    }
    else if (mouseY < 0) {
        mouseY = 0;
    }

    var r1 = mouseY/6 + 50; // as mouseY increases, radius increases (max radius = 100, min radius = 50)
    var r2 = 100 - mouseY/6; // as mouseY increases, radius decreases (max radius = 100, min radius = 50)
    var change1 = int(d * mouseX) + minInc; // mouseX changes the amount of lines to make the cirlce (max lines = 120, min lines = 4)
    var change2 = maxInc - int(d * mouseX); // mouseX changes the amount of lines to make the cirlce (max lines = 120, min lines = 4)
    
    // draws pink circle
    push();
    translate(width/3, height/2);
    circles(r2, 8, change1, "hotpink");
    pop();

    // draws light green circle
    push();
    translate(2 * width/3, height/2);
    circles(r1, 8, change2, "lightgreen");
    pop();

    // draws yellow circle
    push();
    translate(width/6, height - change1);
    circles(r1, 8, change1, "yellow");
    pop();

    // draws blue circle
    push();
    translate(width - change2, height/6);
    circles(r2, 8, change2, "aqua");
    pop();

} 


function circles(r, k, inc, hue) {
    for (var ag = 0; ag <= 360; ag += inc) {
        angleMode(DEGREES);
        ai = 90 - ag; // 3rd angle in the triangle created from the tangent line and x axis
        cosAg = cos(ag);
        sinAg = sin(ag);
        sinAi = sin(ai);
        scaledR = k * r; // makes the line longer (or shorter)
        midpointX = r * cosAg; // line's midpoint x position
        midpointY = r * sinAg; // line's midpoint y position

        if ((ag === 0) || (ag === 180)) { // verticle lines
            x3 = r * cosAg;
            y3 = -scaledR;
            x4 = r * cosAg;
            y4 = scaledR;
        }

        else if ((ag === 90) || (ag === 270)) { // horizontal lines
            x3 = -scaledR;
            y3 = r * -sinAg;
            x4 = scaledR;
            y4 = r * -sinAg;
        }

        // not a verticle or horizontal line
        // uses geometry, law of sines, and unit circle to get end points of line
        else {
            slope = ((r * -sinAg) / (r * cosAg - (r / sinAi)));
            b = -slope * (r / sinAi);
            x3 = r * cosAg - scaledR;
            y3 = (slope * x3) + b;
            x4 = r * cosAg + scaledR;
            y4 = (slope * x4) + b;
        }

        stroke(hue);
        line(x3, y3, x4, y4);
    }
}

It took a while to get the lines to move around tangential to the circle. There was a lot of math and geometry that I needed a refresher on to get the lines to make a circle. Once the circles were drawn statically, I then used the mouse position to make the circle change in various ways. 
Jai Sawkar Project 04 – String Art

Sketch

// Jai Sawkar
// jsawkar@andrew.cmu.edu
// Section C
// Project 04 

function setup() {
    createCanvas(400, 300);
}

function draw() {
    background('#15274d');
    var x0 = 0;
    var y0 = 0;
    var x1 = width;
    var y1 = height;
    var y2 = height + 20
    var x2 = i - 34
    var x3 = width/2
    var y3 = height/3

    for (var i = 0; i < 50; i ++) {
         //white Eye
        stroke('#aab3aa')
        strokeWeight(.25)
        line(x1 + 60, (11 * i) - 110, 5 * i + 90, height/2)

        //white 2 Eye
        line(width/2, 5 * i - 40, 12 * i - 34, y2)

        //green
        strokeWeight(2); 
        stroke(86, 166, 85);
        line(x0, 5 * i - 40, 15 * i - 34, y2)

        //blue
        strokeWeight(2);
        stroke('#375dad');
        line(x1 + 60, 8 * i, 5 * i, 0)
      
} 
}

For this project, my aim was to use strings to create an abstract image of the Seattle Seahawks. Along with the use of the color schemes, I aimed to create the “eye” that the team uses in their logo schemes.

Sarah Choi – Project – 04 – Generative Art


project-04

//Sarah Choi 
//Section D
//sychoi@andrew.cmu.edu
//Project-04

function setup() {
    createCanvas(400,300);
} 

function draw() {
    background(0);
    for(var i = 0; i < 400; i += 2) {
        stroke(255);
        strokeWeight(0.2);
        line(i, mouseY / 2 + 200, 400, - i);
    }
    for(var a = 0; a < 400; a++) {
        fill(255, 0, 0);
        strokeWeight(0.5);
        line(a, - a + mouseX / 5, 400, - a);
    }
    for(var b = 0; b < 400; b += 5) {
        stroke(255, 255, 0);
        strokeWeight(0.5);
        line(mouseX - 150, - b, 400, b);
    }
    for(var c = 0; c < 400; c += 5) {
        stroke(255, 0, 255);
        line(mouseY - 100, c, 400, - c);
    }
    for(var d = 0; d < 400; d += 0.5) {
        stroke(255, 100, 100);
        strokeWeight(0.2)
        line(d, - mouseY, 400, d);
    }
}

Using string art, I wanted to create abstract art playing around with primary and complimentary colors along with a black background. I wanted my piece to follow the mouse, so it would be more interactive with the audience. 

Yoshi Torralva – Project 04 – String-Art


sketch

Using string art, I wanted to create a shell-like formation. I used multiple lines in the for() statement to create a swirling visual. Mouse tracking was implemented to add depth as it served as a frame into the shell.

// Yoshi Torralva
// Section E
// yrt@andrew.cmu.edu
// Project 04
function setup() {
    createCanvas(300, 400);
}

function draw() {
    background(0, 191, 255);
    /* for loop making 40 lines
    which allows for 10px spacing */
    for(var i = 0; i < 40; i++) {
    /* mouseX and Mouse Y move the string art */
    strokeWeight(1);
    stroke(255);
    //moving string art
    line(mouseX, i * 10, 0 + i * 10, mouseY);
    // flipped mouseX and mouse Y to create opposite scaling
    line(mouseY, i * 10, 0 + i * 10, mouseX);
    strokeWeight(0.2);
    //string art starting at top x height 
    // 10 px width between each line
    // increments of 50
    line(i * 10, 0, 300, 0 + i * 10);
    line(i * 10, 0, 250, 0 + i * 10);
    line(i * 10, 0, 200, 0 + i * 10);
    line(i * 10, 0, 150, 0 + i * 10);
    line(i * 10, 0, 100, 0 + i * 10);
    line(i * 10, 0, 50, 0 + i * 10);
    //string art at bottom x height
    // 10 px width between each line
    // increments of 50
    line(250, i * 10, 0 + i * 10, 400);
    line(200, i * 10, 0 + i * 10, 400);
    line(150, i * 10, 0 + i * 10, 400);
    line(100, i * 10, 0 + i * 10, 400);
    line(50, i * 10, 0 + i * 10, 400);
    }
}
 

Claire Lee – Project 04 – String Art

sketch

/*
Claire Lee
15-104 Section B
Project - 04
*/

var canvasW = 400;
var canvasH = 300;
var lineR = 0;
var lineG = 255;
var lineB = 200;

function setup() {
    createCanvas(canvasW, canvasH);
    strokeWeight(1);
}

/*function draw() {
    background(0);
    for (var i = 30; i < 600; i += 30) {
        fill(255);
        line(i, 0, 1.5*i, 300);
    } 

}*/

function draw() {
    background(0);
    for (var i = 20; i < 400; i += 20) {   
      line(i, 0, canvasW, 0.5*i);
      stroke(lineR + i, lineG, lineB); 

      line(canvasW, canvasH, i, 0);
      stroke(lineR + i, lineG, lineB);

      line(0, i, i - 5, canvasH); 
      stroke(lineR + i, lineG, lineB);

      line(canvasW, i, -0.5*i, canvasH);
      stroke(lineR + i, lineG, lineB);
    }

}

For my string art project, I tried to construct an abstract piece based on the form of a leaf. Initially, it was a little difficult to understand how the relationships of the lines and edges changed with respect to i, but it was fairly easy once I figured out how to draw the first curve. I also tried to incorporate gradients into the coloring of this piece as well, and was very satisfied with the result.

Timothy Liu — Project 04 — String Art

tcliu-openended-04

// Timothy Liu
// 15-104 Section C
// tcliu@andrew.cmu.edu
// Openended-04

// initializing variables!
var x1;
var y1;
var x2;
var y2;

var x3;
var y3;
var x4;
var y4;

var x5;
var y5;
var x6;
var y6;

var x7;
var y7;
var x8;
var y8;

var x;
var y;

var sx1;
var sy1;
var sx2;
var sy2;

var angle = 0;

function setup() {

    createCanvas(400, 300);

    // initial coordinates for star
    sx1 = -5;
    sy1 = -5;
    sx2 = 5;
    sy2 = 5;

    // initial coordinates for lower left dark blue lines
    x1 = 0;
    y1 = -250;
    x2 = 0;
    y2 = height;

    // initial coordinates for upper right cyan lines
    x3 = -150;
    y3 = 0;
    x4 = width;
    y4 = 0;

    // initial coordinates for upper left gold lines
    x5 = 0;
    y5 = height + 250;
    x6 = 0;
    y6 = 0;

    // initial coordinates for lower right light teal lines
    x7 = -150;
    y7 = height;
    x8 = width;
    y8 = height;

}

function draw() {

    // variables that make sure the mouse is constrained within the canvas
    x = max(min(mouseX, 400), 0);
    y = max(min(mouseY, 300), 0);

    // background color
    background("#010a43");
    
    // dark blue lines in the lower left. This for loop makes the lines flare out to form a convex curve
    // facing up and right; x and y (variables with mouseX and mouseY) allow the lines to ripple as the mouse moves.
    for (var a = 0; a < 900; a += 8) {
        stroke("#394a6d");
        line(x1, y1 + a - y / 2, x2 + a - x / 2, y2);
    }

    // cyan lines in the upper right. This for loop makes the lines flare out to form a convex curve
    // facing down and left; mouseX and mouseY allow the lines to ripple as the mouse moves.
    for (var b = 0; b < 900; b += 8) {
        stroke("#216583");
        line(x3 + b - y / 2, y3, x4, y4 + b - x / 2);
    }

    // gold lines in the upper left. This for loop makes the lines flare out to form a convex curve
    // facing down and right; x and y allow the lines to ripple as the mouse moves.
    for (var c = 0; c < 900; c += 8) {
        stroke("#f7be16");
        line(x5, y5 - c - x / 2, x6 + c - y / 2, y6);
    }   

    // light teal lines in the lower right. This for loop makes the lines flare out to form a convex curve
    // facing up and left; x and y allow the lines to ripple as the mouse moves.
    for (var d = 0; d < 900; d += 8) {
        stroke("#00818a");
        line(x7 + d + x / 2, y7, x8, y8 - d + y / 2);
    }

    // star that follows the mouse. The rotating star is meant to convey the dynamic nature of my piece,
    // as well as imply the fact that the user can move the mouse to alter the piece.
    push();
    translate(mouseX, mouseY);
    rotate(radians(angle));
    for (var s = 0; s < 16; s += 15) {
        stroke("#f7be16");
        line(sx1, sy1 + s / 4, sx2, sy2 - s / 4);
    }
    for (var s = 0; s < 16; s += 15) {
        stroke("#f7be16");
        line(sx1 + s / 4, sy1, sx2 - s / 4, sy2);
    }
    for (var s = 0; s < 16; s += 15) {
        stroke("#f7be16");
        line(sx1, sy1 + s / 2, sx2, sy2 - s / 2);
    }
    for (var s = 0; s < 16; s += 15) {
        stroke("#f7be16");
        line(sx1 + s / 2, sy1, sx2 - s / 2, sy2);
    }
    pop();
    angle = angle + 1;

}

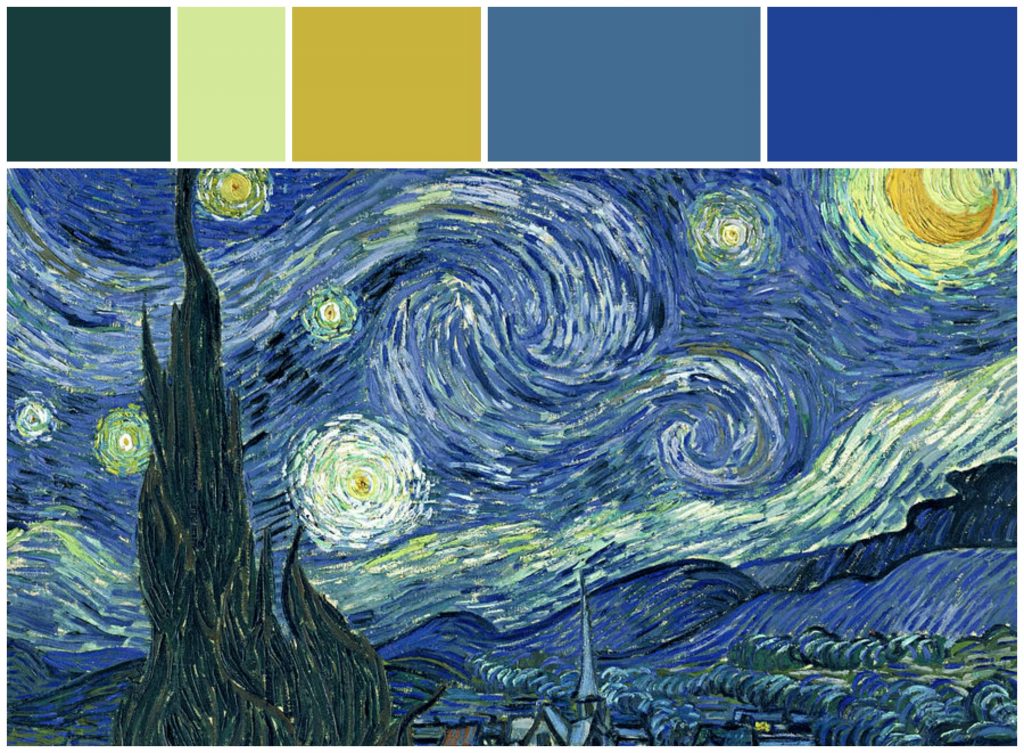
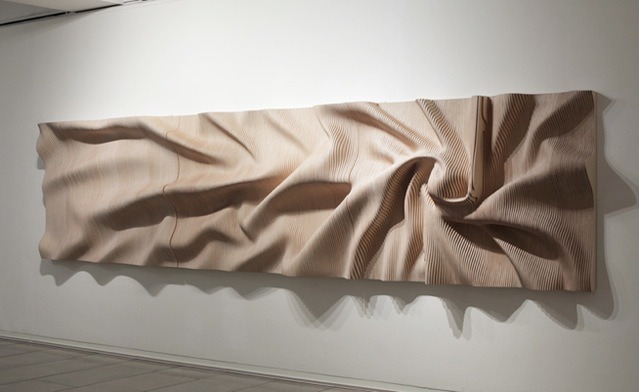
My project this week was inspired by the color palette from Van Gogh’s “Starry Night.” I wanted my string art to feel both clean and dynamic, and I immediately knew I wanted to have multiple convex curves framing the center of my piece. I was also inspired by my Looking Outward piece from last week; I looked at a piece of wood that had a rippling effect, and I wanted to convey that sense of dynamic motion as well. In order to do that, I chose to have my strings be responsive to the mouse’s motion, and I created a spinning yellow star that follows the mouse to further imply motion.

Van Gogh’s “Starry Night,” which is comprised of similar blue, teal, and yellow colors as the ones in my piece.
A wooden-ripple work by Christoph Hermann that I reviewed for my Looking Outwards 03.

Katrina Hu – Project 04 – String Art

sketch_project4

/*Katrina Hu
15104-C
kfh@andrew.cmu.edu
Project-04-String Art*/


function setup() {
    createCanvas(400, 300);
    background(0);
}

function draw() {
    background(0);
    //yellow curve
    for(var i = 0; i < 400; i += 5) {
        stroke(255, 250, 158);
        strokeWeight(0.5);
        line(i, mouseY, 400 , i);
    }
    //green curve
    for(var b = 0; b < 400; b += 5) {
        stroke(167, 255, 158);
        strokeWeight(0.5);
        line(b, mouseX, 400 , b);
    }
    //pink curve
    for(var a = 0; a < 400; a += 5) {
        stroke(255, 158, 158);
        strokeWeight(0.5);
        line(mouseY, a, a, 300);
    }
    //blue curve
    for(var c = 0; c < 400; c += 5) {
        stroke(158, 243, 255);
        strokeWeight(0.5);
        line(mouseX, c, c, 300);
    }
}

This was a fun project to do to experiment with different lines and colors. It was also interesting so see how the lines shifted with the mouse.