![[OLD FALL 2020] 15-104 • Introduction to Computing for Creative Practice](../../../../wp-content/uploads/2021/09/stop-banner.png)
Taeyoon Choi is an artist, educator, and activist who works in New York and Seoul. He studied in the Art Institute of Chicago and Korea Advanced Institute of Science and technology and holds a BFA and MS respectively. He presents his work as an intersection between art and technology, physical technology as a platform for understanding life and the experience of it. He presents his technological work as a design and artistic process where he pursues creative moments when they’re provided to him. For instance, the project he started with was the creation of a computer from scratch. He educated himself in the language of computers and through practice and innovation eventually created his own version of what a computer could/should be. And further extending from that was experimentation of time and computing in which he created a machine that would capture the users own sense of time. After watching him present his work and process, I’ve gained a deeper appreciation for the contemporary integration of technology and artistic expression.
Month: October 2020
Eyeo 2015 – Nicky Case from Eyeo Festival on Vimeo.
Nicky Case is an extraordinary person. Nicky moved from Singapore to Canada at a young age. They largely confronted the world on their own, leaving home at age 16 after coming out as LGBTQ+ and not being accepted by their family. Nicky went on to pursue an internship at a video game development company, where they were faced with the idea “do video games matter?” which stuck with them ever since.
Nicky is an interactive storyteller. They develop deeply personal yet relatable games with nuanced choices that the user can make. Those choices are intended to cause the user to reflect on some aspect of society and identity. I really admire this aspect of Nicky’s work. While commonly played games tend to be relatively surface level, Nicky thinks about poignant, often subtle moments in life, and allows people to play through those moments to increase their own self awareness. It is a greatly heightened connection between game, player, and the developer. Nicky’s most popular game is probably their “Coming Out Simulator” which is autobiographical and follows the choices a young asian teen faces when coming out. Another one of my favorite works is “We become what we behold” which is a commentary on manipulation of the media and biases we develop. The games typically have simple often cute graphics, and easy game play that purposefully and effectively communicate their overarching ideas.
In regards to how Nicky presents, honestly when first watching their lecture I thought it was somewhat awkward with some jokes falling flat. However, thinking back, the message of the lecture stays with me, concerning telling stories through systems as well as making systems out of stories. What worked about the presentation was how Nicky presented in the method of the ideas they were discussing – Interweaving anecdotes and structure, all the while in a human, relatably not-smooth-sailing way, makes the presentation all the more memorable.
LookingOutwards-08
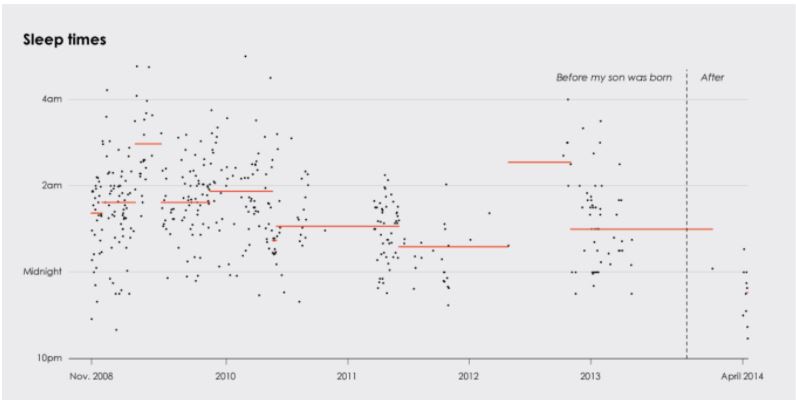
Nathan Yau was who I wrote about in my last Looking Outwards and he spoke in the 2019 Eyeo where he elaborates on his design journey. He specializes in creating data visualizations that are easy to read and concise. He created the website Flowingdata.com where he creates data visualizations for himself and others. He is also the author of both Data Points: Visualization That Means Something and Visualize This: The FlowingData Guide to Design, Visualization, and Statistics. Essentially he wants to make data more accessible and easier to read to everyday people.
What I admire is that he is a designer for the people. Nathan designs with the idea that data is only effective if it is able to get the message across without boring or confusing the reader. He even creates visual representations of his own personal life that other people may not be interested in. He creates them for himself, where he can see the relationships between data only he finds relevant. He mentions that he recently has a child and made a chart about when he sleeps. He is able to easily analyze and interpret all this information because of his visualization skills. He talks about his approach to data visualizations in a comedic and sentimental way and relating how he found his passion for his growth. His explanation and story reinforce the idea of simple yet developed data visualizations.
LO 08 – The Creative Practice of an Individual
YOUR OWN MULTIVERSE
Meow Wolf
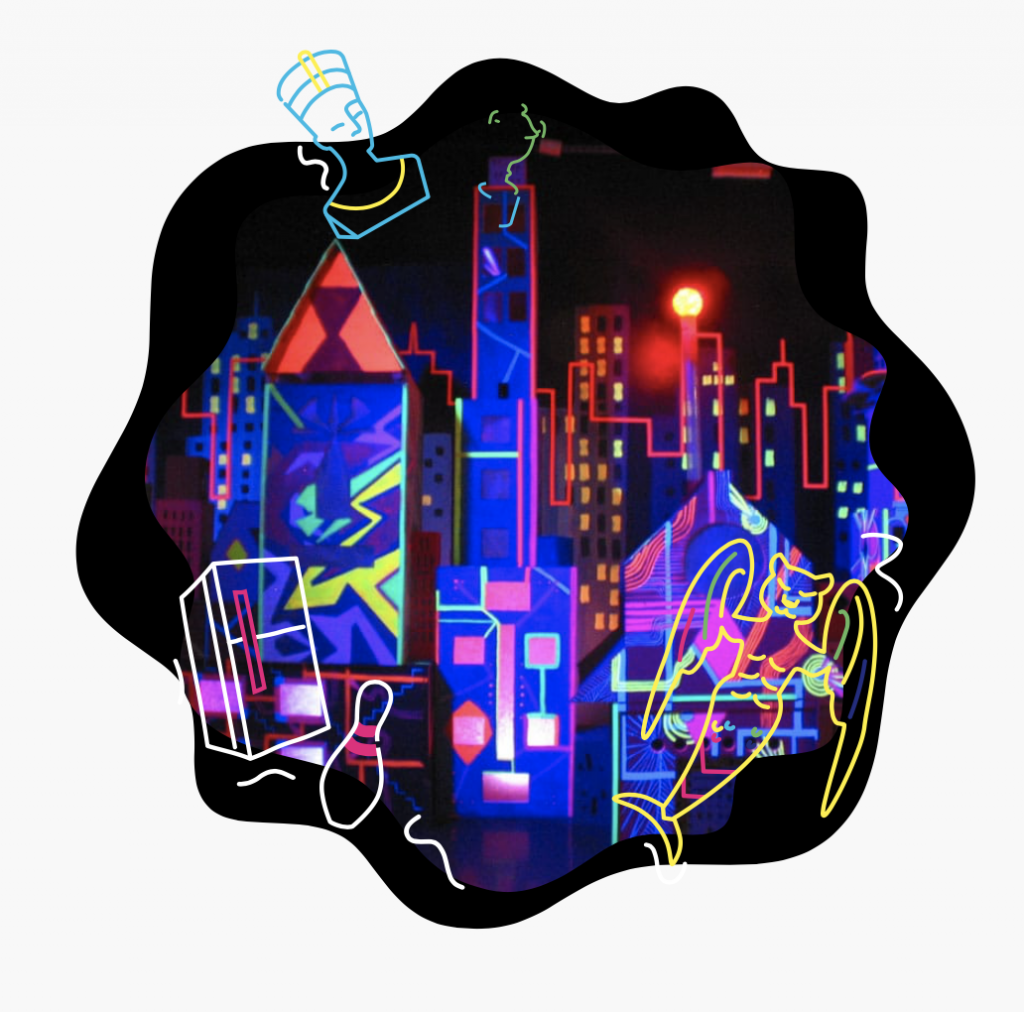
I watched the Vimeo video about Meow Wolf, where they talk about reasons why they succeeded, and the early history of Meow Wolf as an art collective. Meow Wolf is an arts and entertainment group based in Santa Fe, New Mexico. They established in 2008 as an art collective with a special emphasis on the DIY technological aspects of immersive art. I admire this group because of their work (obviously) but also their mission statement. They believe in accomplishing artists being compensated on an equal level with other skilled, in-demand professionals (a societal issue that is very prominent today) and that successful businesses must give back and participate in their communities. As an art collective, not only do they create mesmerizing user experiences, but also provide financial assistance, expertise, and other forms of active support. Meow Wolf captivates the audience by introducing their mission through anecdote and humor adding levity to the expo.
View Portfolio here
Project – 07
sketch
//Shaun Murray,
//shaunmur - Section B

var nPoints = 2500
var R, G, B;
var mX, mY


function setup() {
    createCanvas(400, 400);
}

function draw() {
    mX = mouseX
    mY = mouseY

	background(mX - 75, mY - 50, mX - 150);
	push();
	translate(mX, mY);
	epi(0, 0);
	pop();

	push();
	translate(mX - 100, mY - 100);
	epi(0, 0);
	pop();

	push();
	translate(mX + 100, mY + 100);
	epi(0, 0);
	pop();

	push();
	translate(mX + 100, mY - 100);
	epi(0, 0);
	pop();

	push();
	translate(mX - 100, mY +100);
	epi(0, 0);
	pop();

	push();
	translate(mX - 200, mY);
	epi(0, 0);
	pop();

	push();
	translate(mX, mY + 200);
	epi(0, 0);
	pop();

	push();
	translate(mX + 200, mY);
	epi(0, 0);
	pop();

	push();
	translate(mX - 200, mY + 200);
	epi(0, 0);
	pop();

	push();
	translate(mX + 200, mY + 200);
	epi(0, 0);
	pop();
}

function epi(x, y) {
	var a = map(mouseX, 0, 400, 0, 50);
	var b = map(mouseY, 0, 400, 10, 90);
	R = mouseX
	G = mouseY + 50
	B = mouseY

    stroke(R, G, B);
    noFill();
    beginShape();
    for (let i = 0; i < nPoints; i++) {
        var theta = map(i, 0, 100, 0, TWO_PI);
        var x = (a + b) * cos(theta) - b*cos(((a + b) / b) * theta);
        var y = (a + b) * sin(theta) - b*sin(((a + b) / b) * theta);
        vertex(x, y);
    }
    endShape();

}
A visual representation of what you might see when you rub your eyes with your fists.
LO – 07
Shaun Murray,
shaunmur – Section B
This week I read about the works of Stefanie Posavec (b. 1981). She is a designer, artist, and author writing algorithms to create art.
I am interested in her collaboration project with Greg McInerny ‘(En)tangled Word Bank.’
The project is an abstract representation of the six editions of Darwin’s ‘On the Origin of Species’ and the changes made throughout these editions.
The six editions are represented as six circles with different colors, blue and orange, used to show whether the edits made it into the final version.
The color coding is a metaphor for Darwin’s own survival of the fittest.
The project has a visually appealing style using data collected from Darwin’s many revisions to create each circle’s design.
The algorithm used incorporates this data and has lines and shapes spawn from each circle’s origin.
Posavec’s artistic style shines through this project through her use of algorithms to create colorful and repetitive deigns.
(En)tangled Word Bank (2009)
Fireworks
This program was inspired when I was playing around with altering the degree of the function, and noticing that it behaved like a flashing light. I applied this to the mouse, using the mouse to control how the function behaves, and also it’s size, to create “flashes”. I colored them, and they became fireworks. To add another interactive element, I wanted to make something that the user could “explode” themselves, so I added the TNT.
sketch
var nPoints = 100;      //used for loops and mapping
var q = 10;     //used for changing degree
var p = 0;      //used for changing size

function setup() {
    createCanvas(400, 400);
    background(0,0,0)
    frameRate(10);
}


function draw() {
    background(0);  //black
    noStroke();

rectMode(CENTER);
fill(255,0,0)   //red
    rect(width/2,height/2,30,50)    //TNT block
fill(255)
    rect(width/2,height/2,30,20)
fill(0)
    text('TNT',width/2-12,height/2+5)

if(mouseIsPressed){
   if(mouseX<(width/2)+15 & mouseX>(width/2)-15 && mouseY<(height/2)+25 && mouseY>(height/2)-25)   //if mouse is inside TNT
        p=p+5       //increse size of explosion curve
    }else{
        p=0     //hide explosion curve
}

push();
translate(mouseX,mouseY-20)
    drawQuad7Curve();       //dynamite fuse
        q=q+1       //change degree of curve
            if(q>60){
                  q=10    //reset degree of curve after 60 changes
}
pop();

push();
    fill(255,0,0);  //red
        rect(mouseX,mouseY,10,20);  //TNT block
pop();

push()
if(mouseX>25 & mouseX<75){
     translate(20,50);
       drawQuadCurve();     //green firework
   }
if(mouseX<25){
    fill(0,255,0);      //green
       rect(20,height-mouseX*12,2,20)   //green firework starter
}
pop();

push();
 if(mouseX>50 & mouseX<100){
     translate(100,100);
         drawQuad2Curve();      //red firework
}
pop();

push();
if(mouseX>10 & mouseX<60){
    fill(255,0,0)       //red
        rect(100,height-mouseX*4.5,2,20);    //red firework starter
}
pop();

push();
if(mouseX>100 & mouseX<150){
    translate(200,300);
        drawQuad3Curve();       //blue firework
}
pop();

push();
if(mouseX>60 & mouseX<110){
    fill(0,0,255);  //blue
        rect(200,height-mouseX/2,2,20);     //blue firework starter
}
pop();

push();
if(mouseX>150 & mouseX<200){
push();
    translate(300,200);
        drawQuad4Curve();   //yellow firework
}
pop();

push();
 if(mouseX>100 & mouseX<150){
    fill(255,255,0);    //yellow
        rect(300,height-mouseX,2,20);       //yellow firework starter
}
pop();

push();
 if(mouseY>200 & mouseY<250){
    translate(350,100)
        drawQuad8Curve()        //purple firework
 }
pop();

push();
 if(mouseY>100 & mouseY<200){
    translate(150,50)
        drawQuad9Curve()        //light blue firework
 }
pop();

push();
    translate(200,200)
        drawQuad5Curve();       //orange explosion curve
        drawQuad6Curve();       //white explosion curve

 pop();


//--------------------------------------------------
function drawQuadCurve() {

var x;
var y;
var r;


    var a = map(mouseX,0,50,0,width/5);     //size determined by mouseX within a mapped range
    var n = constrain(mouseX, 0, height/2);     //degree of curve determined by a constrained mouseX


    fill(0,255,0);      //green
    beginShape();
    for (var i = 0; i < nPoints; i++) {
        var t = map(i, 0, nPoints, 0, TWO_PI);      //determine angle by mapping

        r =  a * sin(n*t)   //radius

        x = r * cos(t);     //x of function
        y = r * sin(t);     //y of function
        vertex(x, y);       //plot function

    }
    endShape(CLOSE);        //close object to fill


}

function drawQuad2Curve(){

var x;
var y;
var r;


    var a = map(mouseX,50,100,0,width/9)
    var n = constrain(mouseY/2, 0, height);


    fill(255,0,0)
    beginShape();
    for (var i = 0; i < nPoints; i++) {
        var t = map(i, 0, nPoints, 0, PI*5);

        r =  a * sin(n*t)

        x = r * cos(t);
        y = r * sin(t);
        vertex(x, y);
    }
    endShape(CLOSE);


}

function drawQuad3Curve(){

var x;
var y;
var r;


    var a = map(mouseX,100,150,0,width/7)
    var n = constrain(mouseX, 0, height-mouseY);


    fill(0,0,255);
    beginShape();
    for (var i = 0; i < nPoints; i++) {
        var t = map(i, 0, nPoints, 0, PI*3);

        r =  a * sin(n*t)
        x = r * cos(t);
        y = r * sin(t);
        vertex(x, y);
    }
    endShape(CLOSE);

}

function drawQuad4Curve(){

var x;
var y;
var r;


    var a = map(mouseX,150,200,0,width/5)
    var n = constrain(mouseX, 0, mouseY);


    fill(255,255,0);
    beginShape();
    for (var i = 0; i < nPoints; i++) {
        var t = map(i, 0, nPoints, 0, TWO_PI);

        r =  a * sin(n*t)
        x = r * cos(t);
        y = r * sin(t);
        vertex(x, y);
    }
    endShape(CLOSE);


}

function drawQuad5Curve(){

var x;
var y;
var r;


    var a = p*20
    var n = 60;


    fill(247,181,67);
    beginShape();
    for (var i = 0; i < nPoints; i++) {
        var t = map(i, 0, nPoints, 0, TWO_PI);

        r =  a * sin(n*t)

        x = r * cos(t);
        y = r * sin(t);
        vertex(x, y);
    }
    endShape(CLOSE);

}

function drawQuad6Curve(){

var x;
var y;
var r;


    var a = p*5;
    var n = 30;


    fill(255);
    beginShape();
    for (var i = 0; i < nPoints; i++) {
        var t = map(i, 0, nPoints, 0, TWO_PI);

        r =  a * sin(n*t)

        x = r * cos(t);
        y = r * sin(t);
        vertex(x, y);
    }
    endShape(CLOSE);

}

function drawQuad7Curve(){

var x;
var y;
var r;


    var a = 10
    var n = constrain(q, 0, height);        //degree based on the changingvariable q


    fill(255,255,0);
    beginShape();
    for (var i = 0; i < nPoints; i++) {
        var t = map(i, 0, nPoints, 0, TWO_PI);

        r =  a * sin(n*t)

        x = r * cos(t);
        y = r * sin(t);
        vertex(x, y);
    }
    endShape(CLOSE);

}

}
function drawQuad8Curve(){

var x;
var y;
var r;


    var a = mouseX/10
    var n = constrain(q, 0, height);

    fill(182,68,249);
    beginShape();
    for (var i = 0; i < nPoints; i++) {
        var t = map(i, 0, nPoints, 0, TWO_PI);

        r =  a * sin(n*t)

        x = r * cos(t);
        y = r * sin(t);
        vertex(x, y);
    }
    endShape(CLOSE);

}

function drawQuad9Curve(){

var x;
var y;
var r;


    var a = map(mouseY,100,200,0,height/20)
    var n = constrain(q*2, 0, height);


    fill(68,237,249);
    beginShape();
    for (var i = 0; i < nPoints; i++) {
        var t = map(i, 0, nPoints, 0, PI);

        r =  a * sin(n*t)

        x = r * cos(t);
        y = r * sin(t);
        vertex(x, y);
    }
    endShape(CLOSE);

}
Project-07
Heying Wang
heyingw@andrew.cmu.edu
var nPoints=100;
function setup() {
    createCanvas(480, 480);
    background(220);
    frameRate(5);

}

function draw() {
    var x;
    var y;

    //constrain mouseX and mouseY
    constrain(mouseX,0,width);
    constrain(mouseX,0,height);

    //limite the size of the astroid with map method
    //sets up a constantly chaging background
    var a = map(mouseX,0,width,20,100);
    var b=  map(mouseY,0,height,20,100);

    background(100+a,150-b,100+b-a);
    for(i=0;i<=200;i++){
        fill('yellow');
        circle(random(width),random(height),1,1)
    }


    //draw one large astroid at the center
    fill(a,b,50);
    translate(width/2+random(-2,2),height/2+random(-2,2));
    astroid(a,b);

    fill(random(250),random(250),random(250));
    heart(a);

    push();
    //the one on the bottom right
    translate(width/4+random(-2,2),height/4+random(-2,2));
    rotate(radians(mouseX));
    fill(a,b,160);
    astroid(a,b);

    fill(random(250),random(250),random(250));
    heart(a);

    //the one on the top left
    pop();
    push();
    translate(-width/4+random(-2,2),-height/4)+random(-2,2);
    rotate(radians(mouseX));
    fill(a,b,160);
    astroid(a,b);

    fill(random(250),random(250),random(250));
    heart(a);
    //the one on the top right
    pop();
    pop();
    push();
    translate(width/4+random(-2,2),-height/4)+random(-2,2);
    rotate(radians(mouseX));
    fill(a,b,160);
    astroid(a,b);
    fill(random(250),random(250),random(250));
    heart(a);

    //the one on the bottom left
    pop();
    pop();
    translate(-width/4+random(-2,2),height/4)+random(-2,2);
    rotate(radians(mouseX));
    fill(a,b,160);
    astroid(a,b);
    fill(random(250),random(250),random(250));
    heart(a);


}

//draw astroid and the lines
function astroid(a,b){
    beginShape();
    for (var i = 0; i < nPoints; i++) {
        var t = map(i, 0, nPoints, 0, TWO_PI);
        x = a*pow(cos(t),3);
        y = b*pow(sin(t),3);
        vertex(x, y);
    }
    endShape(CLOSE);
    for (var i = 0; i < nPoints; i++) {
        var t = map(i, 0, nPoints, 0, TWO_PI);
        x = a*pow(cos(t),3);
        y = b*pow(sin(t),3);
        strokeWeight(0.2);
        stroke('wight');
        line(x,y,0,0);
    }

}
//draw heart
function heart(a){
    k=map(a,0,100,0.5,1.2);
    beginShape();
    for (var i = 0; i < nPoints; i++) {
        var t = map(i, 0, nPoints, 0, TWO_PI);
        x =k*16*pow(sin(t),3);
        y = k*13/16*13*cos(t)-5*cos(2*t)-2*cos(3*t)-cos(4*t);
        vertex(x, y);
    }
    endShape(CLOSE);
}
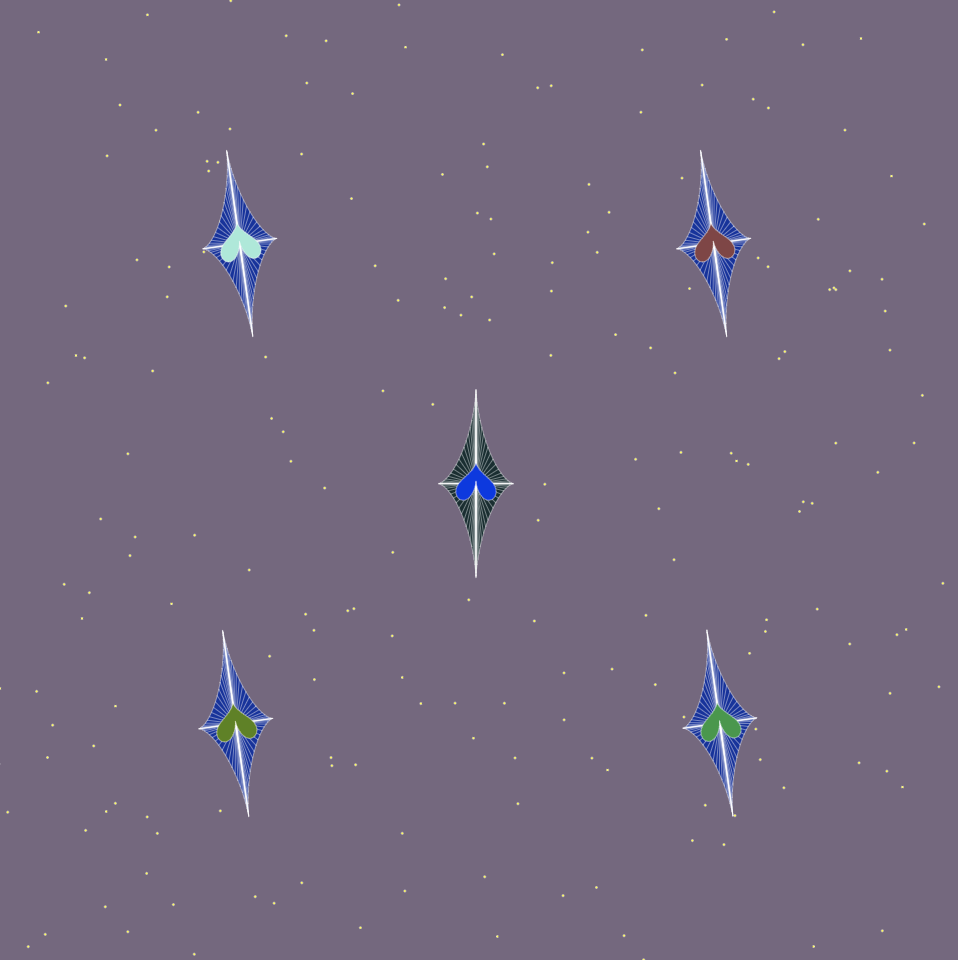
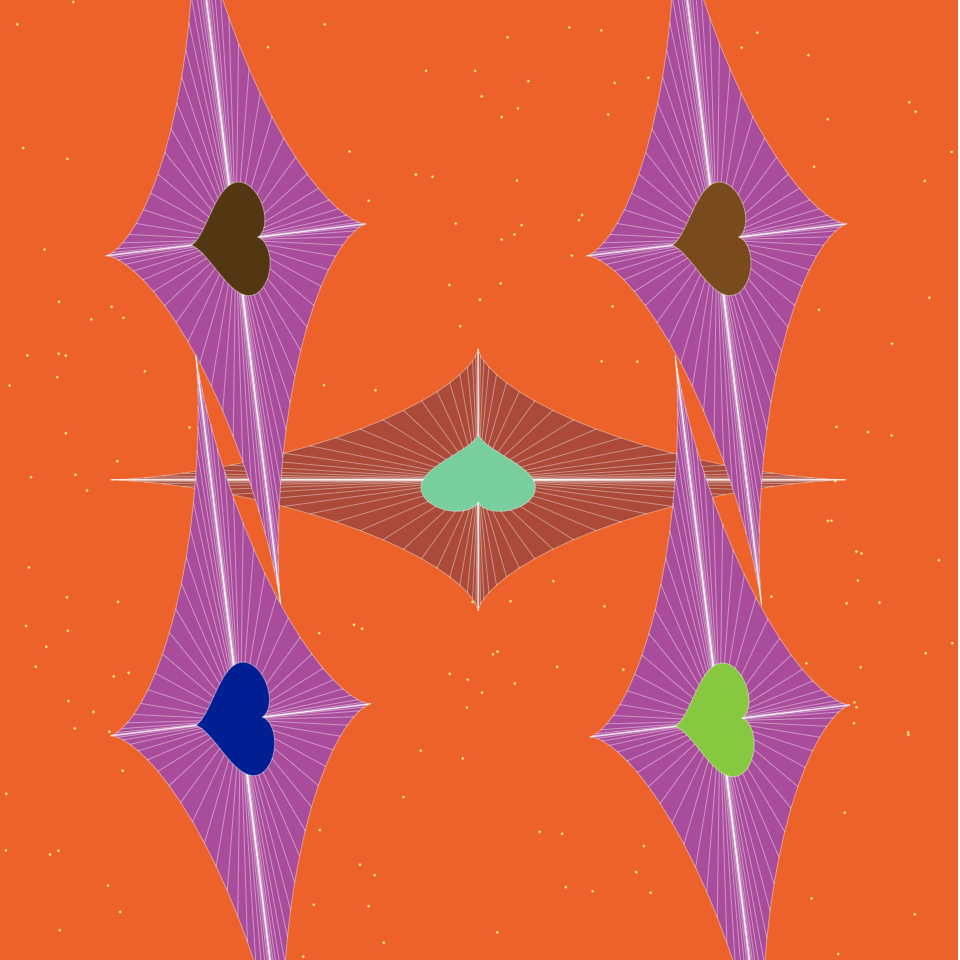
I made this constantly changing pattern with hearts curve and astroid curve. The background color corresponds to the position of mouse x and mouse y.
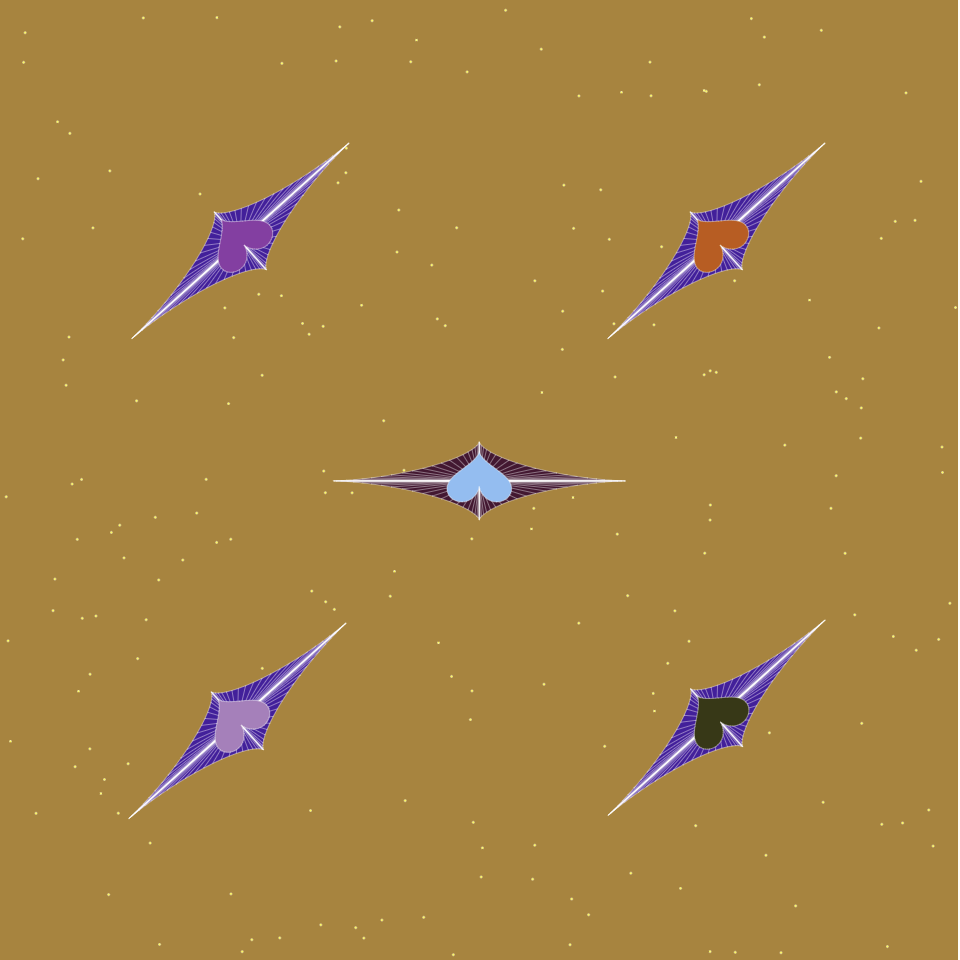
The size of the astroid curve and the heart curve also depends on where the user places he mouse. They can become as narrow as a pointer or as wide as a square. They will also be rotating around the center as the mouse move clockwise or anti-clockwise.
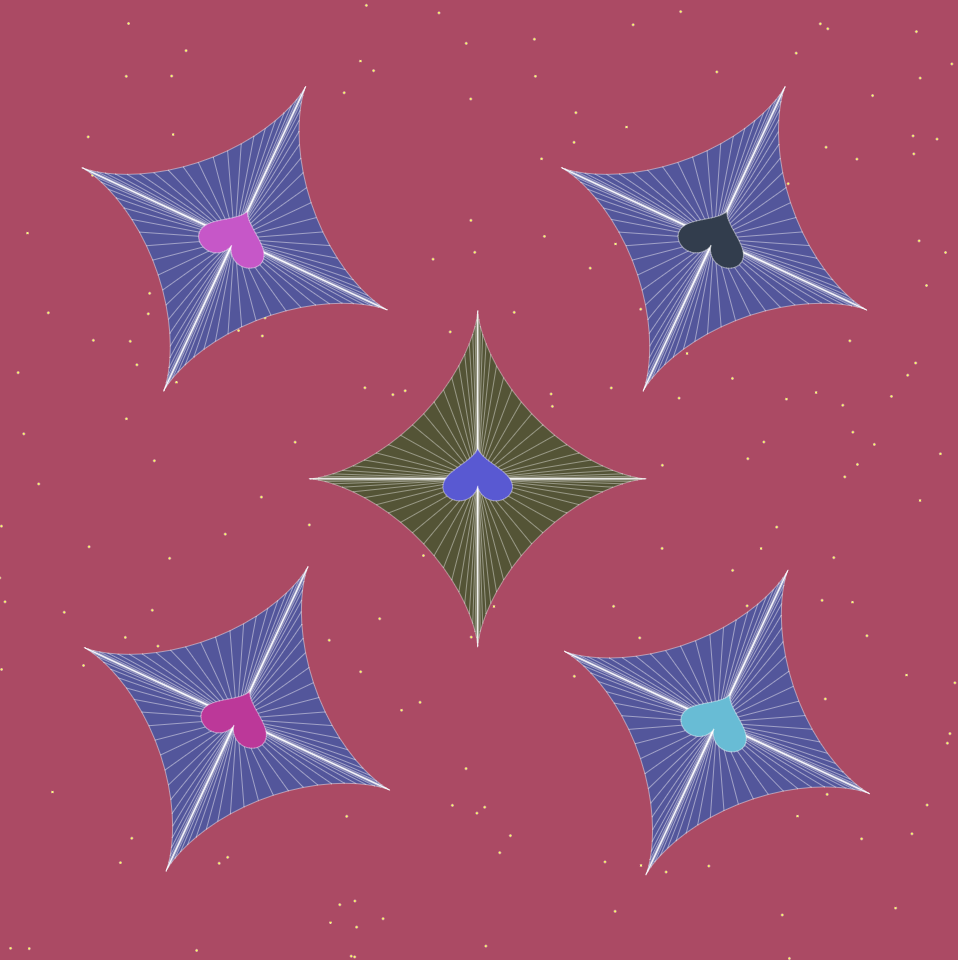
Thus, the user can interact with the page by moving their mouse around to create their unique, desired pattern.
LookingOutwards-07
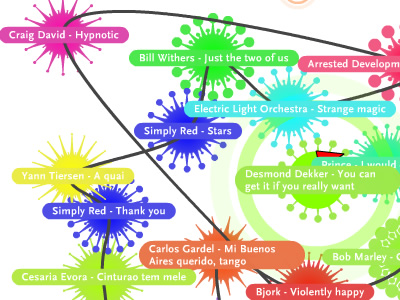
Designed by Frederic Vavrille, Musicovery is an interactive music service program that personalize music recommendations to various types of listeners by algorithms.
Listeners can start by choosing a mood or a radio as the initial metrics. Then the sound navigate the listeners to navigate between different artists.
Many music service engines are only based on collaborative filtering and user’s context, facing problem such as creating clones of playlist with very few artists, repetitively shuffling highly popular songs and cold start issues. To allow listeners to wander strategically out of their song/artist preferences, Musicovery optimize the system with more customized metrics to measure diversity. By concentrating less on the tops of the playlist, increasing higher variety and disparity, the service provides not only users based playlist but also context based playlist with more different navigations on genre. It also measures metrics including skips to analyze listeners’ level of engagement to each music. This increase the accuracy of the listeners’ preferences significantly.
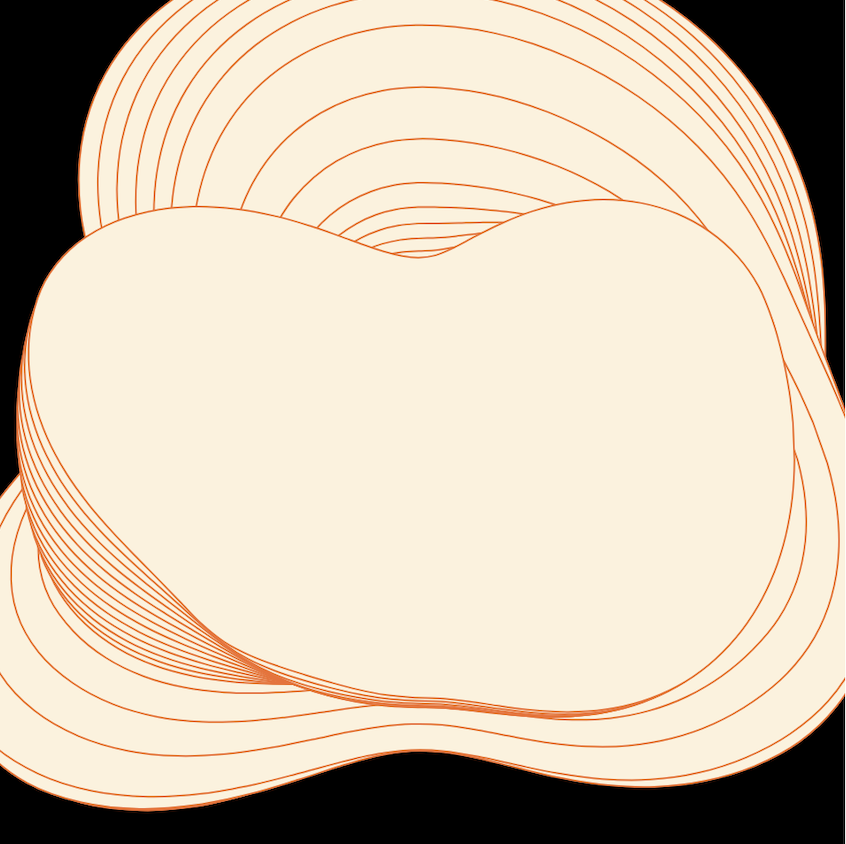
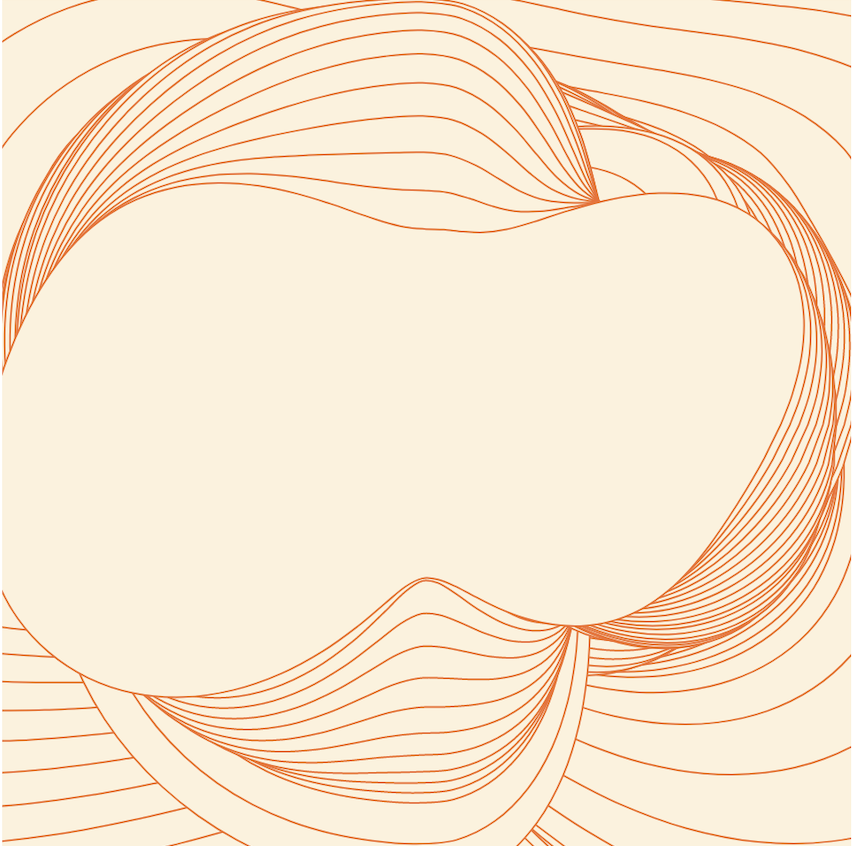
Project-07-Curves
The project is based on the idea of using movement to capture the growing motion of a natural organism such as a sea creature or a human body part. Each of the new shape are overlap over the previous shape which show a processional motif on the canvas. I also add noise value into the function to allow the curves to offset and performing in a flowing state.
sketchDownload
//Isabel Xu
//yuexu@andrew.cmu.edu
//Section A
//Project-07
var yoff = 0;
var max_radius = 100;
var angle_incr = 0.1;
var max_noise = 100;

function setup() {
    createCanvas(480, 480);
    background(0);
    frameRate(20);

}

function draw() {
	let max_radius = dist(mouseX,mouseY,width/2,height/2);
	let max_noise = max_radius;

	noiseDetail(1, 0.8);
	fill(253,242,220);
	translate(width/2, height/2);

	for (let radius = 0; radius < max_radius; radius += 1){
		beginShape();
		stroke(244,109,41);
		for (let a = 0; a < TWO_PI; a += angle_incr){
			//Use mouseX and mouseY to define offset value
			let xoff = cos(a) + 1;
			let offset = map(noise(xoff, sin(a) + 1 + yoff), 0 , 1,-max_noise, max_noise);


			let r = radius + (offset * map(radius,0,max_radius, 0.1, 1));
			let x = r * cos(a);
			let y = r * sin(a);


			curveVertex(x,y);
	}


	}
	endShape(CLOSE);

	yoff += 0.06

}