Project 7 – Compositions with Curves

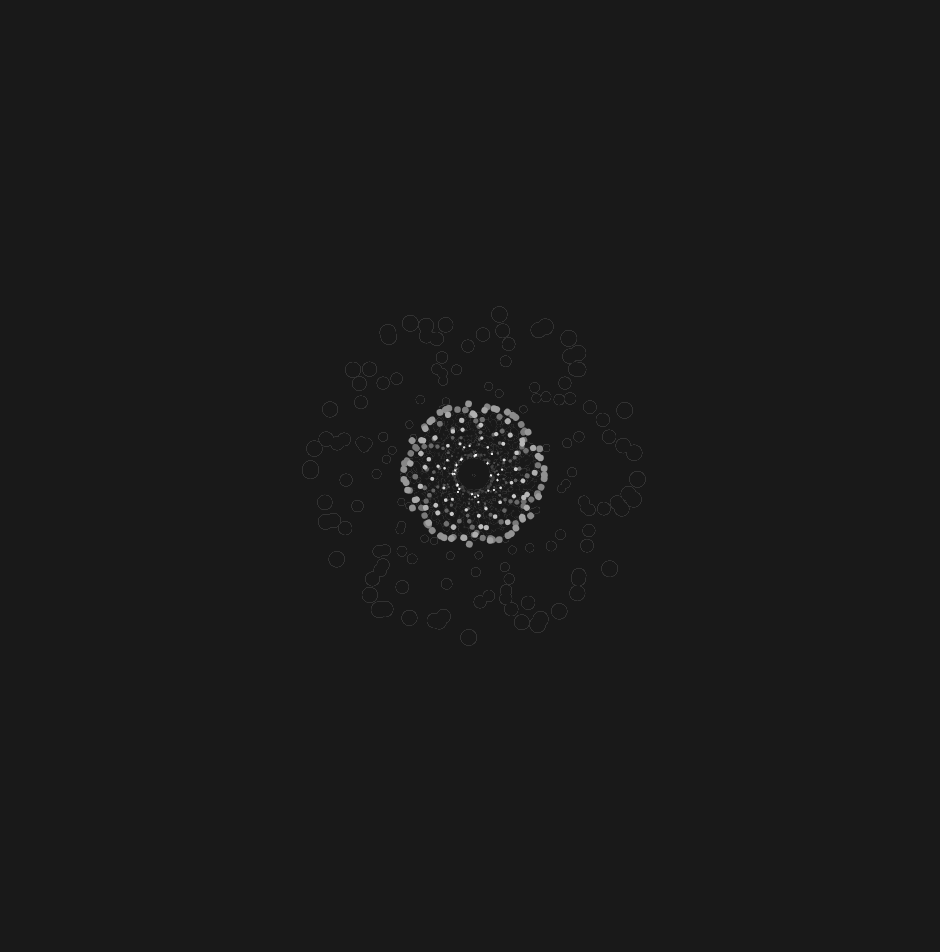
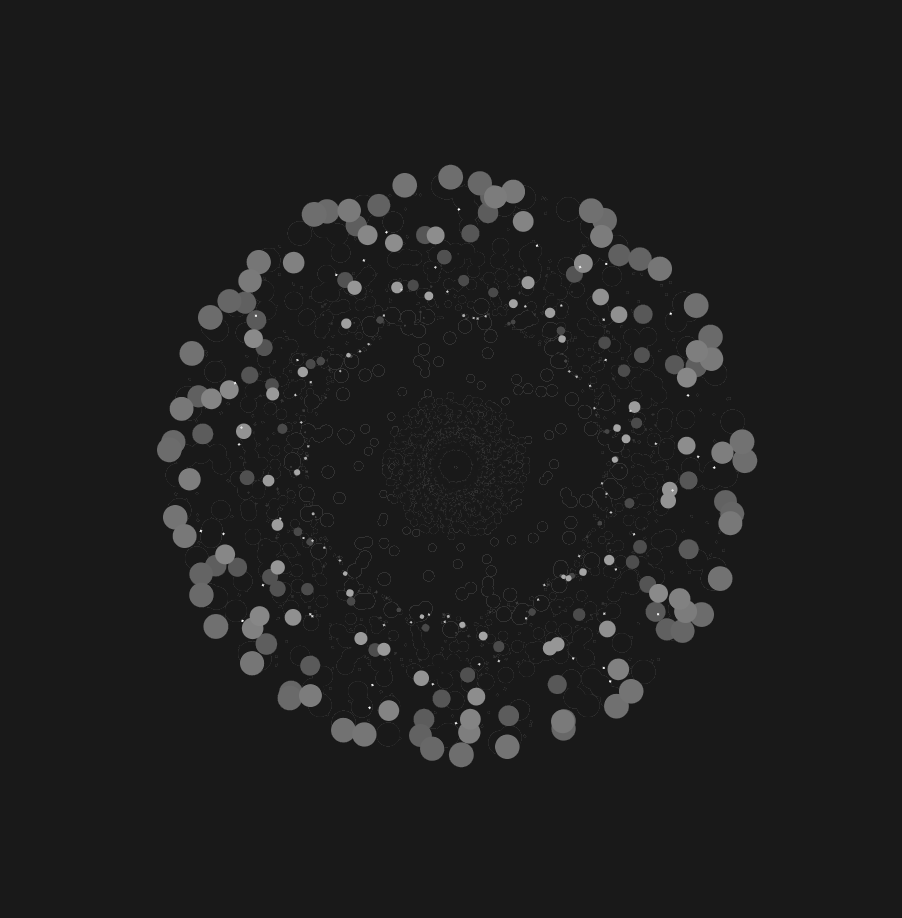
For this project, I was inspired by an abstract interpretation of the human eye and wanted to include aspects of that into my project. It was sort of difficult getting my initial equation to work, but after adjusting it to cos/sin it worked a lot better. It also took me a long time to find ways of simplifying my code, since I wanted to work on keeping my code as concise as I can when possible, and to try to find the easiest way to create what I had in mind without extra steps.

sketch
//iris yip
//15-104 section D
//project 7

function setup() {
    createCanvas(480, 480); //canvas size
}

function draw() {
    background(0,5) //background opacity
    stroke(255)
    translate(240, 240); //position of interactive circle
    x = cos(frameCount / 30) * (4 * mouseX / 40 * (sin(frameCount / 30)) * 2 - frameCount / 30) //equation
    y = mouseY / 10; //Y position of mouse
    strokeWeight(x / 10)
    rotate(frameCount + x / 100); //action and framerate
  
  //coordinates (movement)
    point(x, y);
    point(y, x);
    point(-x, y);
    point(-y, -x);
}

Project – 07

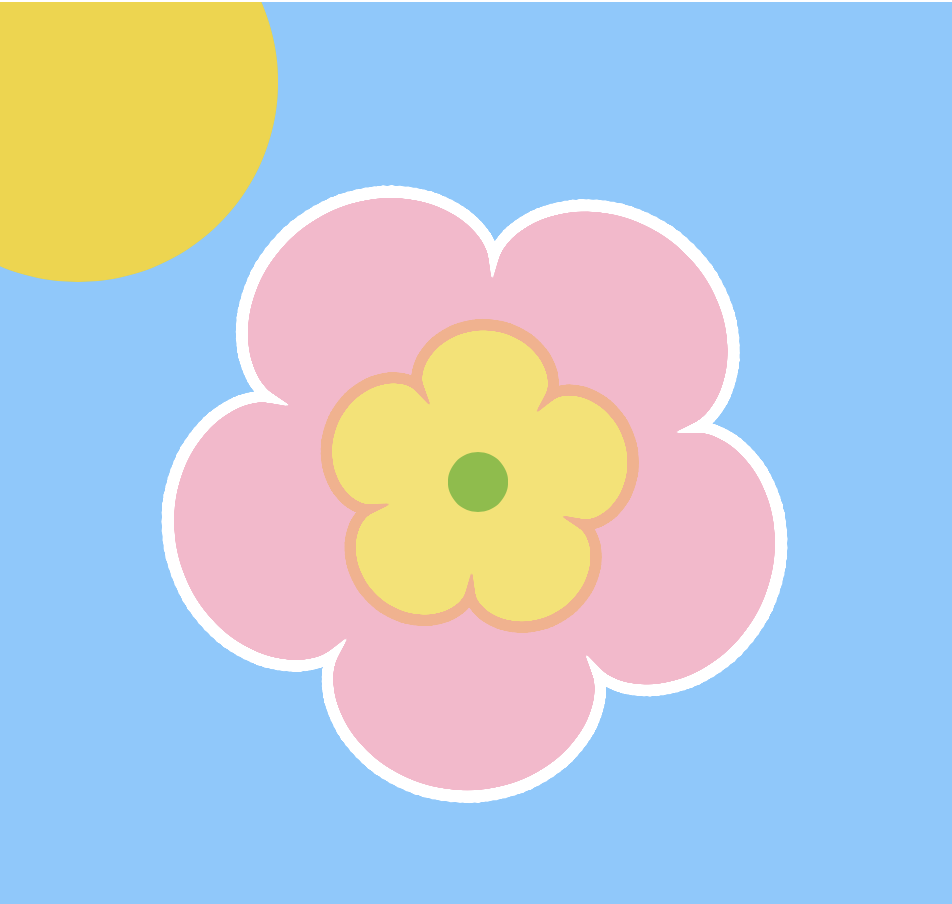
I chose to use the Ranunculoid Curve to create my project. When making it I noticed that the curve looks like a star when small with a larger stroke weight, so I set up my project to switch from day and night to see a star turn into a flower created by ranunculoid curves.

shapesDownload
var n = 50 //number of cusps
var angleRan1 = 0 //rotation of pink flower
var angleRan2 = 0 //rotation of yellow flower

function setup() {
    createCanvas(480, 480);
    background(220);
    frameRate(20);
}

function draw() {
	background(31, 45, 97); // night sky
	translate(width/2, height/2);
	//moon
	push();
    noStroke();
    fill(255);
    circle(-100, -150, 100);
    fill(31, 45, 97);
    circle(-75, -150, 100);
    pop(); 
	stroke(255);
	strokeWeight(5);
	push(); // rotate ranunculoid
	rotate(radians(angleRan1));
    angleRan1 += mouseY;
	drawRanun1();
	pop();
	push();
	rotate(radians(angleRan2));
	angleRan2 += mouseY + 90
	drawRanun2();
	pop();
	if (mouseX >= 100) {
		noStroke();
		fill(129, 191, 54);
		circle(0, 0, 30);
		//sun
		fill(240, 213, 36);
		circle(-200, -200, 200)
	}
}

//Ranunculoid Curve
function drawRanun1 () {
    //x = a[6cost-cos(6t)] y=a[6sint - sin (6t)] <- parametric equations
    var aRan1 = mouseX/50
    if (aRan1 <= 2) {
    	fill(251, 252, 182); //yellow when it is a star shape
    }else {
    	background(130, 201, 255); // day time
    	fill(252, 182, 203); //pink when its a flower shape
    }
    //curve
    beginShape();
    for(var i = 0; i < n; i += 0.1){
    	var xRan1 = aRan1 * (6 * cos(i) - cos(6 * i));
    	var yRan1 = aRan1 * (6 * sin(i) - sin(6 * i));
    	vertex(xRan1, yRan1);
    }
    endShape();
}
//inner flower
function drawRanun2 () {
	strokeWeight(5);
	fill(245, 226, 100);
	var aRan2 = mouseX/100
	if (aRan2 < 2) {
		stroke(255);
	} else {
		stroke(250, 175, 137);
	}
	//curve
	beginShape();
	for(var i = 0; i < n; i += 0.1) {
		var xRan2 = aRan2 * (6 * cos(i) - cos(6 * i));
    	var yRan2 = aRan2 * (6 * sin(i) - sin(6 * i));
    	vertex(xRan2, yRan2);
	}
	endShape();
}

Project 07: Curves

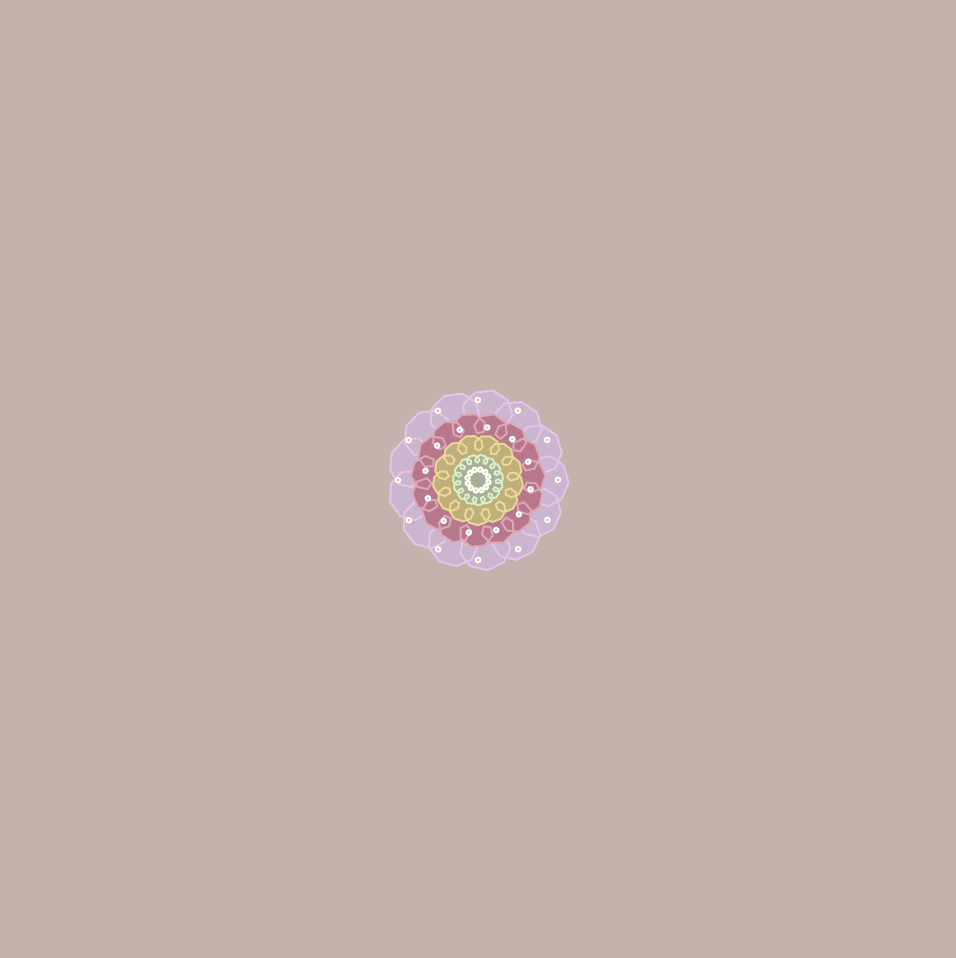
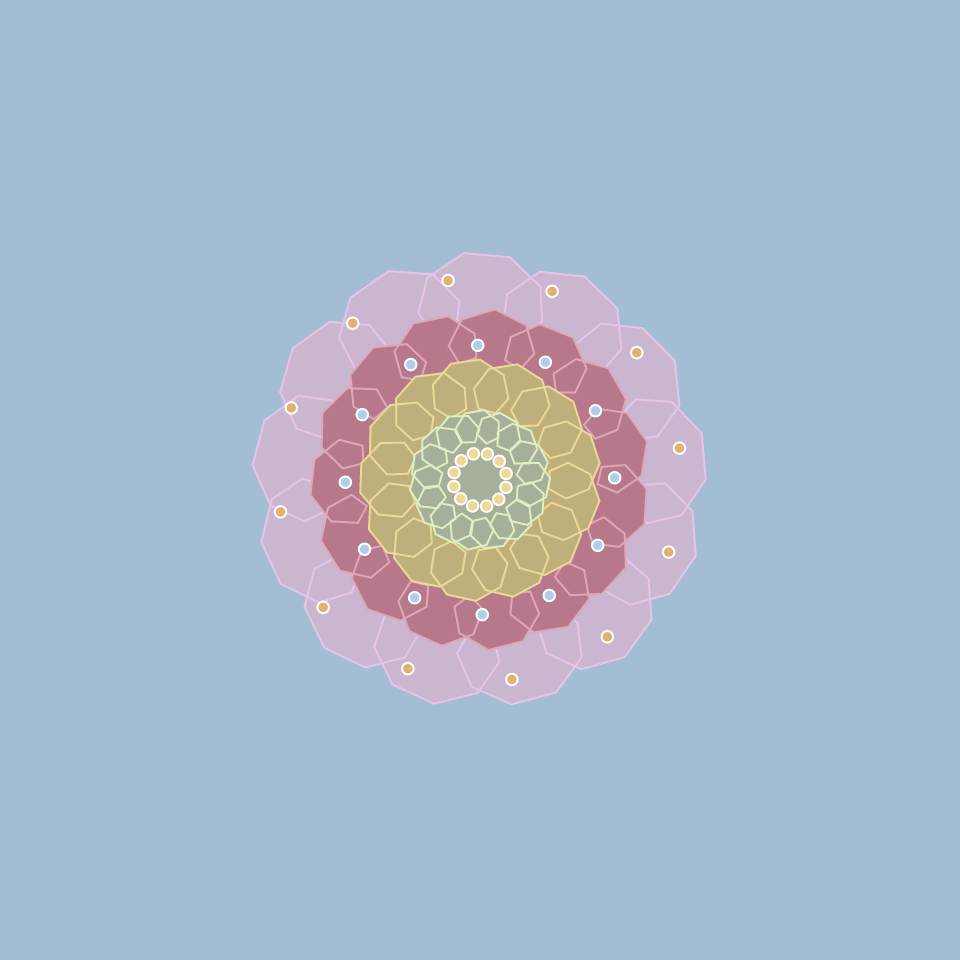
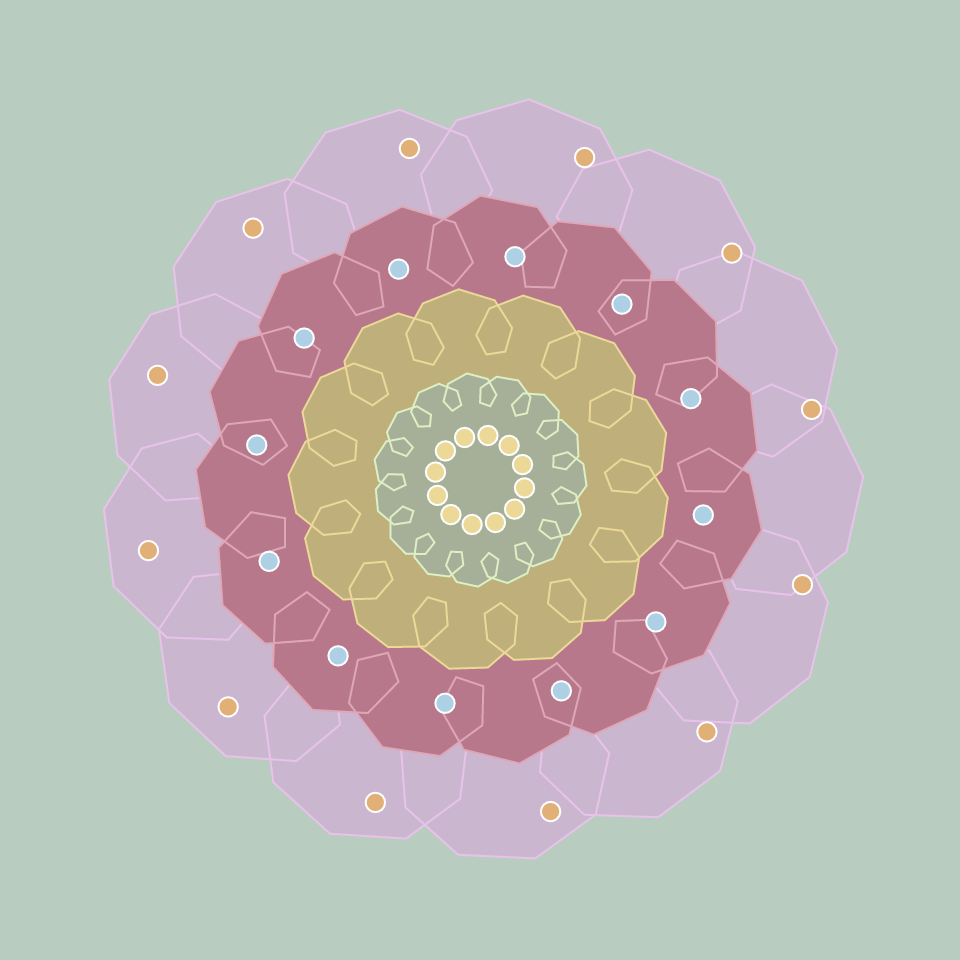
When looking through the curves, I thought it would be perfect to use them and create a flower with multiple layers. I decided to use the hypotrochoid and the epitrochoid curves with pastel-ish colors. As you move across x and y, the flower should grow in size relative to where mouseX and mouseY are. The background color also changes relative to the x and y positions of the mouse.

sketch
//Jessie Chen
//jessiech@andrew.cmu.edu
//D
//Project 07
//Curves

var nPoints = 100;
var angle = 0;
var radius = 200;
var r = 200;
var g = 170;
var b = 170;

function setup() {
    createCanvas(480, 480);
    frameRate(20);
}

function draw() {

    var xcolorchange = map(mouseX, 0, width, 0, 50);
    var ycolorchange = map(mouseY, 0, height, 0, 50);

    //slight change in the background as mouse moves across x and y
    background(r - ycolorchange, g + xcolorchange, b + ycolorchange);

    //origin at the center of the canvas
    translate(width/2, height/2);
    
    //purple layer of petals
    push(radians(angle));
    rotate(radians(-angle))
    angle += mouseX;
    stroke(240, 192, 236);
    //fill(152, 115, 148);
    fill(207, 181, 210)
    hypotrochoid(mouseX/2);
    pop()

    //pink layer of petals
    push();
    rotate(radians(angle));
    angle += mouseY;
    stroke(232, 164, 184);
    fill(193, 116, 139);
    epitrochoid(mouseX/3);
    pop(); 

    //yellow layer of petals
    push();
    rotate(radians(angle));
    angle += mouseX;
    stroke(239, 216, 142);
    fill(193, 175, 116);
    hypotrochoid(mouseX/4);
    pop();

    //green layer of petals
    push();
    rotate(radians(angle));
    angle += mouseY;
    stroke(216, 240, 192);
    fill(164, 176, 148);
    epitrochoid(mouseX/8);
    pop();

    //orange circles
    push();
    rotate(radians(angle));
    angle += mouseX;
    radius = mouseX/3;
    fill(164, 209, 232);
    circles(radius);
    pop();

    //blue circles
    push();
    rotate(radians(angle));
    angle += mouseY;
    radius = mouseX/2;
    fill (233, 175, 109);
    circles(radius);
    pop();

    //yellow circles
    push();
    rotate(radians(angle));
    angle += mouseX;
    radius = mouseX/15;
    fill(239, 216, 142);
    circles(radius);
    pop();
}


function epitrochoid(size) {
    var x;
    var y;
    var a = size;
    var b = a/15;
    var h = constrain(mouseY/30, a/5, b*5);

    beginShape();
    for(var i = 0; i<nPoints; i++) {
        var t = map(i, 0, nPoints, 0, TWO_PI);
        x = (a + b) * cos(t) + h * cos(((a + b) / b) * t);
        y = (a + b) * sin(t) + h * sin (((a + b) / b) * t);
        vertex(x, y);
    }
    endShape(CLOSE);
}

function hypotrochoid(size) {
    var x;
    var y;
    var a = size;
    var b = a/15;
    var h = constrain(mouseY/30, a/5, b*10);
    var ph = mouseX/60;

    beginShape();
    for (var i = 0; i < nPoints; i++) {
        var t = map(i, 0, nPoints, 0, TWO_PI);
        x = (a - b) * cos(t) + h * cos(((a - b) / b) * t);
        y = (a - b) * sin(t) + h * sin (((a - b) / b) * t);
        vertex(x, y);
    }
    endShape(CLOSE);
}

//array of circles
function circles(radius) {
    for (t = 0; t < 360; t = t + 30) {
        var x = radius * cos(radians(t));
        var y = radius * sin(radians(t));
        stroke(255);
        ellipse(x, y, mouseX/35, mouseX/35);
    }
}

Project 7 Curves

sketch

var numpoints = 200;

function setup() {
    createCanvas(400, 400);
    frameRate(10);
    noStroke();
}


function draw() {
    background(14,0,54);
    noFill();

    for (i = 1; i < 4; i+=2) { //two left deltoids
    strokeWeight(0.3);
    stroke(201,255,175);
    push();
    translate(width/4,height*i/4);
    deltoid();
    pop();
    }
 
    for (i = 1; i < 4; i+=2) { //two right deltoids
    strokeWeight(0.3);
    stroke(201,255,175);
    push();
    translate(width*3/4,height*i/4);
    deltoid();
    pop();
    }
    
    var c = color(255,202,map(mouseX,0,width,150,225)); // color change for the cornoid
    push();
    strokeWeight(1);
    stroke(c);
    translate(width/2,height/2);
    cornoid();
    pop();
}

function cornoid() {
  var x;
  var y;
  var a = map(mouseX,0,width,100,200); //a value changes according to mouseX, and mapping the value 
  
  beginShape();
  for (var i = 0; i < numpoints; i++ ) {
    var t = map(i, 0, numpoints, mouseY, 200); //theta changes according to the mouseY
    x = a*cos(t)*(1-2*sin(t)*sin(t));
    y = a*sin(t)*(1-2*cos(t)*cos(t));
    rotate(mouseY); //rotating according to mouseY
    vertex(x,y);
  }
  endShape();
}

function deltoid() {
  var x;
  var y;
  var a = map(mouseY,0,height,10,60); //a value changes according to mouseY, and mapping the value 
  
  beginShape();
  for (var i = 0; i < numpoints; i++ ) {
    var t = map(i, 0, numpoints, 0, mouseX); //theta changes according to the mouseX
    x = a/3*(2*cos(t)+cos(t*2));
    y = a/3*(2*sin(t)-sin(t*2));
    rotate(mouseY); //rotating according to mouseY
    vertex(x,y);
  }
  endShape(CLOSE);
}

Project 07-Curves

project07-curves
/*
Lauren Kenny
lkenny@andrew.cmu.edu
Section A

This program draws a grid of Epicycloids.
Functions for this shape where adapted from 
https://mathworld.wolfram.com/Epicycloid.html.

*/


//sets up the canvas size and initial background
function setup() {
    createCanvas(480, 480);
    background(220, 100, 100); 
}

//draws a grid of epicycloids
function draw() {
    translate(20, 20);
    background(0);
    strokeWeight(2);
    noFill();

    //color changes with mouse position
    //red and green change with y position
    //blue changes with x position
    var r=map(mouseY, 0, height, 80, 255);
    var g=map(mouseY, 0, height, 80, 120);
    var b=map(mouseX, 0, width, 80, 200);
    
    for (var row=0; row<width-20; row+=50) {
        push();
        for (var col=0; col<height-20; col+=50) {
            stroke(r, g, b);
            drawEpicycloid();
            translate(0, 50);
        }
        pop();
        translate(50, 0)
    }
}

//draws a singular epicycloid
function drawEpicycloid() {
    var minPetal=6;
    var maxPetal=10;
    var minSize=4;
    var maxSize=8;
    //number of petals increases as y position of mouse increases
    var numPetals = int(map(mouseY, 0, height, minPetal, maxPetal));
    //size of shape increases as x position of mouse increases
    var size = (map(mouseX, 0, width, minSize, maxSize))/(numPetals/2);

    beginShape();
    for (var i=0; i<100; i++) {
        var t = map(i, 0, 100, 0, TWO_PI);
        var x = (size * (numPetals*cos(t) - cos(numPetals*t)));
        var y = (size * (numPetals*sin(t) - sin(numPetals*t)));
        vertex(x, y);
    }

    endShape();
}

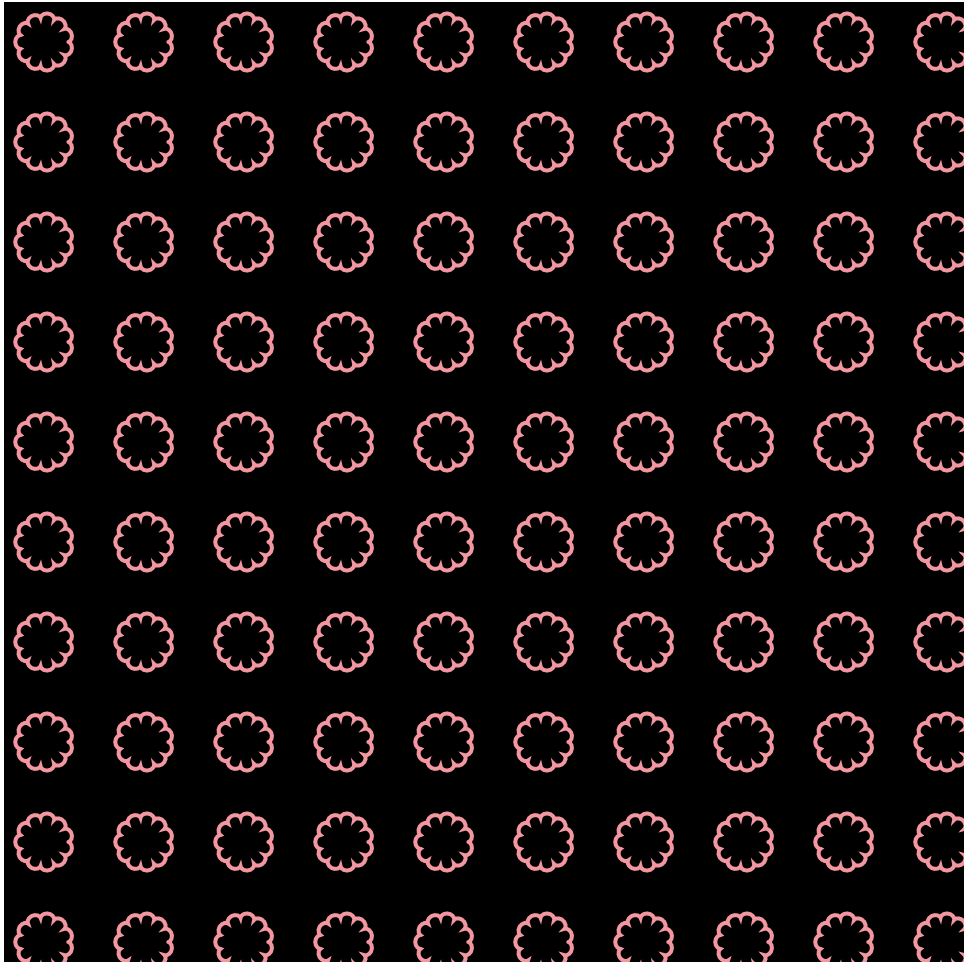
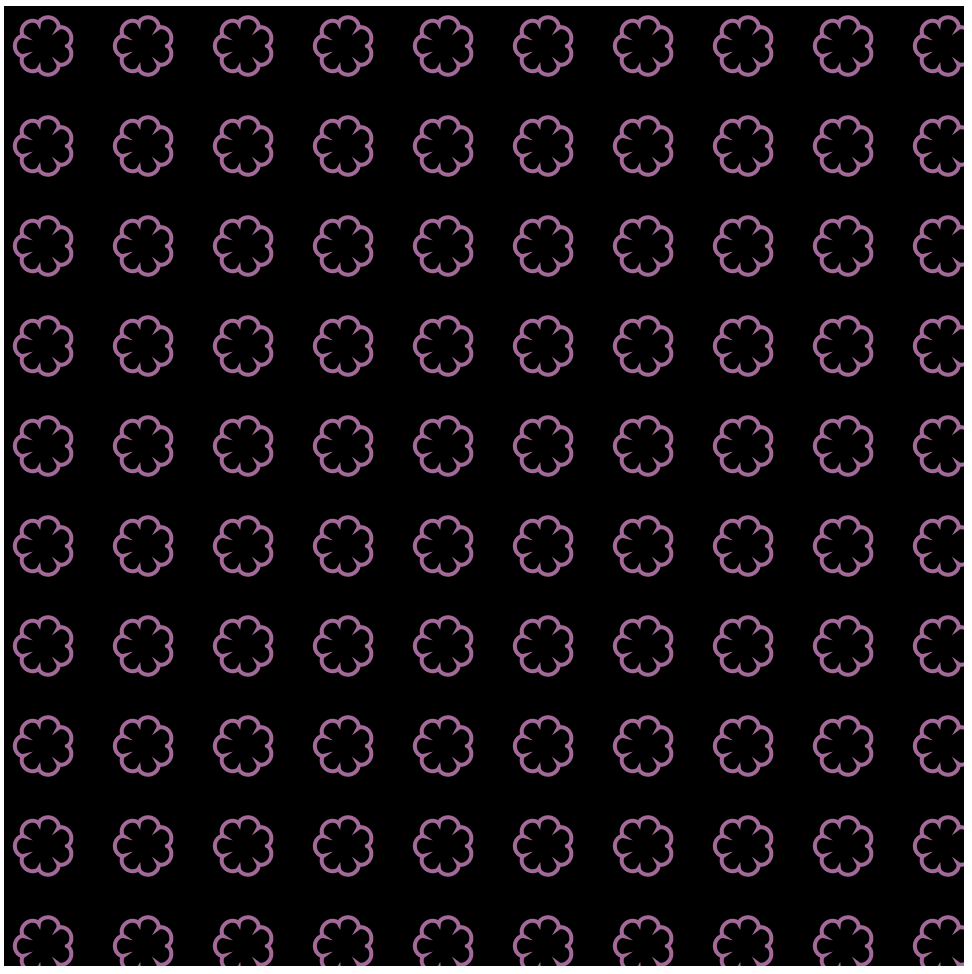
For this project I was really interested in the epicycloid because of the variation that could be added to the number of petals. In my program, I explored altering the number of petals in relation the mouse y position. I also added a variation in the size based on the mouse x position. It was fun to figure out through experimenting what each variable in the formula affected within the actual shape. Here are some screen shots with different mouse positions.

Project-07: Artistic Curves

I really wanted to create a psychedelic piece with curves. To do this, I made a rainbow effect of colors. The main aspect of the art was a hypotrochoid. This is made with a fixed circle and lines created by another circle rolling along the edge. The piece changes different mathematical aspects of the hypotrochoids based upon the position of the mouse. The curve is created with parametric equations based upon the radius of the fixed circle and the radius of the moving circle. These are the elements that are adjusted with the mouse. The loops created many hypotrochoids and in certain positions on the canvas, this can make very interesting designs.

sketchDownload
function setup() {
    createCanvas(480, 480);
    background(220);
    frameRate(20);
}

function draw() {
    background(0);
    //moves the shapes to the center of the canvas
    translate(width/2, height/2);
    for(var i = 0; i<20; i++){
        stroke(random(255), random(255), random(255)); //randomizes colors
        noFill();
        //creates loop of hypotrochoids based upon mouse position
        hypotrochoid(i*mouseX*.5, i*mouseY);
    }
}

//defines the shape hypotrochoid
//https://mathworld.wolfram.com/Hypotrochoid.html
function hypotrochoid(a, mouseY){
    var x; //used for parametric form
    var y; //used for parametric form

    var a; //radius of the fixed circle
    var b = a/10 //radius of the rolling ball
    var h = constrain(mouseY/10, 0, a) //var h depends on mouseY and restricted

    //defines the actual shape
    beginShape();
    for (var i = 0; i < 200; i++){
        var t = map(i, 0, 600, 0, 6*PI);
        x = (a-b)*cos(t)+h*cos(((a-b)/b)*t); //parametric equation for x
        y = (a-b)*sin(t)-h*sin(((a-b)/b)*t); //parametric equation for y
        vertex(x,y);
    }
    endShape(CLOSE);
}

Project 07 Curves

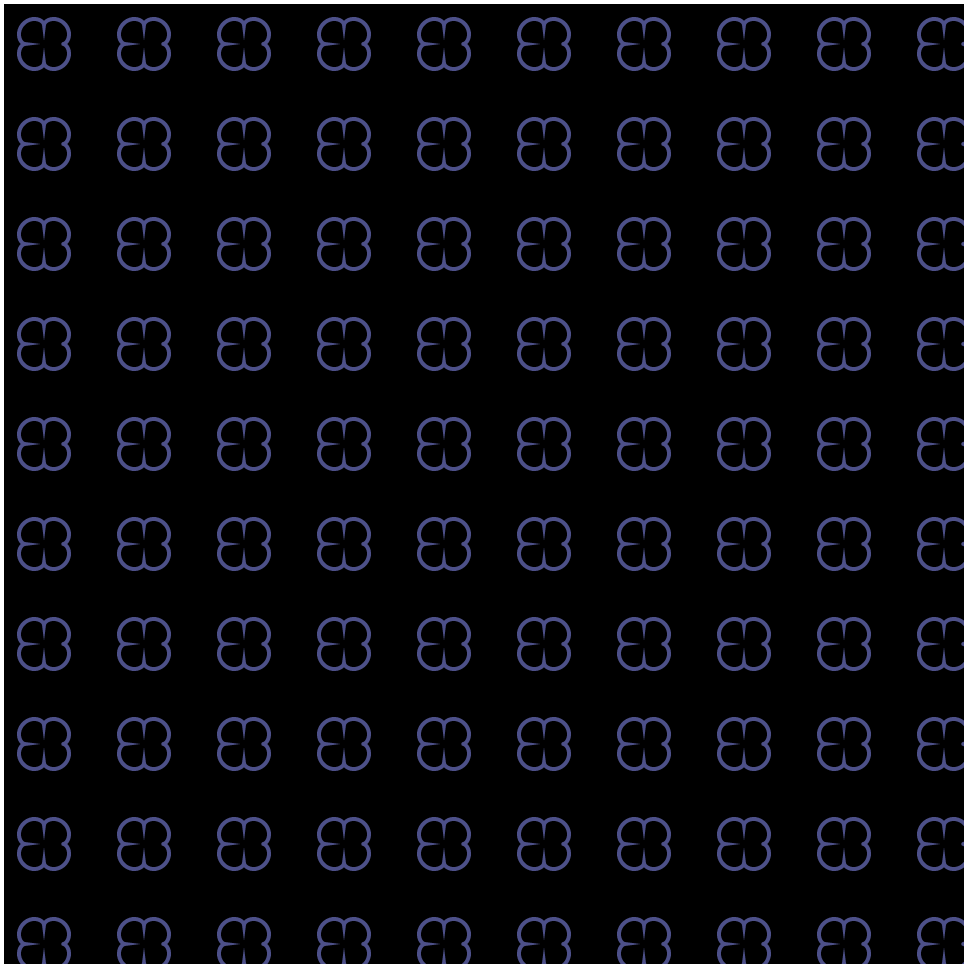
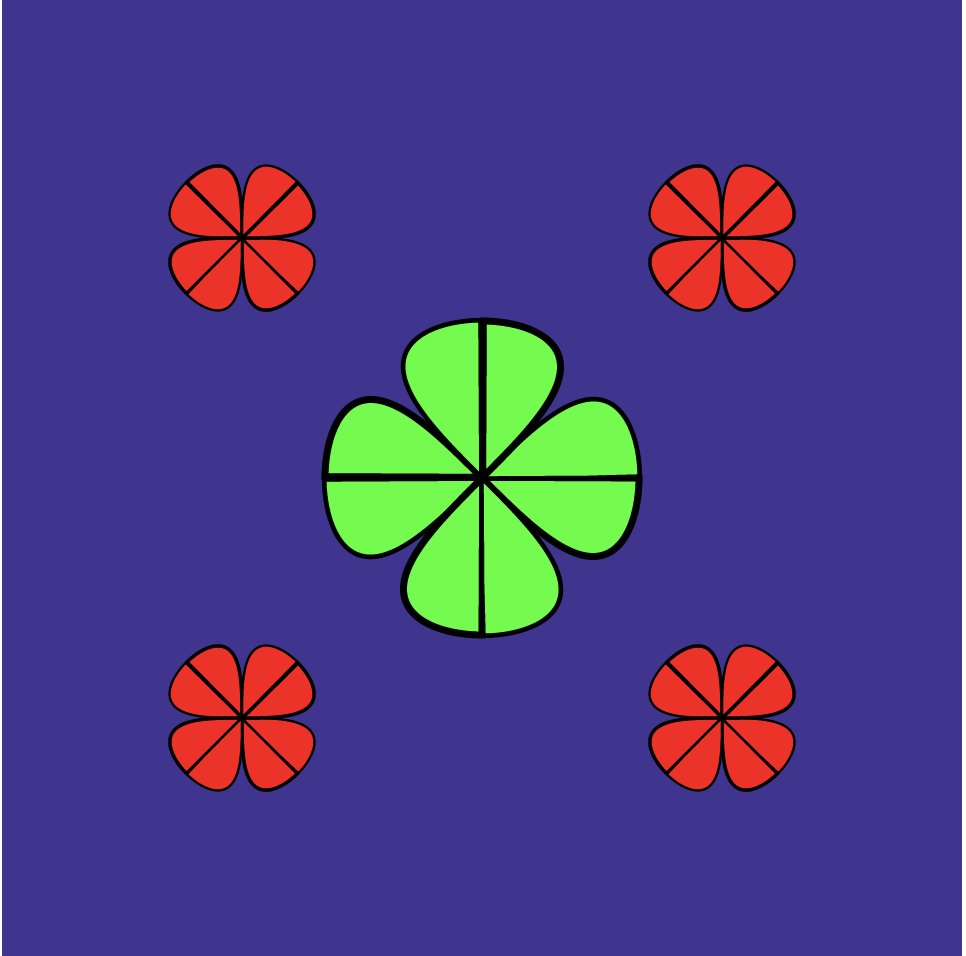
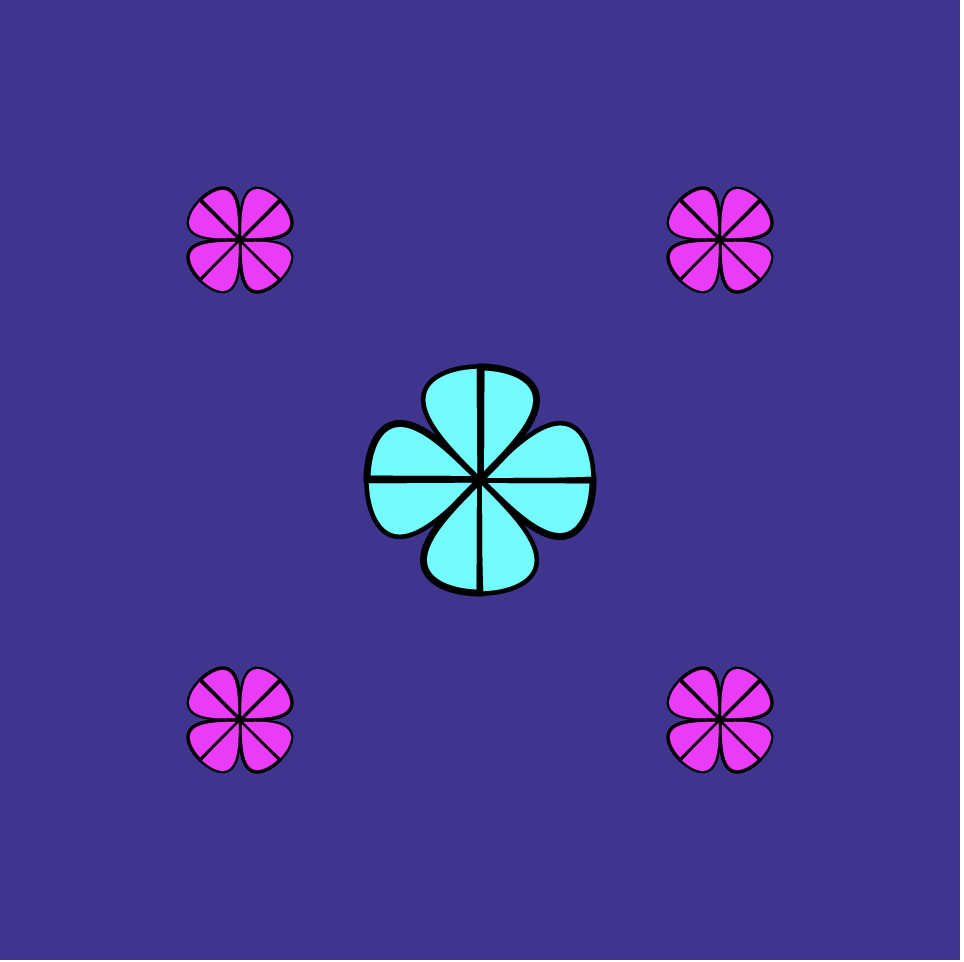
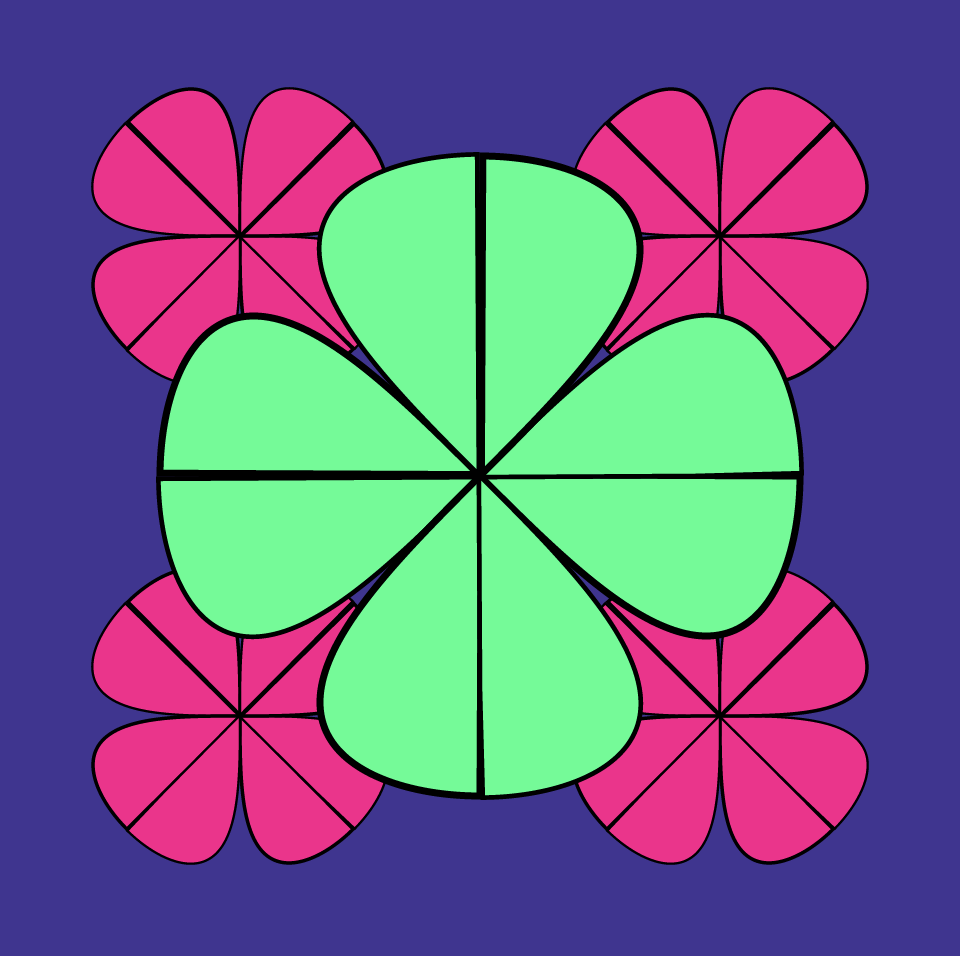
My process for this project was to find a curve I wanted to start with, I started working with a lemniscate and realized I can make flowers out of the infinity symbol. I wanted to make something infinity symbol related but I realized flowers are pretty and work well with the shape. I then made the sizes of the flowers change and the colors change based on the mouseX and mouseY positions.

sketchDownload
function setup() {
    createCanvas(480, 480);
}
function draw() {
  background(66,49,148);
  var P=color(mouseX,0,mouseY);    //small flowers
  var R=color(0,mouseX,mouseY);    //big flower
  push();
  fill(P);
  push();
  translate(width/(4/3),height/4);
  scale(.5);
  rotate(radians(45));
  drawCurve();    //small flower top right
  push();
  rotate(radians(90));
  drawCurve();    //small flower top right
  pop();
  pop();
  push();
  translate(width/(4),height/4);
  scale(.5);
  rotate(radians(45));
  drawCurve();    //small flower top left
  push();
  rotate(radians(90));
  drawCurve();    //small flower top left
  pop();
  pop();
  push();
  translate(width/(4/3),height/(4/3));
  scale(.5);
  rotate(radians(45));
  drawCurve();    //small flower bottom right
  push();
  rotate(radians(90));
  drawCurve();    //small flower bottom right
  pop();
  pop();
  push();
  translate(width/(4),height/(4/3));
  scale(.5);
  rotate(radians(45));
  drawCurve();    //small flower bottom left
  push();
  rotate(radians(90));
  drawCurve();    //small flower bottom left
  pop();
  pop();
  pop();
  push();
  fill(R);
  translate(width/2,height/2);
  push();
  drawCurve();   //big flower
  pop();
  push();
  rotate(radians(90));
  drawCurve();    //big flower
  pop();
}

function drawCurve() {
  var a=constrain(mouseX/2,0,width);
  strokeWeight(3.5);
  beginShape();
  var nPoints=360;
  for(var i=0; i<nPoints; i++){
    var t=map(i,0,nPoints,0,PI);    //lemniscate formulas
    x=(a*cos(t))/(1+sin(t)^2);
    y=(a*sin(t)*cos(t))/(1+sin(t)^2);
    vertex(x,y);
  }
  endShape(CLOSE);
  push();
  beginShape();
  scale(.67)
  var nPoints=360;
  for(var i=0;i<nPoints;i++){
    var r=map(i,0,nPoints,0,-PI);    ///other half of lemniscate
    x=(a*cos(r))/(1+sin(r)^2);
    y=(a*sin(r)*cos(r))/(1+sin(r)^2);
    vertex(x,y);
  }
  endShape(CLOSE);
  pop();
}

Project-07-Curves

sketch
//Ian Lippincott
//ilippinc
//Section D


//orange
//fill(240, 147, 109);
//blue
//fill(49, 57, 75);
//cream
//fill(255, 255, 226


var nPoints = 500;
var angle = 30;

function setup() {
    createCanvas(480, 480);
}

function draw() {
    background(49, 57, 100);
    //draw 2 sets of 36 hypotrochoids 
    for (var x = 80; x <= 400; x += 64) {
        for (var y = 80; y <= 400; y += 64) {
            push();
            translate(x, y);
            rotate(mouseX/20);
            drawEpitrochoid();
            pop();
        }
    }
}

function drawEpitrochoid() {
    var a = map(mouseX, 0, 480, 0, 120); 
    var b = map(mouseX, 0, 480, 0, 40); 
    var h = map(mouseY, 0, 480, 0, 40); 
    strokeWeight(4);
    //Cream Stroke
    stroke(255, 255, 226);
    //Orange Fill
    fill(240, 147, 109); 
    //Draw Epitrochoid
    beginShape(); 
    for (var i=0; i<nPoints; i++) {
        var angle = map(i, 0, 80, 0, TWO_PI);
        x = (a+b) * cos(angle) - h * cos(((a+b)/b) * angle);
        y = (a+b) * sin(angle) - h * sin(((a+b)/b) * angle);
        vertex(x, y);
    }
    endShape();
}

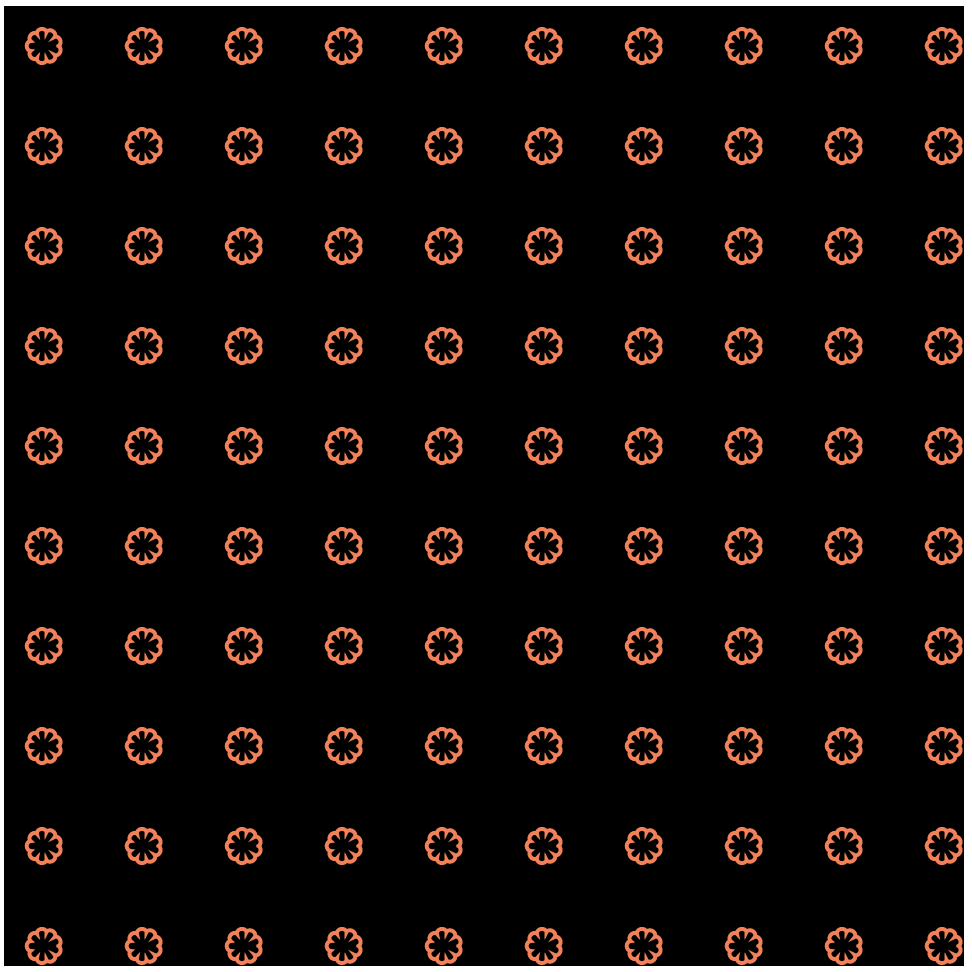
Project : 07

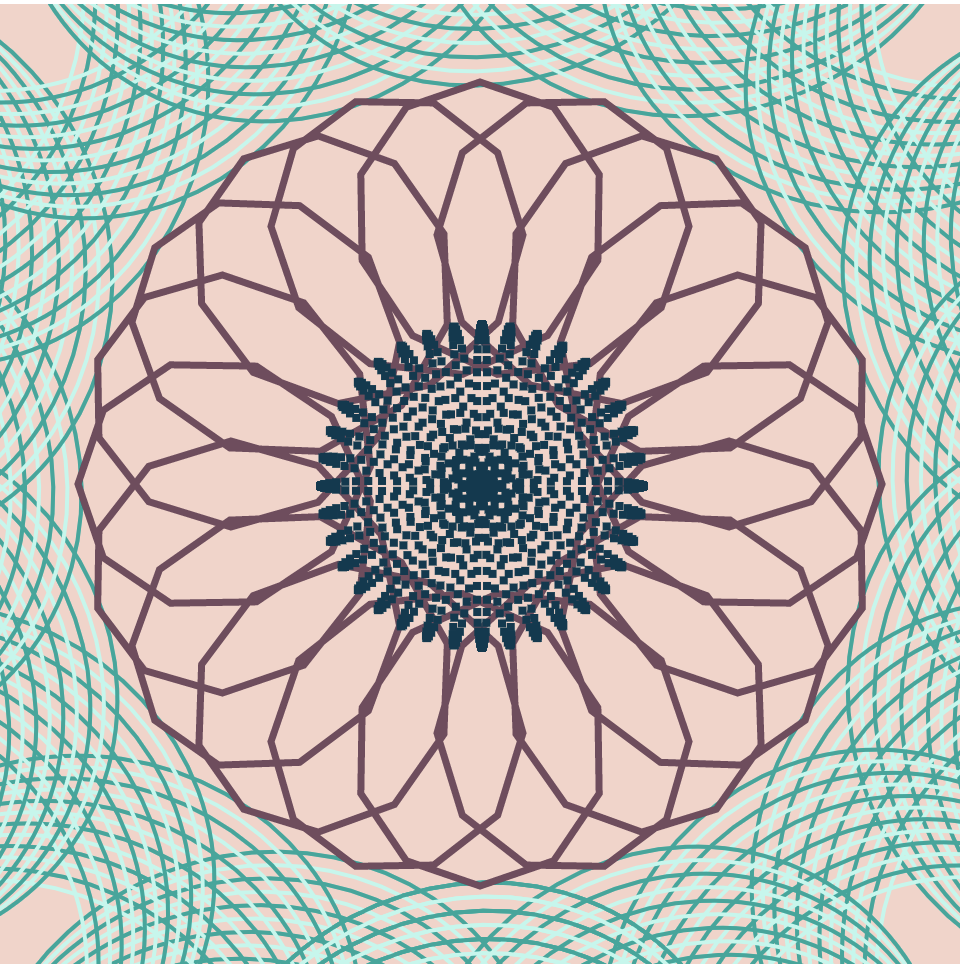
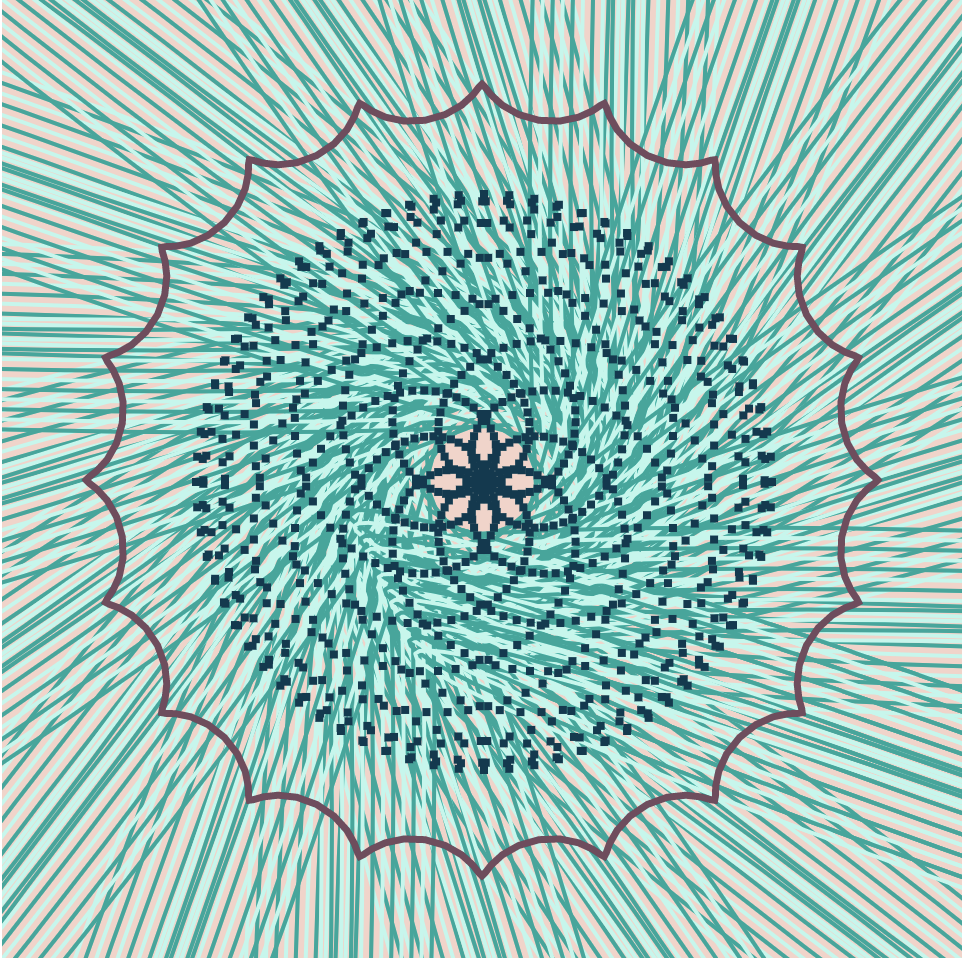
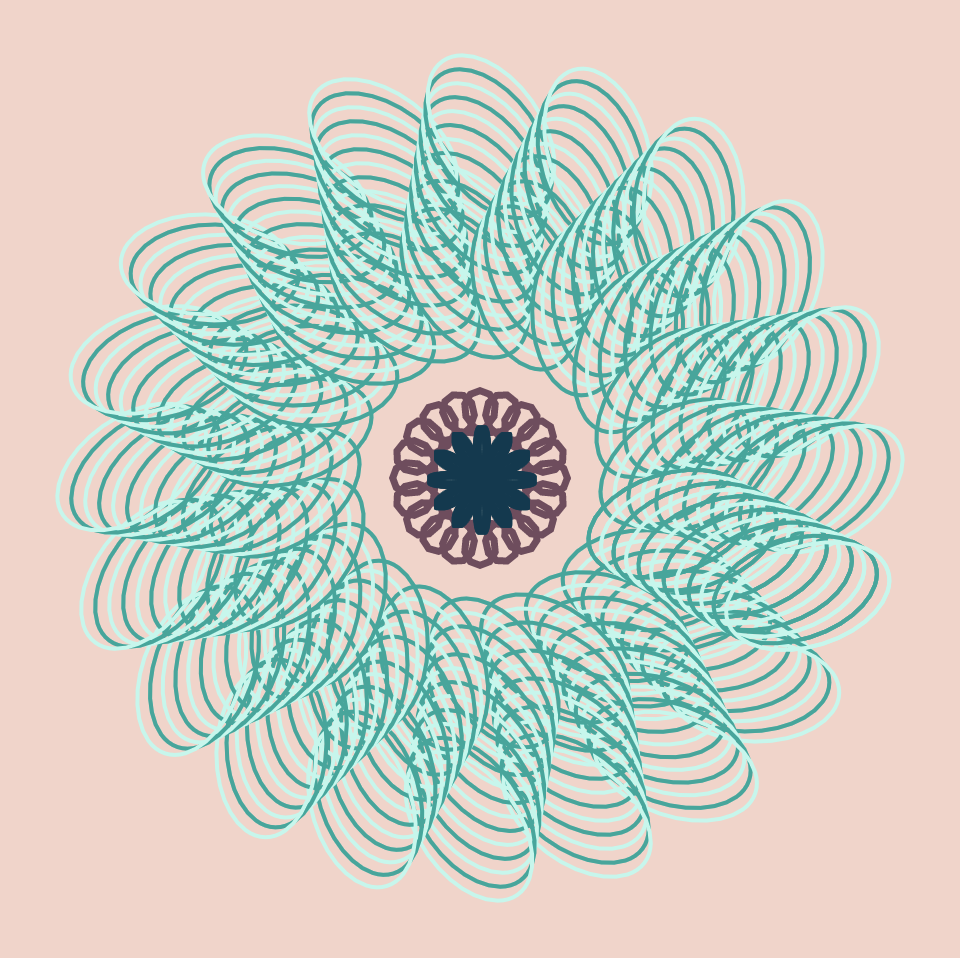
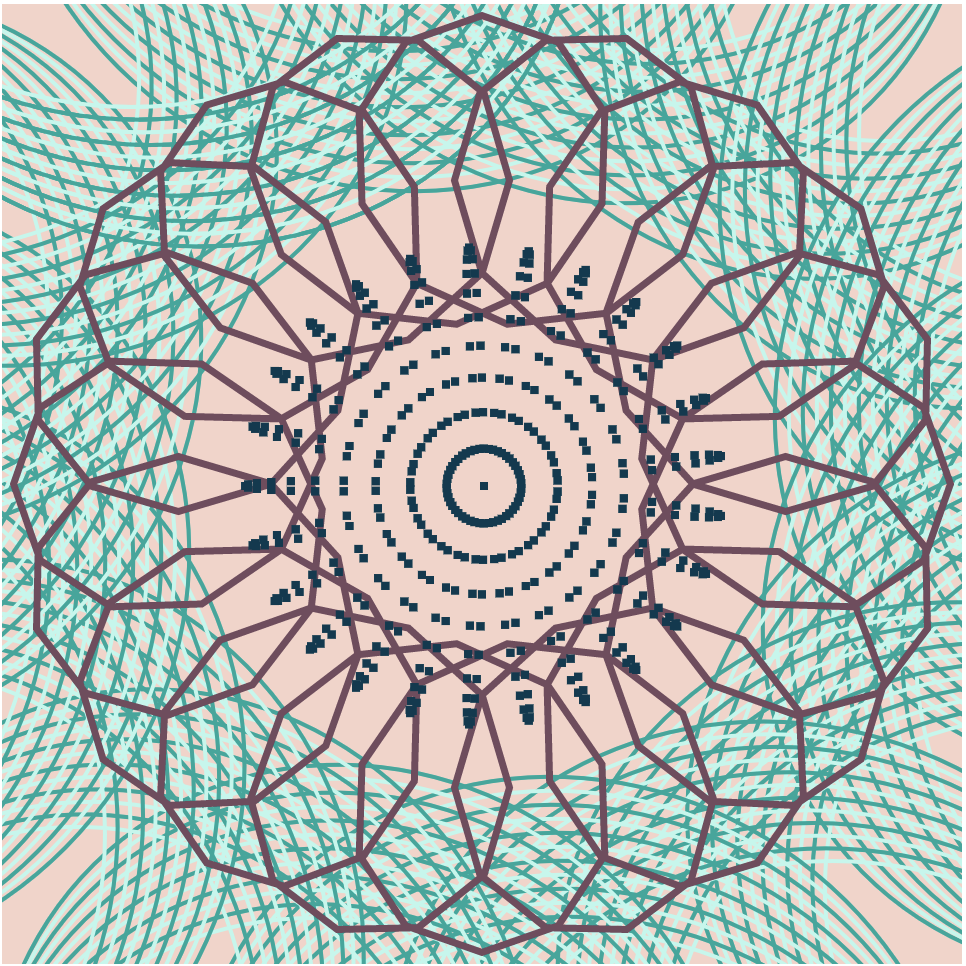
sketch For this project, I decided to use three different kinds of curves and represent them in different ways in order to create an interesting hierarchy of visuals and different point on the canvas.
//Aadya Bhartia
//Section A 
//abhartia@cmu.edu

/*The code aims to use three main types of curves and modify them based on the X and Y position the mouse
Each set of curves are represented in different ways making the code more visually interesting */

var angle = 0;
var numP = 10000;

function setup() {
    createCanvas(480, 480);
}

function draw() {
	background(245, 211, 200);
	var midX = width/2;
	var midY = height/2;
	var currentX = constrain(mouseX, 0, midX);
	var currentY = constrain(mouseY, 0, midY);
	noFill();
	translate(midX, midY); //transa;lting origin to centre of canvas 
	var m = map(constrain(mouseX, 0, width), 0, width, 0,width/60);
	push();
	rotate(radians(angle));
	angle +=mouseY/4; // making the set of curves rotate based on mouse position
	drawHypotrochoid1(currentX,currentY); 
	pop();
	drawHypotrochoid2();
	drawRose(m);
}
//Rose rhodonea curve set mapped with rectangles
function drawRose(m){
	fill(2, 58, 80); //dark blue 
	noStroke();
	var roseW = 18;
	for(var i = 0; i < numP/10;i++){ // reducing density of points 
		var roseMap = map(i, 0, numP/10, 0, TWO_PI);
		//The design chnages based on MouseX 
		var n = int(map(mouseX, 0, width, 1, width/15));
		var radius = -m*cos(n*roseMap);
		var x = roseW*radius*cos(roseMap);
		var y = roseW*radius*sin(roseMap);
		rect(x-1,y-1,4,4); // makinf the shape out of smaller rectangles instead of curves 
	}
}
// Hypotrochoid curve set 1
function drawHypotrochoid1(currentX,currentY){
	var a = 5;
	for(var k = 0;k<=PI*2;k+= PI/10){
		for(var i = 0; i<width/40;i++){
			push();
			strokeWeight(2);
			//every alternate stroke uses a different shade of blue 
			if(i%2 == 0){
				stroke(3, 168, 155);
			}
			else{
				stroke(188, 248, 236 );
			}
			rotate(k);
			ellipse(currentX + a*i, currentY + a*i, 2*mouseX/2, 2*mouseY/2);
			pop();
		}
	}
}
// Hypotrochoid curve set 2
function drawHypotrochoid2(){
	stroke(115, 75, 94); //maroon
	noFill();
	strokeWeight(3.5);
	var hypoMapY = map(mouseY, 0 , height, 0, width/4); //curve shape evolves based on Mouse Y 
	//Mouse X controls the size of the curve 
	var a = map(constrain(mouseX,0,width), 0 , width , 0, width/2);
	var b = a/20;
	beginShape();
	for(var i = 0; i<numP; i++){
		var hypoMap = map(i,0,100,0,PI);
		var x = (a - b) * cos(hypoMap)+ hypoMapY* cos(((a-b)/b)*hypoMap);
		var y = (a-b) * sin(hypoMap) - hypoMapY * sin(((a - b)/b)*hypoMap);
		vertex(x,y);
	}
	endShape();
}

Project 07: Composition with Curves

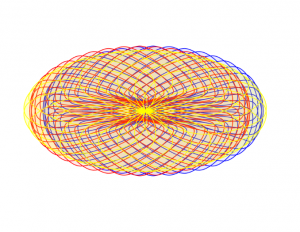
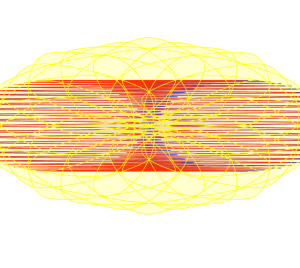
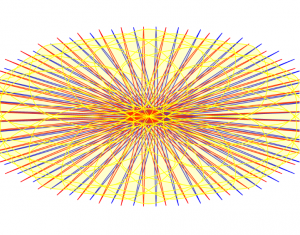
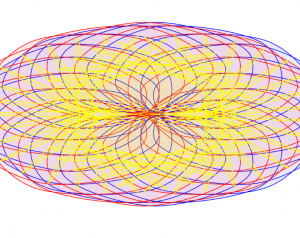
I used a series of three hypocycloid curves (based on the hypocycloid pedal formula) to model an interactive color wheel. I wanted to juxtapose the complex curves and forms with the simplicity of primary colors.

colorwheel
var nPoints = 100	//number of points in each curve

function setup() {
    createCanvas(480, 480);
}

function draw() {
	var halfWide = width/2
	var halfTall = height/2
	background('white')
	push();
	translate(halfWide+10, halfTall)	//move center of curves to center of canvas, offset by 10 tp create overlap later
	HypocycloidBlueCurve()	//draw blue curve
	pop();
	translate(halfWide-10, halfTall);	//move center of curves to center of canvas but offset the other way so overlaps with blue
	HypocycloidCurve()	//draw red curve
	translate(5, 0)	//move back to true canvas center to draw yellow curve over both red and blue
	HypocycloidYellowCurve()	//draw yellow curve
}

function HypocycloidCurve(){
    var a1 = constrain(mouseY, 0, 300, 150, 180); //size changes as vertical mouse position changes
    var b1 = 45;
    var n1 = int(mouseY / 6)	//number of cusps of the curve varies with vertical mouse position

    stroke('red');	//change stroke color to red
    strokeWeight(1);
    fill(255, 0, 0, 20);	//change fill to transparent red

    //create curve, using https://mathworld.wolfram.com/HypocycloidPedalCurve.html base formula for Hypocycloid Pedal Curve
    //map points of curve to circle
    beginShape();
    for (var i = 0; i < nPoints; i++) {
        var theta = map(i, 0, nPoints, 0, TWO_PI);     
        var x1 = a1*(((n1-2)*(cos(theta)-cos((1-n1)*theta)))/(2*n1))
        var y1 = a1*(((n1-2)*(cos(theta*(1-0.5*n1))*sin(0.5*n1*theta)))/(2*n1))
        curveVertex(x1, y1);
    }
    endShape(CLOSE); 
}

//draw blue hypocycloid, same as red but in blue
function HypocycloidBlueCurve(){
    var a1 = constrain(mouseY, 0, 300, 150, 180); //size changes as vertical mouse position changes
    var b1 = 45;
    var n1 = int(mouseY / 6)	//number of cusps of the curve varies with vertical mouse position
    fill(0, 0, 255, 20)	//fill transparent blye
    stroke('blue');	//set stroke color to blue
    strokeWeight(1);
    //create curve, using https://mathworld.wolfram.com/HypocycloidPedalCurve.html base formula for Hypocycloid Pedal Curve
    //map points of curve to circle
    beginShape();
    for (var i = 0; i < nPoints; i++) {
        var theta = map(i, 0, nPoints, 0, TWO_PI);     
        var x1 = a1*(((n1-2)*(cos(theta)-cos((1-n1)*theta)))/(2*n1))
        var y1 = a1*(((n1-2)*(cos(theta*(1-0.5*n1))*sin(0.5*n1*theta)))/(2*n1))
        curveVertex(x1, y1);
    }
    endShape(CLOSE); 
}
//draw yellow hypocycloid
function HypocycloidYellowCurve(){
    var a1 = constrain(mouseY, 0, 300, 150, 180); //size changes as vertical mouse position changes
    var b1 = 45;
    var n1 = int(mouseY / 10)	//number of cusps of the curve varies with vertical mouse position
    fill(255, 255, 0, 50)	//set fill color to a transparent yellow
    stroke('yellow');	//set stroke color to yellow
    strokeWeight(1);
	//create curve, using https://mathworld.wolfram.com/HypocycloidPedalCurve.html base formula for Hypocycloid Pedal Curve
    //map points of curve to circle
    beginShape();
    for (var i = 0; i < nPoints; i++) {
        var theta = map(i, 0, nPoints, 0, TWO_PI);     
        var x1 = a1*(((n1-2)*(cos(theta)-cos((1-n1)*theta)))/(2*n1))
        var y1 = a1*(((n1-2)*(cos(theta*(1-0.5*n1))*sin(0.5*n1*theta)))/(2*n1))
        curveVertex(x1, y1);
    }
    endShape(CLOSE); 
}