Final Project

sketch

// gnmarino
// Gia Marino
// section D

var cords = [];
function setup() {
    createCanvas(223.2, 223.2);

    // need counter so there doesn't need to be another loop
    var counter = 0;

    // stores in an array all the cordinate points of the squares
    for(var x = 0; x < 93; x++){
        for(var y = 0; y < 93; y++){
            cords[counter]= new Object();
            cords[counter].x = (x * 2.4);
            cords[counter].y = (y * 2.4);
            counter += 1
        }
    }
}
var squares = [];   // array stores makeSquare

function draw() {
    background(20);

    if(cords.length == 1){
        fill(255);
        textSize(10);
        text('Every square represents 24 metric tons',10, 15);
        text('of CO2 emissions produced from the US daily', 10, 30);
        for(var i = 0; i < 8649; i++){
            squares[i].moveSqr();
        }
        noLoop();
    }

    // makes a new array with every square object with a random xy cordinate
    squares.push(makeSquare(int(random(cords.length))));

    // displays a new square with the previous old squares
    // and displays new opactities
    for(var i = 0; i < squares.length; i++){ 
        squares[i].display();
        squares[i].changeOpacity();
    }
}

function moveSquares(){

    // scales visualization down and moves it
    for(var i = 0; i < 8649; i++){
        push();
        scale(.5);
        translate(112, 150);
        squares[i].display();
        pop();
        if(this.x < width/2 & this.x > 5){
            this.x --
        }
        if(this.x > width/2 && this.x < width-5){
            this.x ++ 
        }

    }
    noLoop();
}

function changeColor(){
    // once a square has been in frame for 15 seconds 
    // it starts to lower opacity to 40
    this.age ++
    if(this.age > 15 & this.opacity > 40){
        this.opacity -= 1;
    }

    // at the end all the squares return to opacity 230
    if(cords.length == 2){
        this.opacity = 230;
    }
}

function displaySquare(){
    fill(this.red, this.green, this.blue, this.opacity);
    noStroke();
    rect(this.x, this.y, 2.4, 2.4);
}

function makeSquare(cordNum){
    var square = {x: cords[cordNum].x,
                  y: cords[cordNum].y,
                  red: random(255),
                  blue: random(255),
                  green: random(255),
                  opacity: 255, 
                  age: 0,
                  display: displaySquare,
                  changeOpacity: changeColor,
                  moveSqr: moveSquares}

   // once a square cord is extracted from the array
   // it is removed so it isn't reused
    cords.splice(cordNum, 1);
    return square;
}

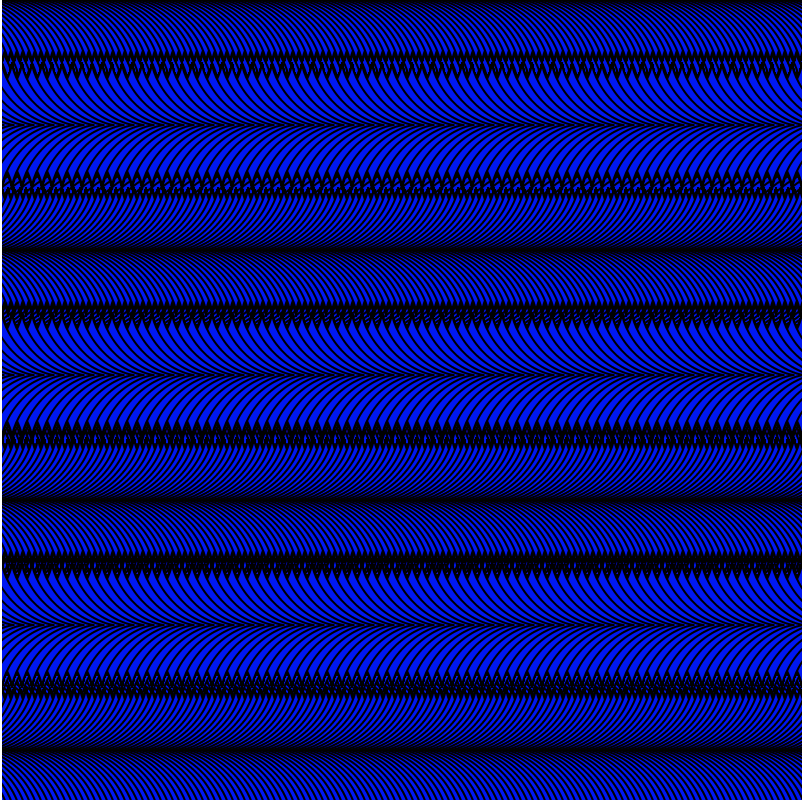
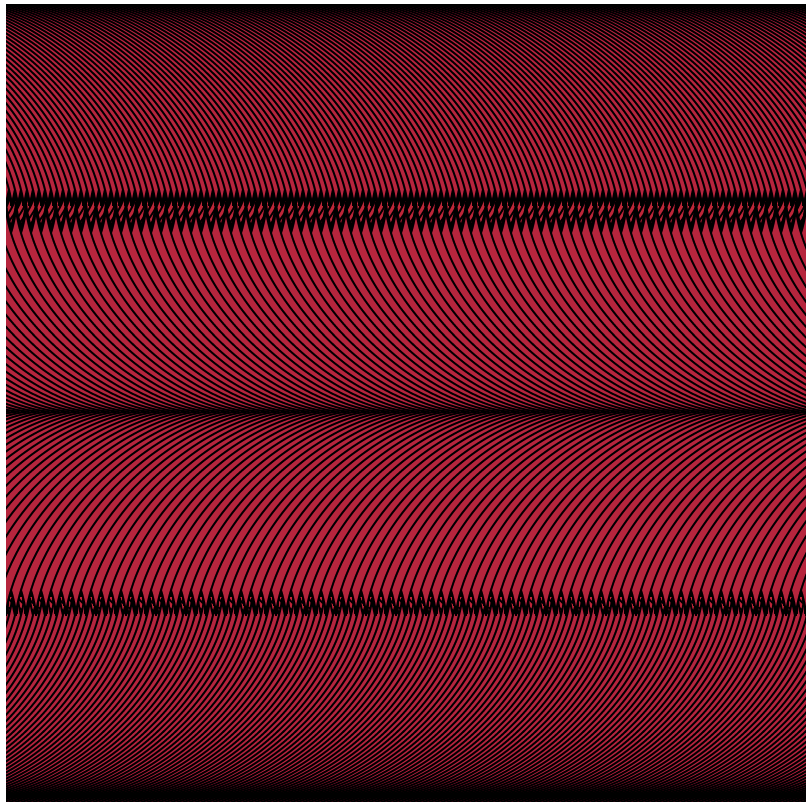
For my final project I made a data visualization of the daily carbon emissions in the US. I found a statistic that stated “Passenger cars produced 762.3 million metric tons of CO2 in 2019 [in the US]” (https://www.statista.com/statistics/1235091/us-passenger-car-ghg-emissions-by-vehicle-type/). I was overall inspired by how much the US’s lack of public transportation contributes to CO2 emissions.

I did the math and found that the US produces 24 metric tons of CO2 per second (52,910 lbs). So I figured out how to fit this perfectly on a square canvas with squares and found that if I had a canvas with the size of 223.2 x 233.3 and each square was 2.4, then it would be the correct ratio.

I decided to not make my visualization actually run second by second because it would look kinda boring. So, I sped it up, however each square does proportional represent one second of c02 emissions.

I decided to make my squares fade each time so you could see all the new squares popping in more clearly, because the point of the visualization is to see how many squares there are to represent really how much CO2 is produced each day!

Then at the end I minimize so you can see it all together and then you see the statistic so you know what the pretty animation represented.

Project 11

sketch

// gnmarino
// gia marino
// section D

// sushi conveyor belt animation

var sushis = [];
var nigiris = [];

function setup() {
    createCanvas(480, 320);

}

function draw() {
    background(220);

    // moves sushis and nigiris 
    moveDisplayOfSushiAndNigiri(); 
    // removes them if they go off the screen
    removeOldSushiAndNigiri();
    // adds new sushis and nigiris based off a low probability
    addSushi_or_Nigiri();
    // makes conveyour belt for sushi and nigiri to move on
    conveyorBelt();
}

function removeOldSushiAndNigiri() {
    var freshSushi = [];
    var freshNigiri = [];

    // if sushis are on the screen then put them in fresh sushi array
    // if they are not on the screen then they will disappear because 
    // they won't be added to the new array
    for (var i = 0; i < sushis.length; i++){
        if (sushis[i].x + sushis[i].sushiWidth > 0) {
            freshSushi.push(sushis[i]);
        }
    }

    // same with nigiris
    for (var i = 0; i < nigiris.length; i++){
        if (nigiris[i].x + nigiris[i].nigiriWidth > 0) {
            freshNigiri.push(nigiris[i]);
        }
    }

    sushis = freshSushi;
    nigiris = freshNigiri;
}

function moveDisplayOfSushiAndNigiri(){
    for(var i = 0; i < sushis.length; i ++){
        sushis[i].move();
        sushis[i].display();
    }

    for(var i = 0; i < nigiris.length; i ++) {
        nigiris[i].move();
        nigiris[i].display();
    }
}

function addSushi_or_Nigiri() {

    // this is the probability of being added everytime code loops
    var addSushiLikelihood = .005;
    var addNigiriLikelihood = .004;

    if(random(0, 1) < addSushiLikelihood) {
        sushis.push(makeSushi(width));
    }

    if(random(0, 1) < addNigiriLikelihood) {
        nigiris.push(makeNigiri(width +10));
    }

}

function displayNigiri() {

    push();
    strokeWeight(2);
    // these variables are used to make it easier to put the shapes together
    var nigiriTop = 180-this.nigiriHeight   // conveyor belt is at 180
    var nigiriMiddle = this.nigiriWidth/2 + this.x

    fill(247, 246, 241);    //off-white
    rect(this.x, nigiriTop, this.nigiriWidth, this.nigiriHeight);
    fill(this.sashimiColor);
    ellipse(nigiriMiddle, nigiriTop, this.nigiriWidth + 15, 40);

    // this is to cover last ellipse so it looks more like shashimi
    fill(247, 246, 241);    //off-white
    ellipse(nigiriMiddle, nigiriTop + 10, this.nigiriWidth, 25);
    noStroke();
    rect(this.x + 1, nigiriTop + 10, this.nigiriWidth-2, 15);
    pop();

}

function displaySushi() {

    // these variables are used to make it easier to put the shapes together
    var sushiMiddle = this.sushiWidth/2 + this.x
    var sushiTop = 180-this.sushiHeight     // conveyor belt is at 180
    push();
    strokeWeight(2);
    fill(this.wrapColor);
    rect(this.x, sushiTop, this.sushiWidth, this.sushiHeight);
    fill(247, 246, 241);    //off-white
    ellipse(sushiMiddle, sushiTop, this.sushiWidth, 25);
    fill(this.fishColor);
    ellipse(sushiMiddle, sushiTop, this.sushiWidth-20, 15);
    pop();
}

function move_sushi_nigiri() {
    this.x += this.speed;
}

// sushi object
function makeSushi(originX) {
    var sushi = {x: originX, 
                 sushiWidth: random(55, 100),
                 sushiHeight: random(35, 70),
                 wrapColor: color(0, random(100) , 0),
                 fishColor: 
                 color(random(230, 260), random(145, 225), random(70, 160)),
                 speed: -3,
                 move: move_sushi_nigiri,
                 display: displaySushi}
    return sushi;
}

// nigiri object
function makeNigiri(originX) {
    var nigiri = {x: originX,           // don't know if i need to change that
                 nigiriWidth: random( 70, 110),
                 nigiriHeight: random( 15, 40),
                 sashimiColor: 
                 color(random(230, 260), random(145, 225), random(70, 160)),
                 speed: -3,
                 move: move_sushi_nigiri,
                 display: displayNigiri}
    return nigiri;
}

function conveyorBelt() {

    push();
    fill(70);
    rect(40, 185, 440, 150)
    fill(180);
    strokeWeight(5);
    ellipse(30, 260, 150);
    ellipse(450, 260, 150);

    strokeWeight(12);
    line(30, 335, 450, 335);
    line(30, 185, 450, 185);
    arc(30, 260, 150, 150, radians(90), radians(270), OPEN);
    arc(450, 260, 150, 150, radians(-90), radians(90), OPEN);

    pop();
}

Looking Outwards 11

This week I decided to look into the article “NFTs and Copyright”.

What I found most interesting is that basically NFTs don’t give the “owner” copywriter ownership so they cannot print or distribute the work without permission. It is basically making digital work collectors items.

What’s even more interesting is that you can make an NFT for anything. So spammers are grabbing URLs and releasing NFTS upon them. However, this is also a big copyright infringement, and that’s where the problem is created.

Overall, it could help creators prove their copyright, and it does give digital creators a way to give out unique copies of their work, the problem is there is no system or governing for NFTs to prevent bots.

I think NFTs shows how a virtually useless thing can be abused, which really shows how our society works and how easily the internet makes it to abuse things. Overall, I think it’s very scary that loads of money can be passed around and rules can be broken so easily if there isn’t laws in place to stop them.

Link to article: https://www.plagiarismtoday.com/2021/03/16/nfts-and-copyright/

Project 10: Animation

sketch

// gnmarino
// gia marino
// class section D

// the story is suppose to be up to your own interruptation.
// the main point is someone is trying to reach love and they can't so 
// a friend has to help them out. The concept is about how sometimes
// you need a friend's help even if it's a little thing

var rope; // rope swinging noise
var heart; // heart's voice
var char1; // 1st character's voice
var walking; // 2nd character's walking
var counter = 0; // counts the frames
var animationImages = []; // holds images for animation

function preload() {
    rope = loadSound("https://courses.ideate.cmu.edu/15-104/f2021/wp-content/uploads/2021/11/Rope-Sound.wav");
    heart = loadSound("https://courses.ideate.cmu.edu/15-104/f2021/wp-content/uploads/2021/11/Heart.wav");
    char1 = loadSound("https://courses.ideate.cmu.edu/15-104/f2021/wp-content/uploads/2021/11/character1noise.wav");
    walking = loadSound("https://courses.ideate.cmu.edu/15-104/f2021/wp-content/uploads/2021/11/walking.wav")

    var imageNames = [];
    imageNames[0] = "https://i.imgur.com/ZP19uwT.jpg";
    imageNames[1] = "https://i.imgur.com/4Bl2ivM.jpg"
    imageNames[2] = "https://i.imgur.com/VaO2Qof.jpg"
    imageNames[3] = "https://i.imgur.com/tpxAt2V.jpg"
    imageNames[4] = "https://i.imgur.com/nkNrX5Y.jpg"
    imageNames[5] = "https://i.imgur.com/HEE2XA5.jpg"
    imageNames[6] = "https://i.imgur.com/7vkRyqN.jpg"
    imageNames[7] = "https://i.imgur.com/FOvHPju.jpg"
    imageNames[8] = "https://i.imgur.com/22f630s.jpg"
    imageNames[9] = "https://i.imgur.com/7bbhlOa.jpg"
    imageNames[10] = "https://i.imgur.com/Ke1o6Gb.jpg"
    imageNames[11] = "https://i.imgur.com/hnSXa9y.jpg"
    imageNames[12] = "https://i.imgur.com/HPLomd1.jpg"
    imageNames[13] = "https://i.imgur.com/ifo5g3u.jpg"
    imageNames[14] = "https://i.imgur.com/cedp6AC.jpg"
    imageNames[15] = "https://i.imgur.com/6XxqZ1u.jpg"
    imageNames[16] = "https://i.imgur.com/rhEs6bx.jpg"
    imageNames[17] = "https://i.imgur.com/o5VujYT.jpg"
    imageNames[18] = "https://i.imgur.com/9nXwcuh.jpg"
    imageNames[19] = "https://i.imgur.com/07qlded.jpg"
    imageNames[20] = "https://i.imgur.com/wH2NFj7.jpg"
    imageNames[21] = "https://i.imgur.com/qB6Ayi0.jpg"
    imageNames[22] = "https://i.imgur.com/AM8eMi3.jpg"
    imageNames[23] = "https://i.imgur.com/uOzyybS.jpg"
    imageNames[24] = "https://i.imgur.com/vnEhu5u.jpg"
    imageNames[25] = "https://i.imgur.com/SEA3Z8z.jpg"

    for (var i = 0; i < imageNames.length; i++){
        animationImages[i] = loadImage(imageNames[i]);
    }
}

function setup() {
    createCanvas(400, 400);
    useSound();
    frameRate(1);
    background(200);
}

function soundSetup() { // setup for audio generation
    rope.setVolume(0.5);
    heart.setVolume(0.5);
    char1.setVolume(0.5);
    walking.setVolume(0.5);
}

function draw() {

    // displays an image every frame
    image(animationImages[counter], 0, 0, 400, 500);

    // all the if statements state what frame each noise will play
    if (counter == 1 || counter == 11 || counter == 24) {
        char1.play();
    }
    if ( counter == 4 || counter == 25) {
        heart.play();
    }
    if (counter == 6) {
        rope.play();
    }
    if (counter == 13 || counter == 15) {
        walking.play();
    }

    counter ++

    // ends animation
    if (counter == animationImages.length+1) {
        background(0);
        noLoop();
    }
}

For my project this week I wanted to story to be interrupted however you wanted. So the actual story is quite simple but you could get many different means out of the animation. My four sounds were the heart’s voice, the rope moving, character 1’s voice, and character 2’s footsteps.

Looking Outwards 09

This week I am looking at Heather Kelley.

Heather Kelley is a designer that does game design, sense design, and interaction design.

She studied at University where she got her MA in advanced communications technologies. She works at perfect plum currently but she has done many amazing things like co-found Kokoromi and named as one in five of the most powerful women in gaming.

One project I thought was cool was how she added onto a Star Wars exhibit. Basically, she designed kiosks that were in front of characters in the movies and it reveals their origin, family, mentors, careers, and personal values, so people can figure out which character they identify with.

A picture of a kid interacting with one of the kiosks she designed

Link to Project: https://www.perfectplum.com/portfolio_category/interaction/

I really admire this project because one it shows how to enhance the experience of an exhibit which in nature can often be boring. Also, it allows people to explore identities and see how they may identify with a character they may not expect.

Link to her website: https://www.perfectplum.com/

Project 9

sketch

// gnmarino
// Gia Marino
// section D

var img;

function preload() {
    img = loadImage("https://i.imgur.com/0H1pS9T.jpg"); 
}

function setup() {
    createCanvas(480, 350);
    background(220);
    noStroke();
    background(255);
    frameRate(20);
}

function draw() {

    // captures the color of every 3 pixels and fills the circles
    for(var x = 0; x < width; x+= 3){
        for(var y = 0; y <= height + 100; y+= 3){

            var color = img.get(x, y);
            fill(color);

            // when mouse pressed the image is less blurred 
            if(mouseIsPressed) { 
                size = random(5);
                ellipse(x, y, size);
            } else {
                size = random(50);
                ellipse(x, y, size);
            }

        push();
        stroke(0);
        text("Press Mouse", 15, 15);
        pop();

        }
    }
}

For this project I had a hard time figuring out how to be creativity without overloading my code. This is because I loop my code so many times to create my picture out of dots that when I went in to change things or print things in the loop my computer would just be having to run way too much. Thus, I decided it be cool to make a project where you uncover my face by clicking on the screen rather than adding anymore to the final image.

Before Doing Anything
After Holding Down the Mouse For 3 Seconds

Looking Outwards 08

For this Looking outwards I selected Hyphen-Labs 2018 lecture.

They are small company that started in 2014. The company is ran internationally by a team of women of color. They like to transition in-between realities and push the envelope with design, science, and conceptual art to address problems and make aesthetically pleasing things.

One of their projects that I enjoyed was their products that they created to help protect protestors. The first product was an earring that would film police brutality and automatically upload to a cloud or a cop watch. The second product was a scarf that would cause technology to detect faces on the scarf and the thought behind this is to possibly overload a system that may be trying to detect protestors faces in the future.

Hyphen-Labs Prismatic Light Project

During their lecture, I really liked how they presented their light project because they had a close up video of the gear turning. I am not sure if it was CAD or a real video but it gave a lot of visual explanation of how the piece worked with just that one video. Also their overall cinematography of all their pieces was beautiful and made it all look so cool and professional and I think that can really make a design even better then it is.

Eyeo 2018 – Hyphen Labs

Link to their website: hyphen-labs.com

Curves Interactive Drawing – P07

sketch

// gnmarino@andrew.cmu.edu
// Gia Marino
// section D

var red; // variable for red in fill for gradient
var blue;  // variable for blue in fill for gradient

function setup() {
createCanvas(400, 400);
background(200);

}
function draw() {

    // maps variables red and blue so mouseX at 0 makes fill blue
    // and at edge of the canvas mouseX makes color red
    // creates a blue to red gradient 
    red = map(mouseX, 0, width, 0, 255);
    blue = map(mouseX, width, 0, 0, 255);

    // fills shapes and makes a red to blue gradient
    fill(red, 0, blue);

    // nested loop draws astroids going to the right and skips every other row
   for (var y1 = 0; y1 <= width; y1 += 4*size) {
        drawAstroid(0, y1);

        for(var x1 = 0; x1 <= width + size; x1 += 3) {
            drawAstroid(x1, y1);

        }
   }

   // nested loop draws astroids going to the left and skips every other row
   for (var y2 = 2 * size; y2 <= width; y2 += 4*size) {
        drawAstroid(width, y2);

        for(var x2 = width; x2 >= 0 - size; x2-=5) {
            drawAstroid(x2, y2);
        }
    }
}

function drawAstroid(x, y) {

    // push needed so translate doesn't effect rest of code
    push();
    translate(x, y);

    beginShape();

    // loop and astriod x and y implements math for astroid curve
    for(var k = 0; k<360; k++){
    // allows for mouseY to change size of astroid between 20 up to 80 pixels 
    size = map(mouseY, 0, height, 20, 80);
    Astroidx = size * Math.pow(cos(radians(k)),3);
    Astroidy = size * Math.pow(sin(radians(k)),3);
    vertex(Astroidx,Astroidy);
}
    endShape(CLOSE);

    pop();
}

For this week I had a really difficult time figuring out what curves would work for my ideas. I originally wanted to try a whirl with a logarithmic spiral but it was too difficult to implement the math. I then found the astroid shape and thought it was cool so I figured out how to implement it into code and then I made it move with mouse X and mouse Y tried to find a pattern or drawing that would look cool. I eventually found a pattern by doing this and decided my idea. I then decided my parameters would be changing the size of the astroid which therefore changes how many rows you see, and the color.

My project when you move your mouse to left middle
My project when you move your mouse down past the canvas and 3/4 to the right

Looking Outwards 07

For this week’s exploration of data visualization I picked Ebb and Flow and I am particularly going to look at their project for Pitch Interactive Inc called “Covid-19 Daily Cases Across the US”.

This is a line graph that has every state available and you can mouse over and get even more information on total cases and compare it to the overall US

I really admire this tool because I feel like this is a great example of when data visualization is needed the most. It is an important tool for educating the public in a clear way especially when stress is high and misinformation is rampant. This project started while the concept of flattening the curve was spreading.

This graph uses the steam graph methodology and the data was extracted from the New York Times. This graph allows you to look at certain states and be able to compare them. The y-axis shows confirmed cases and deaths and the x-axis represents time starting March 7th.

Overall, I think this tool is very cool because it seems like this tool is constantly evolving even while the pandemic is currently winding down in the US. I think visualizations like this are so important and I think this team did really well at making it clear and concise while also informational.

Link://www.pitchinteractive.com/work/EbbandFlow/

Abstract Clock

sketch

// project 06
// gnmarino@andrew.cmu.edu
// Gia Marino
// Section D

var theta = 0;     // references theta in draw function only
var m;   // current minute
var h;   // current hour

function setup() {
    createCanvas(480, 480);
    background(255);
}

function draw() {

    translate(width/2, height/2);

        // rotates whole clock 

        rotate(radians(theta));

        // draws the whole clock

        NightAndDay();    // draws the night and day sides of the circle
        sun(0, height/2 - 80);
        moon(0, -height/2 + 80);
        clouds(width/2 - 25, 0);
        diamonds(-width/2 + 25, 0);
    
    // takes current time and calculates how much to rotate the clock
    // every minute the clock should turn .25 degrees 
    // every hour the clock should have rotated 15 more degrees

    m = minute();
    h = hour();
    theta = (h * 15) + (m * .25);

}

function sun(sunX, sunY) {

    push();

    // orangey yellow color for sun

    fill(253, 208, 25);

    // moves sun to coordinates stated in draw function

    translate(sunX, sunY);

    circle(0, 0, 50);    // middle of sun

    // strokeWeight and loop makes the sun rays

    strokeWeight(2);

    for (theta = 0; theta < 360; theta += 45) {
        rotate(radians(theta));
        line(30, 0, 37, 0);

    }

    pop();
}

function moon(moonX, moonY) {

    push();

    fill(220);  // light grey

    // moves moon to coordinates stated in draw function

    translate(moonX, moonY);

    circle(0, 0, 50);

    pop();
}

function diamonds(diamondX, diamondY) {

    push();

    noFill();
    strokeWeight(5);

    // counter keeps track how many times the for-loop loops
    // needs to start at 12 so the diamonds don't fill in when it's before noon

    var counter = 12;

    // loop rotates and draws diamonds
    
    for (theta = 7; theta < 177; theta += 15) {

    push();

    rotate(radians(theta));

    // moves diamonds to coordinates stated in draw function

    translate(diamondX, diamondY)

    // scale & rotate are used to make diamonds look better along the border

    scale(.25);
    rotate(radians(90));

    // if statement says the diamonds should be filled in based on the hour
    // diamond fills in after every hour passes
    // if clock hasn't passed that hour yet then diamond stays unfilled
    // diamonds fill in for 1pm to 12 am

    if (counter < h) {
        fill(255);
    } else {
        noFill();  
    }

    // draws 1 diamond every time

    beginShape();
    vertex(-20, 0);
    quadraticVertex(-10, -5, 0, -30);
    quadraticVertex(10, -5, 20, 0);
    quadraticVertex(10, 5, 0, 30);
    quadraticVertex(-10, 5, -20, 0);
    endShape();

    pop();

    counter += 1; // adds 1 everytime loop ends

    }
    
    pop();
}


function clouds(cloudX, cloudY) {
    
    push();

    strokeWeight(5);
    noFill();

    // counter keeps track how many times the for-loop loops
    // counter starts at zero so clouds starts filling after 1st hour has passed

    var counter = 0;

    // loop rotates and draws clouds

    for (theta = 7; theta < 177; theta += 15) {

    push();

    rotate(radians(theta));

    // moves clouds to coordinates stated in draw function

    translate(cloudX, cloudY);

    // scale & rotate are used to make clouds look better along the border

    scale(.25);
    rotate(radians(90));

    // if statement says the clouds should be filled in based on the hour
    // cloud fills in after every hour passes
    // if clock hasn't passed that hour yet then cloud stays unfilled
    // clouds fill in for 1 am to 12 pm

    if (counter <= h) {
        fill(255);
    } else {
        noFill();
    }

    // draws 1 cloud every time

    beginShape();
    vertex(0, 0);
    quadraticVertex(-45, 5, -40, -10);
    quadraticVertex(-35, -30, -15, -20);
    quadraticVertex(-20, -40, 0, -40);
    quadraticVertex(20, -40, 15, -20);
    quadraticVertex(35, -30, 40, -10);
    quadraticVertex(45, 5, 0, 0);
    endShape();

    pop();

    counter += 1; // adds 1 everytime loop ends

    }
    pop();
}
 
function NightAndDay() {

    push();
    
    // yellow half circle represents day time
    
    fill(255, 238, 127);     // yellow
    arc(0, 0, width, height, radians(0), radians(180));

    // navy half circle represents night time

    fill(60, 67, 129);     // navy
    arc(0, 0, width, height, radians(180), radians(360));

    pop();

}

For this assignment I actually got inspiration from the Minecraft clock because it is the first example I could think of for a non-western standard clock.

I started off by deciding that I wanted the daylight half circle to be fully on the top and vice versa with the night side.

My Sketch

I ended up deciding that I wanted the clock to emulate how the sky typically looks if you are at a reasonable latitude on earth. So, when it is noon and the sun is highest in the sky then I want the clock’s yellow side to be fully on top so it looks like  what you’d see if you’d looked outside at noon. It also kinda shows when the sun rises and sets too.

Lastly, I decided that I wanted someone to be looking at my clock and know what time it is and not completely guess. So, I made little hour symbols (the clouds and diamonds) light up every time an hour passes. This makes it when you look at the clock you can count how many clouds or diamonds are white and know it’s been x amount of hours.