//Alana Wu
//ID: alanawu
//Project 07 Mathematical Curves

var nPoints1 = 40;
var nPoints2 = 550;
var nPoints3 = 100;
var whichCurve = 1;


function setup()
{
    createCanvas(480, 480);
    background(0);
    stroke (255);

}

function draw()
{
    translate (width/2, height/2);
    if (whichCurve == 0)
    {
        rotate (radians (constrain (mouseY, 50, height - 50)));
        sinusoidSpiral ();
    }
    if (whichCurve == 1)
    {
        rotate (radians (mouseX));
        archiSpiral();
    }
    if (whichCurve == 2)
    {
        astroidCurve();
    }

}

//https://mathworld.wolfram.com/SinusoidalSpiral.html
function sinusoidSpiral () //r^n = (a^n)cos(n*theta)
{
    var x;
    var y;
    var a = mouseX/10;
    var b = constrain (mouseX/10, 2, 9);
    var theta = radians (0);

    fill (mouseX - 100, mouseY - 100, mouseY - 100);
    beginShape();
    for (var i = 0; i < nPoints1; i++)
    {
        var theta = map(i, 0, nPoints1, 0, TWO_PI);
        x = a * (b*cos(theta) - cos(b * theta));
        y = a * (b * sin(theta) - sin(b * theta));
        vertex (x, y);
    }
    endShape(CLOSE);
}

//https://mathworld.wolfram.com/ArchimedeanSpiral.html
function archiSpiral ()
{
    var x;
    var y;
    var a = mouseX/10;
    var n = 10;

    push();
    background(0);
    noFill();
    stroke(255);
    strokeWeight(.2);
    beginShape();
    for (var i = 0; i < nPoints2; i++)
    {
        var theta = map (i, 0, nPoints2, 0, TWO_PI*2);
        x = a * cos (theta) * (theta)^(1/n);  //x = rcos(theta)
        y = a * sin(theta)*theta^(1/n) + random(-5, 5); //x = rsin(theta)
        stroke (mouseX, 0, mouseY);
        vertex (x, y);

    }
    endShape(CLOSE);
    pop();
}

//https://mathworld.wolfram.com/AstroidRadialCurve.html
function astroidCurve ()
{
    var x;
    var y;
    var a = 200;

    push();
    background(0);
    stroke(mouseX, mouseX/10, mouseY + 30);
    noFill();
    beginShape();
    for (var i = 0; i < nPoints3; i++)
    {
        var theta = map (i, 0, nPoints3, 0, TWO_PI);
        x = a * (cos (theta))^3 + random (-5, 5);
        y = a * (sin(theta))^3 + random (-5, 5);
        print (x);
        print (y);
        vertex (x, y);
    }
    endShape(CLOSE);
    pop();
}


//which shape is drawn changes when mouse is clicked
function mousePressed ()
{
    whichCurve++;
    if (whichCurve == 3)
    {
        whichCurve = 0;
    }
}
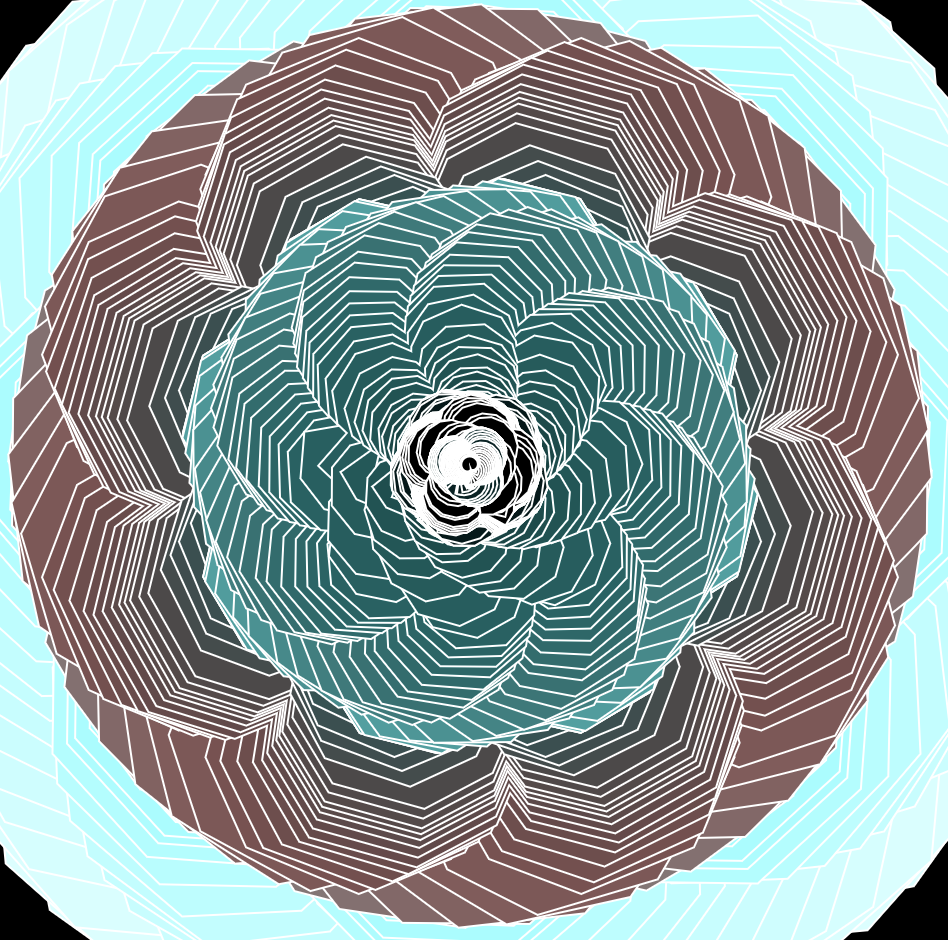
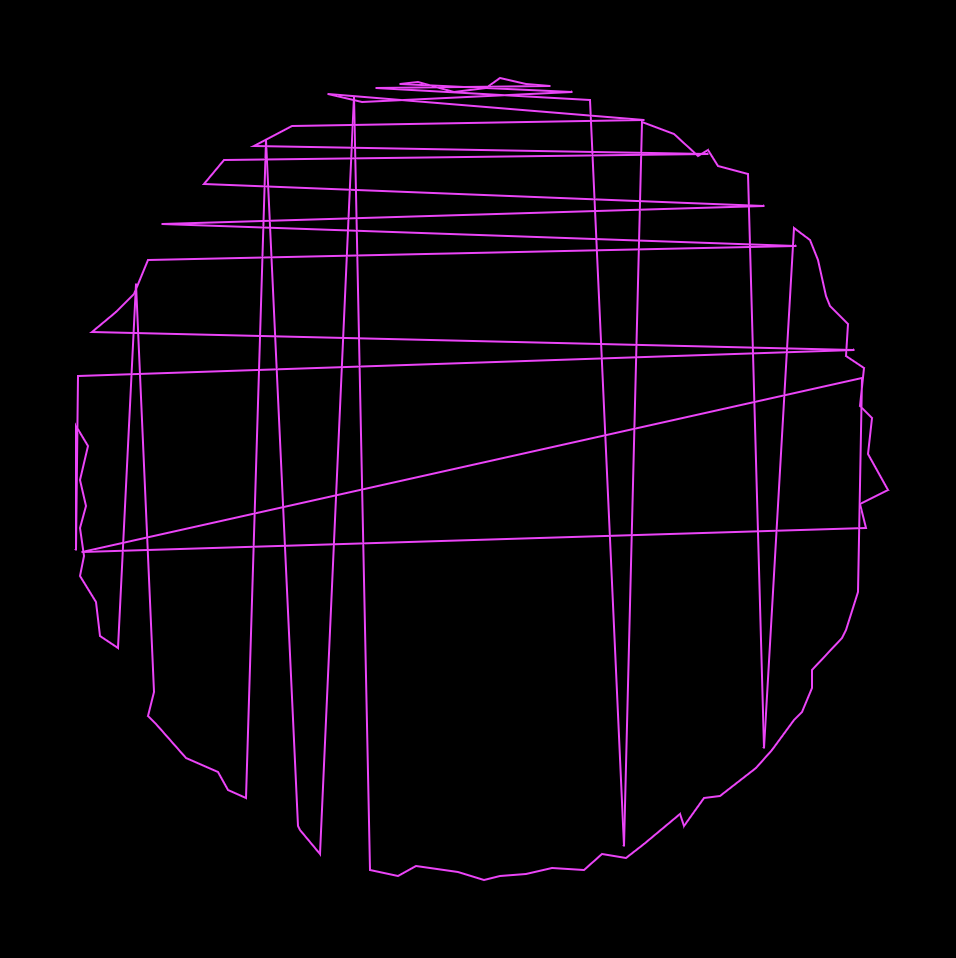
For this project, I chose to use a sinusoidal spiral, an archimedes spiral, and an astroid radial curve. I spent a lot of time altering the parameters to see how they affected the shapes. To add user interaction, I had different aspects of the shapes change with the mouse location, while which curve drawn changed as the mouse was clicked. I particularly liked playing with the colors and rotations of sinusoidal spiral.

Doing this project also made me wonder how other mathematical concepts can be visualized, and whether or not that could help people understand certain mathematical concepts better.

![[OLD SEMESTER] 15-104 • Introduction to Computing for Creative Practice](wp-content/uploads/2023/09/stop-banner.png)