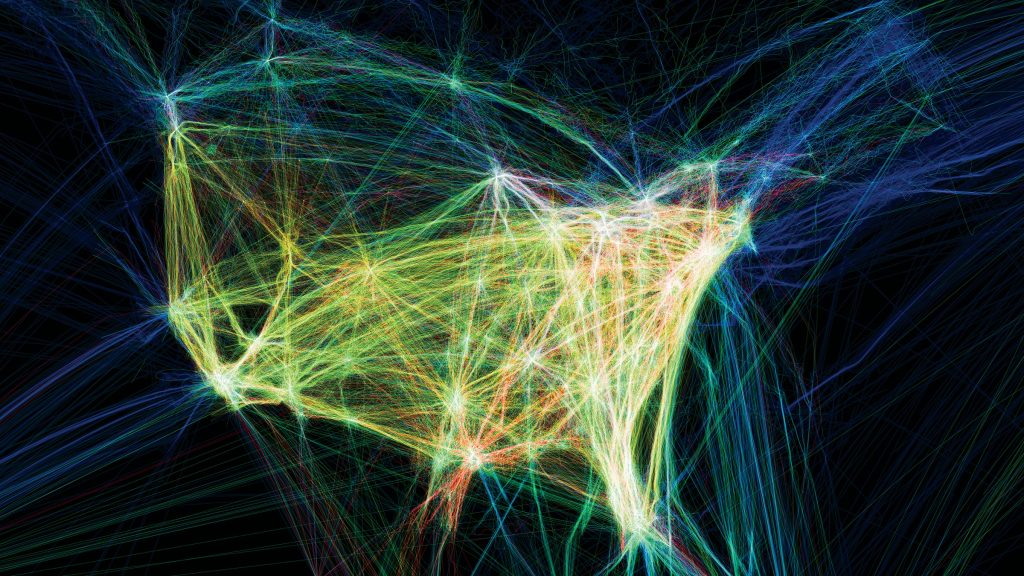
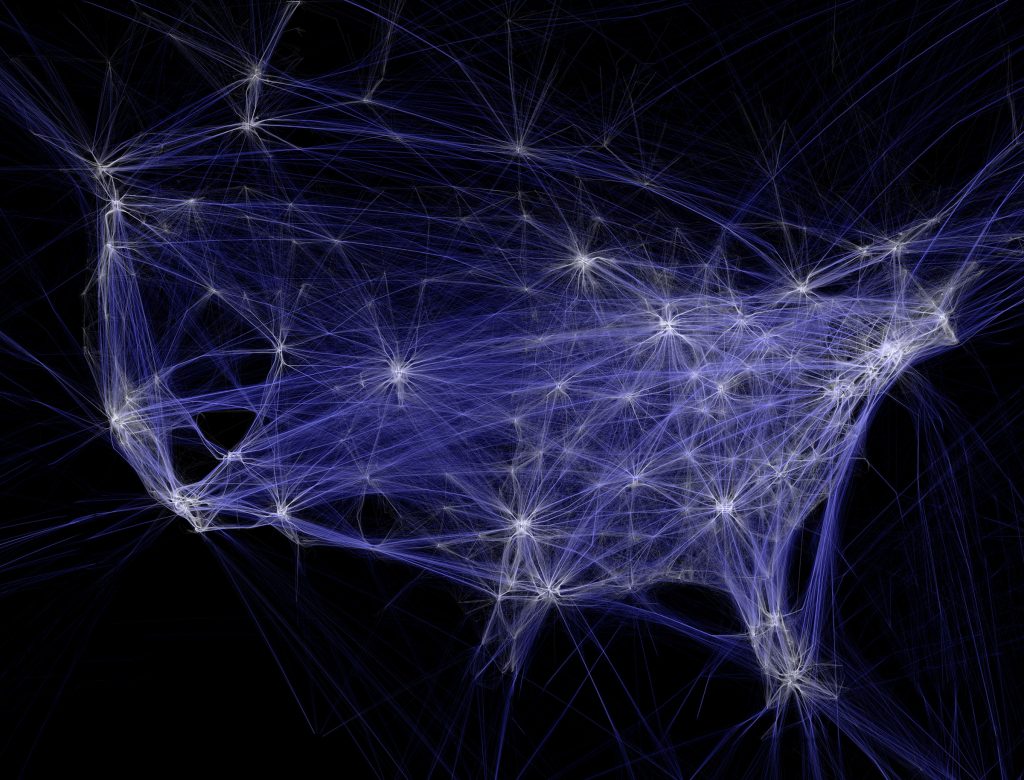
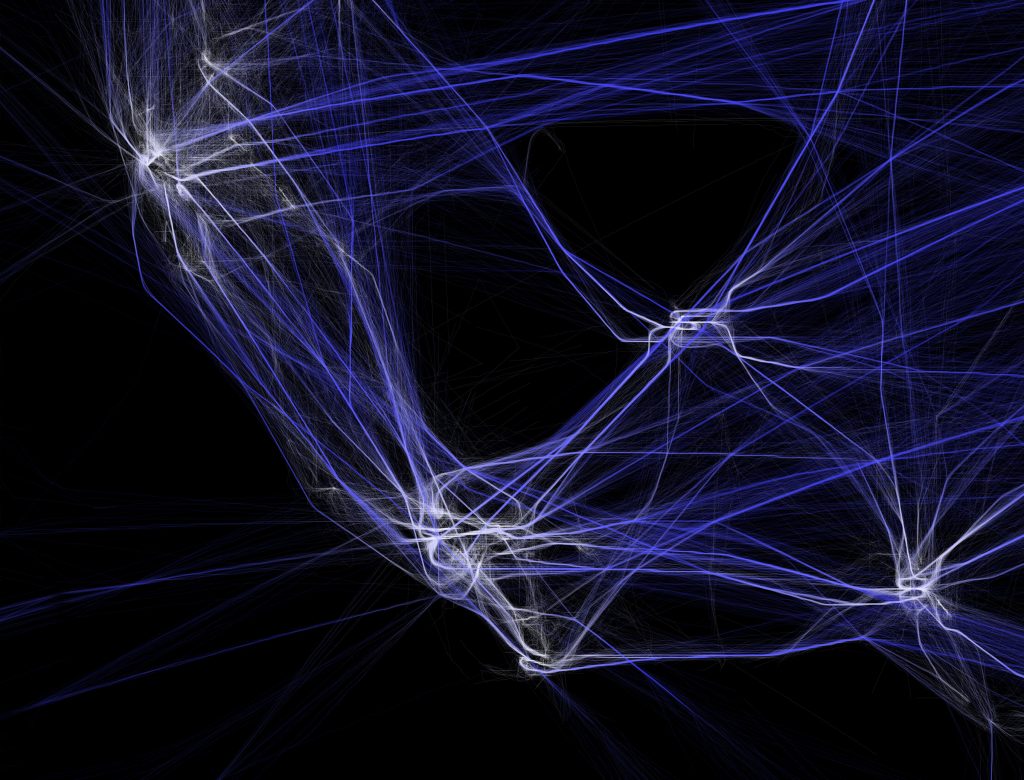
Aaron Koblin’s Flight Patterns Visualization exhibits strings of colorful lines, representing the movement and compactness of flight pathways. Koblin uses data values from Processing programming environment to map and plot certain routes of air traffic occurring over North America. For areas where there prevails high overlapping air traffic, the intersection points have an intense white color and a slight shine, whereas the other lines seem to relatively fade out into the dark background. I found his particular style of generating art really intriguing with the capability to control the vivid light as well as its quality of glowing effect, and I really love the overlapping colors of lines that produces this mesmerizing illumination. I admire how he used algorithms as well as loop or conditional functions to create such entrancing artwork and I believe his artistic sensibility emerges from his interest in science visualization.
Reference: http://www.aaronkoblin.com/project/flight-patterns/
![[OLD SEMESTER] 15-104 • Introduction to Computing for Creative Practice](wp-content/uploads/2023/09/stop-banner.png)


