Final Project

sketchDownload
//global variables
var houseDayImg;
var houseNightImg;
var dayPeriod = 2000;
var numTrees = 4;
var numStars = 20;
var trees = [];
var stars = [];

class Star {
    constructor() {
        this.x = random(width);
        this.y = random(height/4);
    }

    display() {
        fill(255,255,255);
        ellipse(this.x, this.y, 3, 3);
    }
}

class Tree {
    constructor() {
        var choice = random(1);
        if(choice < 0.5){
            this.x = random(width/3);  
        }else {
            this.x = random(2 * width / 3, width - 10); 
        }
        choice = random(1);
        if(choice < 0.5){
            this.color = color(135, 167, 126);  
        }else {
            this.color = color(73, 126, 97);
        }
        this.y = random(280, 300)
        this.w = random(50, 70);
        this.h = random(60, 90);
    }
       
    display() {
        fill(109, 86, 53);
        rect(this.x - 5, this.y + 10, 10, 50);
        fill(this.color)
        ellipse(this.x, this.y, this.w, this.h);
    }
}

function preload() {
    //preload images
    houseDayImg = loadImage("https://i.imgur.com/DguMSkN.png");
    houseNightImg = loadImage("https://i.imgur.com/eXNWSkN.png");
    panelImg = loadImage("https://i.imgur.com/VFf1Rr8.png");
    batteryImg = loadImage("https://i.imgur.com/rw8ScZs.png");
}

function setup() {
    createCanvas(400, 400);
    for(i = 0; i < numStars; i++){ //draw stars at night
        stars.push(new Star())
    }
    
    for(i = 0; i < numTrees; i++){ //draw trees
        trees.push(new Tree())
    }

}

function draw() {
    time = frameCount % dayPeriod;
    bgDark = time;
    batteryLife = (frameCount + dayPeriod / 4) % dayPeriod;
    if (bgDark > dayPeriod/2) {
        bgDark = dayPeriod - bgDark;
    }
    if (batteryLife > dayPeriod/2) {
        batteryLife = dayPeriod - batteryLife;
    }
    background(207 - bgDark / dayPeriod*255*2, 226 - bgDark / dayPeriod*255*2, 243 - bgDark / dayPeriod*255*2);

    //ground
    fill(143-bgDark*(143-66)/dayPeriod*2, 206-bgDark*(206-95)/dayPeriod*2, 0);
    noStroke();
    ellipse(200, 400, 500, 180);
    
    //panel
    image(panelImg, 125, 156, 80, 80);
    
    //battery
    image(batteryImg, 140, -15, 100, 100);
    fill(255 - batteryLife / dayPeriod * 255 * 2, batteryLife / dayPeriod * 255 * 2, 0);
    rect(167, 18, batteryLife / dayPeriod * 61 * 2, 34);
  
    //during daytime
    if (time < dayPeriod/4 || time > dayPeriod*3/4) {
       
       //house
       image(houseDayImg, 130, 200, 130, 130);

    } else { //during nighttime
       
        //house 
        drawStars();
        image(houseNightImg, 130, 200, 130, 130);
   }

    frameCount += 1;

    //function
    drawSun(time);
    drawTrees();
}


function drawSun(time) { 
   push();
   translate(200, 400);
    rotate(frameCount * 2 * PI / dayPeriod);
   fill(255, 206, 59);
   ellipse(0, -300, 70, 70);
   pop();
}

function drawStars() { //draw stars at random locations in the sky when it becomes night and disappear when it becomes daytime again
    for(i = 0; i < stars.length; i++){
        stars[i].display();
    }
}

function drawTrees(){ //draw trees at random locations every time you refresh 
    for(i = 0; i < trees.length; i++){
        trees[i].display();
    }
}

For the final project, I created an information visualization inspired by Tesla’s solar roof. I wanted to illustrate this scene by using solar roof because I thought this type of clean energy production can help lower the emissions of greenhouse gases and carbon dioxide, and further decrease our reliance to fossil fuels to create a better environment. During the day, the solar roof is charged with solar energy, illustrated by a battery icon being gradually charged up as the sun moves throughout the daytime. Then, when it becomes night, the battery icon will be fully charged, allowing the house to brightly light up even in the dark. For a little detail, after the sun goes down during the day, the stars will show up representing nighttime. Every time the user refreshes the screen, the trees will randomly appear in random locations as well as the stars. This was an amazing opportunity for me to explore using various techniques like array, object, loop, conditional, transformation, and functions, and I think I truly enjoyed creating this illustration. Hope you enjoy! 🙂

Project 11: Generative Landscape

sketchDownload
//global variables
var cloudsX = [];
var cloudsY = [];
var brickX = [];
var brickY = [];
var mushroomX = [];
var mushroomY = [];
var cloudImg;
var brickImg;
var floorImg;
var noiseParam = 0;
var noiseStep = 0.01;
var numClouds = 5;
var numBricks = 3;
var numMushrooms = 3;
var mh = []; //height of the mountains

function preload() { 
  //preload images
  cloudImg = loadImage("https://i.imgur.com/i3pLDv0.png");
  brickImg = loadImage("https://i.imgur.com/yNNs74U.png");
  floorImg = loadImage("https://i.imgur.com/LZwSMdA.png");
  mushroomImg = loadImage("https://i.imgur.com/tflvlXK.png");
}

function setup() {
  createCanvas(480, 400);

  //mountain
  for (var i = 0; i < width/2 + 1; i ++) {
    var n = noise(noiseParam);
    var v = map(n, 0, 1, height/2, height);
    mh.push(v);
    noiseParam += noiseStep;
  }

  //cloud
  for (var i = 0; i < numClouds; i ++) {
    var cx = random(width/numClouds*i, width/numClouds*(i+1));
    var cy = random(height/4);
    cloudsX.push(cx);
    cloudsY.push(cy);
  }

  //brick
  for (var i = 0; i < numBricks; i ++) {
    var bx = random(width/numBricks*i, width/numBricks*(i+1));
    var by = random(height/3, height/2);
    brickX.push(bx);
    brickY.push(by);
  }

  //mushroom
  for (var i = 0; i < numMushrooms; i ++) {
    var mx = random(width/numMushrooms*i, width/numMushrooms*(i+1));
    var my = height-90;
    mushroomX.push(mx);
    mushroomY.push(my);
  }
  frameRate(10);
}

function draw() {
  background(102, 154, 255); //blue
  drawMountain();
  drawCloud();
  drawBrick();
  drawMushroom();

//floor
  image(floorImg, 0, 340, 130, 30);
  image(floorImg, 129, 340, 130, 30);
  image(floorImg, 258, 340, 130, 30);
  image(floorImg, 387, 340, 130, 30);
  image(floorImg, 0, 370, 130, 30);
  image(floorImg, 129, 370, 130, 30);
  image(floorImg, 258, 370, 130, 30);
  image(floorImg, 387, 370, 130, 30);
}

//mountains
function drawMountain() {
  fill(52, 151, 9); //green
  beginShape();
  vertex(0, height);
  for (var i = 0; i < mh.length; i ++) {
    x = 2*i;
    y = mh[i];
    vertex(x,y);
  }
  vertex(width, height);
  endShape();
  mh.shift();
  n = noise(noiseParam);
  v = map(n, 0, 1, height/2, height);
  mh.push(v);
  noiseParam += noiseStep;
}

//cloud
function drawCloud() {
  for (var i = 0; i < numClouds; i ++) {
    image(cloudImg, cloudsX[i], cloudsY[i], 100, 33);
  }
  for (var i = 0; i < numClouds; i ++) {
    cloudsX[i] -= 3; //update cloud position
    if (cloudsX[i] < -100) { //remove cloud
      cloudsX[i] = width;
      cloudsY[i] = random(height/4);
    }
  }
}

//brick
function drawBrick() {
  for (var i = 0; i < numBricks; i ++) {
    image(brickImg, brickX[i], brickY[i], 100, 30);
  }
  for (var i = 0; i < numBricks; i ++) {
    brickX[i] -= 3; //update brick position
    if (brickX[i] < -100) { //remove cloud
      brickX[i] = width;
      brickY[i] = random(height/3, height/2);
    }
  }
}


//mushroom
function drawMushroom() {
  for (var i = 0; i < numMushrooms; i ++) {
    image(mushroomImg, mushroomX[i], mushroomY[i], 40, 30);
  }
  for (var i = 0; i < numMushrooms; i ++) {
    mushroomX[i] -= 7; //update brick position
    if (mushroomX[i] < -100) { //remove cloud
      mushroomX[i] = width;
      mushroomY[i] = height-90;
    }
  }
}

For this project, I decided to replicate one of my favorite childhood game, Super Mario Bros Game we used to play with Nintendo. For moving variables, I added clouds, bricks, mushrooms and the mountain the background, and included floor tiles using png files. It was challenging at first to make them move and disappear, but it was really fun to create this game-like scenery. If I had more time, I would like to add a jumping Mario so the character interacts with the game scene.

LO 11: Societal Impacts of Digital Art

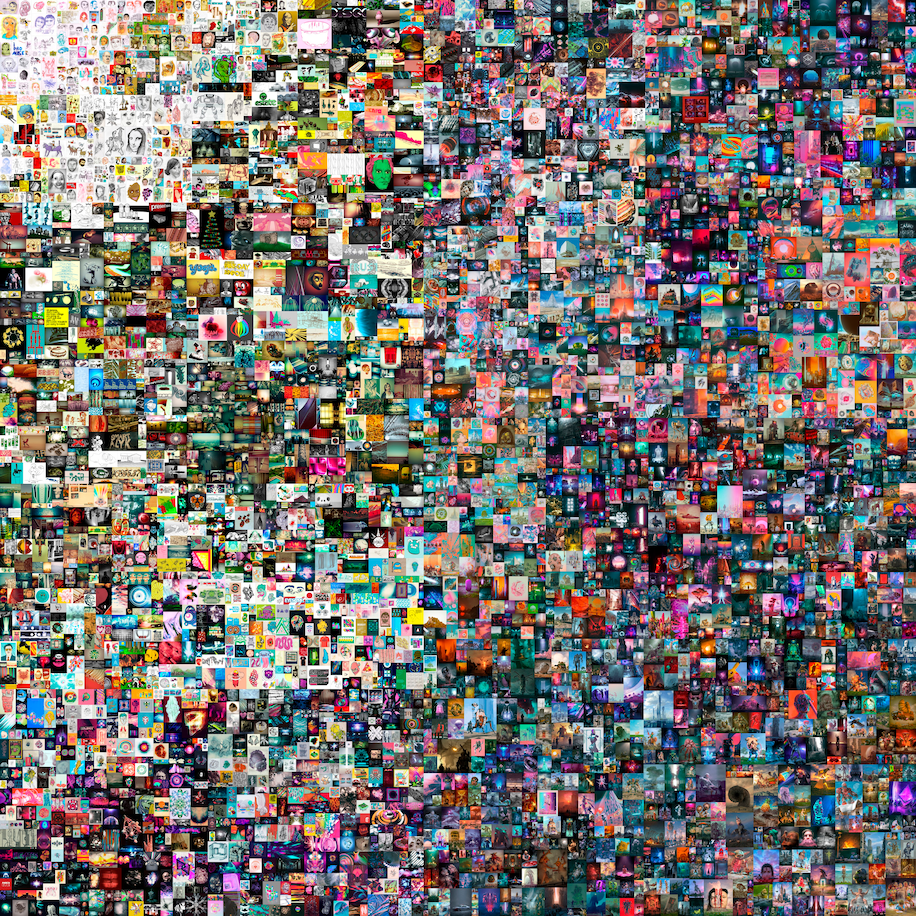
In the article, “Beeple’s digital ‘artwork’ sold for more than any painting by Titian or Raphael. But as art, it’s a great big zero.“, Sebastian Smee talks about a “major shake-up” in the art industry with latest revolt towards the NFT (Non-fungible Token), which is a unique digital item stored on a database technology called blockchains, allowing users to secure ownership of their digital works. As time goes by, art, in many forms, constantly evolves over time with several influences like advances in technology and society by instilling values and changing experiences throughout time. Especially today, technology has become a prevalent influence in our art world in the way people create and access art. For instance, many artists now use digital applications like Photoshop on computer and “paint” on their iPad canvas to generate art. Smee further criticizes how the artistic value of NFT has been replaced by generating monetary value from the market by mentioning graphic designer Beeple, who sold his digital product “Everydays: The First 5000 Days” for a crazy amount of $69.3 million. Although I am a fan of digital art collection, I totally understand Smee’s criticism towards Beeple’s work in comparison to the worth of past valuable traditional paintings sold in previous auctions. I think there should be some differentiations in terms of auction standards between traditional and digital work because they not only use different mediums, but also bring creative approaches as well as different value to art.  

Beeple’s digital artwork, “Everydays: The First 5000 Days,” which was sold for an insane amount of $69.3 million.

Reference: https://www.washingtonpost.com/entertainment/museums/beeple-digital-artwork-sale-perspective/2021/03/15/6afc1540-8369-11eb-81db-b02f0398f49a_story.html

Project 10 – Sonic Story

sketch-beansDownload
//global variables
var frameCount = 0;
var sky;
var cat;
var sofa;
var clock;
var playlist;
var table;
var rain = [];
const numOfRaindrops = 100;

function preload() { 
  //preload images
  sky = loadImage("https://i.imgur.com/6PCHwrN.png");
  cat = loadImage("https://i.imgur.com/qApZuXa.png");
  sofa = loadImage("https://i.imgur.com/sESZJWa.png");
  clock = loadImage("https://i.imgur.com/hbfe35l.png");
  playlist = loadImage("https://i.imgur.com/wKD6EsD.png");
  table = loadImage("https://i.imgur.com/74DxEGR.png");

  //preload sounds
  clockSound = loadSound("https://courses.ideate.cmu.edu/15-104/f2021/wp-content/uploads/2021/11/clock.wav");
  playlistSound = loadSound("https://courses.ideate.cmu.edu/15-104/f2021/wp-content/uploads/2021/11/playlist.wav");
  rainSound = loadSound("https://courses.ideate.cmu.edu/15-104/f2021/wp-content/uploads/2021/11/rain-1.wav");
  catSound = loadSound("https://courses.ideate.cmu.edu/15-104/f2021/wp-content/uploads/2021/11/cat.wav");
  // clockSound = loadSound("clock.wav");
  // playlistSound = loadSound("playlist.wav");
  // rainSound = loadSound("rain.wav");
  // catSound = loadSound("cat.wav");
}

function setup() {
  createCanvas(480, 400);
  useSound();
  frameRate(20);

  //rain
  rain_color = color(225, 235, 244);
  background_color = color(21, 39, 56);
  for (var i = 0; i < numOfRaindrops; i++) {
    rain[i] = new drawFallingRain();
  }
}

function soundSetup() {
  clockSound.setVolume(0.4);
  playlistSound.setVolume(0.7);
  rainSound.setVolume(0.5);
  catSound.setVolume(0.4);
}

function draw() {

  background(background_color);

  //gradient sky
  image(sky, 0, 0, width, 210);

  //rain
  for (var i = 0; i < rain.length; i ++) {
      rain[i].rainDisplay();
      rain[i].rainDrop();
  }

  //room wall
  fill(109, 115, 147);
  noStroke();
  rect(0, 0, 100, 600);
  rect(400, 0, 100, 600);
  rect(0, 210, 800, 300);
  fill(88, 87, 103);
  rect(-100, 340, 800, 300);

  //window
  fill(109, 115, 147);
  rect(100, 100, 300, 10);
  rect(250, 0, 10, 200);
  fill(71, 72, 90);
  rect(100, 200, 300, 15);
  fill(144);
  rect(100, 200, 300, 5);

  //clock
  image(clock, 385, 30, 90, 140);

  //sofa
  image(sofa, -55, 10, 420, 400);

  //cat
  image(cat, 290, 130, 80, 80);

  //table
  image(table, 340, 250, 150, 150);

  //playlist
  image(playlist, 375, 230, 80, 80)

    if (frameCount % 460 == 0 || frameCount % 460 == 1) {
        rainSound.stop();
        rainSound.play();
    }
    if (frameCount % 340 == 0 || frameCount % 340 == 1) {
        print("Starting playlist")
        playlistSound.stop();
        playlistSound.play();
    }
    if (frameCount % 200 == 0 || frameCount % 200 == 1) {
        catSound.stop();
        catSound.play();
    }
    if (frameCount % 160 == 0 || frameCount % 160 == 1) {
        clockSound.stop();
        clockSound.play();
    }
    frameCount += 1;
}

function drawFallingRain() {
    this.rx = random(0, 400); //width of the canvas
    this.ry = random(0, 400); //height of the canvas
    this.rain_size = random(0, 8);
    this.rain_rate = map(this.rain_size, 0, 10, 8, 10);
    this.rain_range = map(this.rain_size, 0, 10, 7, 18);

    this.rainDisplay = function() {
        var raindrop_size = map(this.rain_size, 0, 20, 0.7, 0.3);
        stroke(rain_color);
        strokeWeight(raindrop_size);
        line(this.rx, this.ry, this.rx, this.ry + this.rain_range);
    }
    this.rainDrop = function() {
        this.ry = this.ry + this.rain_rate;
        var dropsOfRain = map(this.rain_size, 0, 10, 2, 1); //indicates the raindrop rate
        this.rain_rate = dropsOfRain + this.rain_rate;
        if (this.ry >= 300) { //continue raining
            this.ry = random(-100, 0);
            this.rain_rate = map(this.rain_size, 0, 10, 3, 15);
        }
    }
}

For this project, I decided to illustrate a chill scenery of a room with a cat on a rainy night (or in the early morning). The four characters I used were: raining sound, clock ticking, LP playlist, and cat meowing. I found sounds on freesound.org and found some free png images on free sites like Imgur. At first I found it challenging with the instructions of how the sound works in both my server outside of WordPress and on WordPress as blog entry, but I managed to figure it out! This was super fun project to work with.

Project 9: Computational Portrait (Custom Pixel)

sketchDownload
var babyImg;
var adj;

function preload() {
  babyImg = loadImage("https://i.imgur.com/9bQND1O.jpg"); 
  adj = ["cute", "baby", "adorable", "sweet", "lovely", "endearing", "tiny", "cutesy", "kawaii"];
  print(adj); //adjectives that describe the baby
}

function setup() {
  createCanvas(480, 480);
  babyImg.resize(480, 480); //resize the scale of the image to fit the canvas
  background(0);
  imageMode(CENTER); //positioning the image as center
  babyImg.loadPixels(); //loading the adjectives of the baby image
}

function draw() {
  var px = floor(random(babyImg.width)); //randomly select pixels of the image
  var py = floor(random(babyImg.height));
  var pc = babyImg.get(px, py); //bring the color of the chosen pixel
  fill(pc, 255); 
  textSize(12);
  textFont('Georgia');
  text(adj[Math.floor((Math.random()*adj.length))], px, py);
}

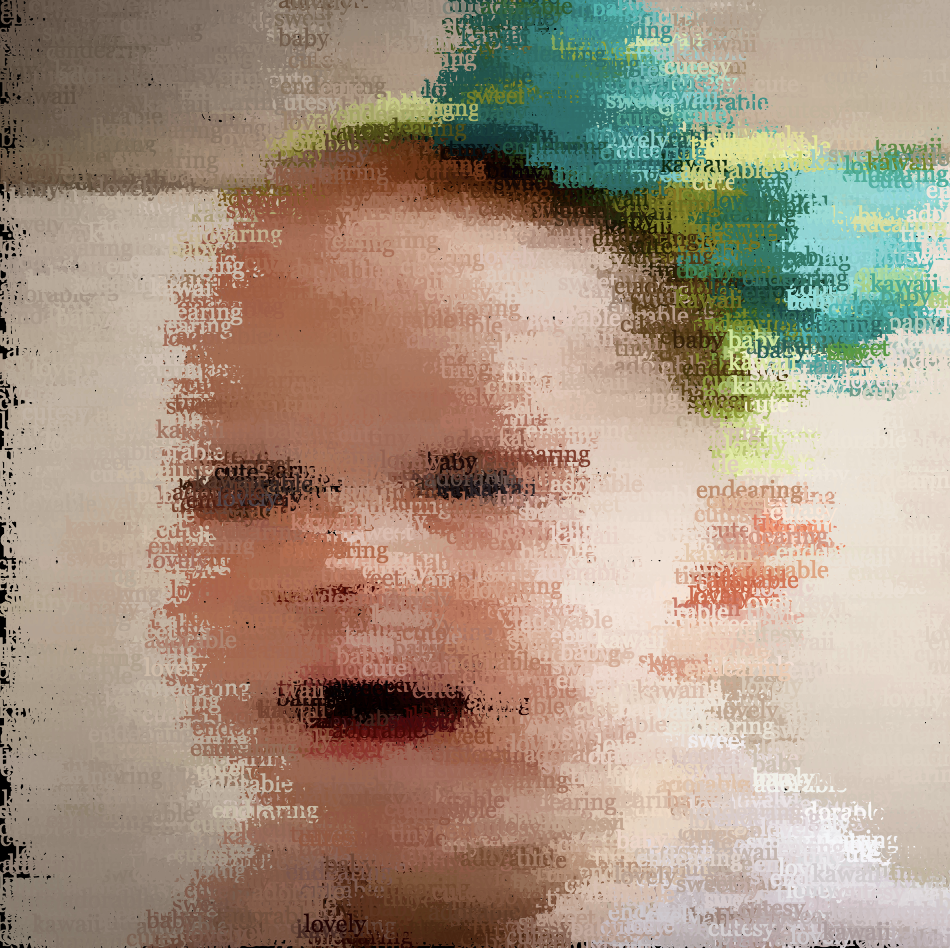
While exploring through Imgur in search of images, I found an adorable photo of a smiling baby and I was able to come up with many different adjectives (e.g. cute, adorable, sweet, lovely, etc.) when I first saw this baby. I decided to apply this thought to the project by using the words to render and display this image. It was absolutely delightful watching the rendering process of this cute baby image.

LO 09: A Focus on Women and Non-binary Practitioners in Computational Art

An interactive installation, Computer Orchestra, was first composed by Fragment.in, which is a Switzerland-based artist collective of Laura Nieder, David Colombini, and Marc Dubois. This crowdsourcing platform enables the audience to participate and lead their own orchestra by either uploading their own or downloading music samples to incorporate into the arrangement with the computers. People can simply use their hand gestures to direct and conduct the orchestra. I was really fascinated by how the Kinect motion controller detects the body movements of the conductor and transfers information to Processing through SimpleOpenNI library, where these signals are delivered to the remaining computers with the help of wifi. I think this style of generating art is really creative as it uses each assigned samples to further create an aesthetic visual feedback obtained from the generated sounds. I absolutely admire how this project enriches the experience of the user in both auditory and visual manners. Fragment.in’s artistic sensibilities significantly arises for offering the sense to the audience of being able to take control of the digital technology within one’s hands.

Reference: https://computer-orchestra.com/

LO 08: The Creative Practice of an Individual


In this video, McCarthy talks about how homes can be considered as smart humans through her various experimentations.  

Lauren McCarthy, as known as the creator of p5.js, is an artist based in Los Angeles exploring how, in today’s society, subjects of surveillance, automation, and network culture influence our social relations. McCarthy claims that human beings are encouraged to interact with algorithms everyday, further critiquing the tensions between social and technological systems, as well as intimacy and privacy. In particular, I found her style of generating art very phenomenal, especially in her work “LAUREN”, with her attempt to perform as a human version of smart home intelligence Amazon Alexa, and later remotely monitoring over the people in their residences to explore the ambiguous relationship between human and machine. In her works, McCarthy employs many of today’s networked electronic smart devices, such as televisions, computers, faucets, and cameras, in which conveys strange, uncanny feelings by intentionally showing the perspective of a camera with artificial intelligence, when a person is being “watched” 24/7 even at home. Home is where everyone should feel the most comfort, safe, and secure; yet, McCarthy contradicts this claim by presenting us with discomfort and unease. I absolutely admire how she looks at our everyday commonplaceness into such intriguing mismatch relationship we experience using today’s technology.

Reference: https://lauren-mccarthy.com/ & https://lauren-mccarthy.com/LAUREN

LO 07: Information Visualization

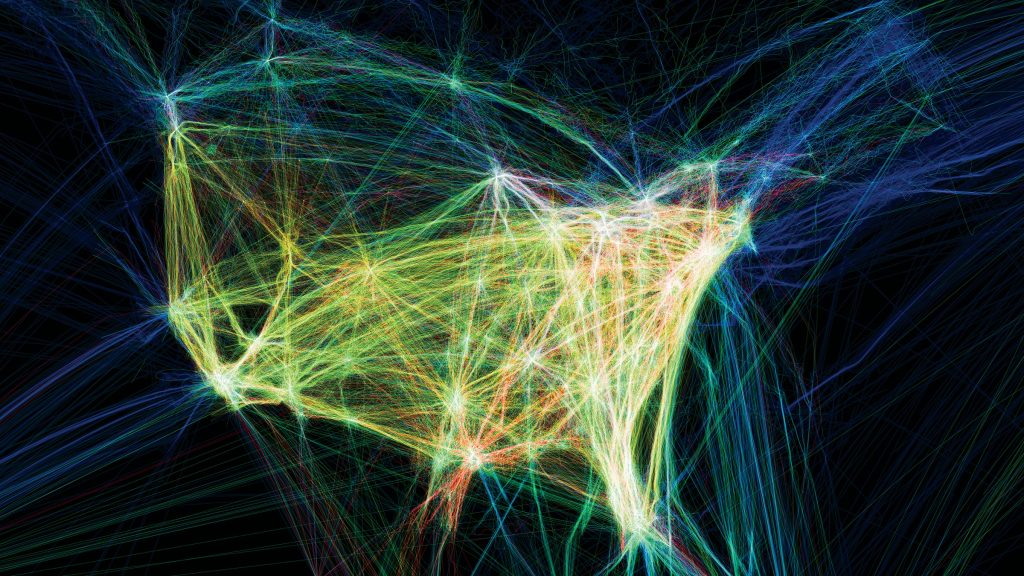
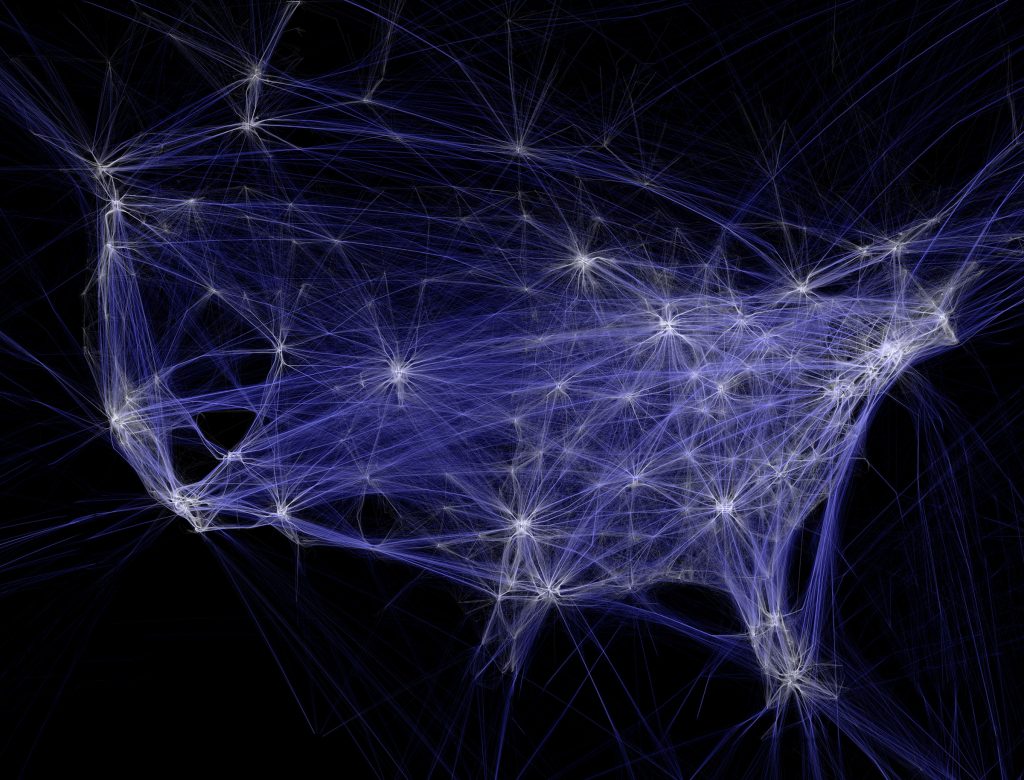
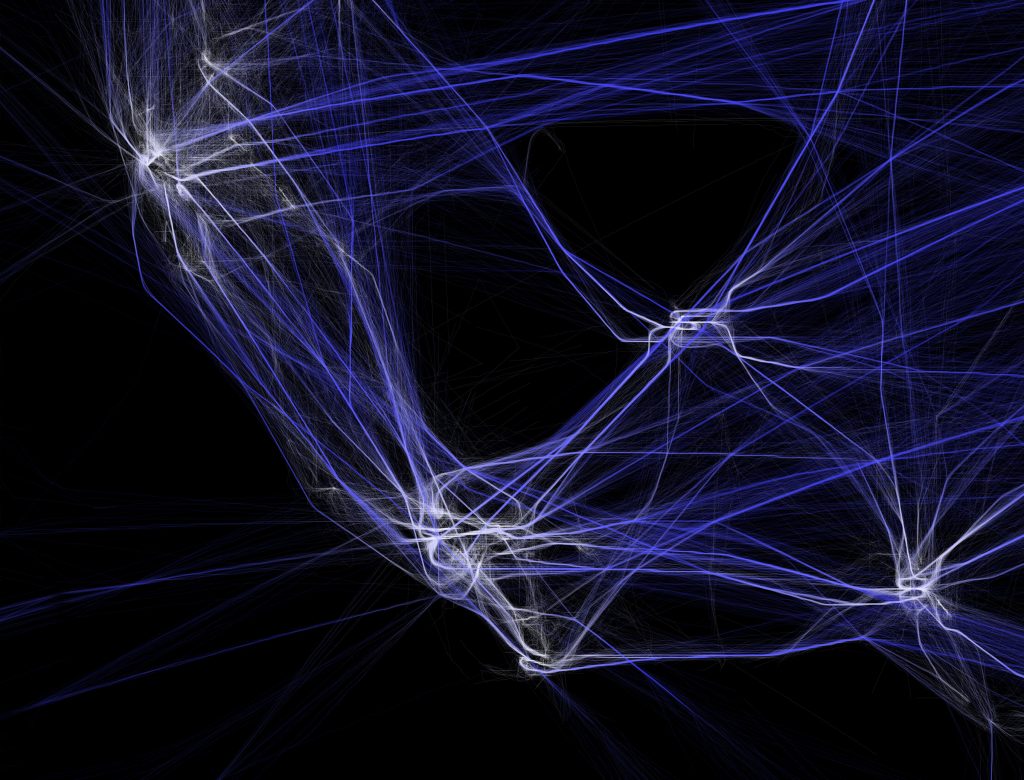
Flight Patterns by Aaron Koblin

Aaron Koblin’s Flight Patterns Visualization exhibits strings of colorful lines, representing the movement and compactness of flight pathways. Koblin uses data values from Processing programming environment to map and plot certain routes of air traffic occurring over North America. For areas where there prevails high overlapping air traffic, the intersection points have an intense white color and a slight shine, whereas the other lines seem to relatively fade out into the dark background. I found his particular style of generating art really intriguing with the capability to control the vivid light as well as its quality of glowing effect, and I really love the overlapping colors of lines that produces this mesmerizing illumination. I admire how he used algorithms as well as loop or conditional functions to create such entrancing artwork and I believe his artistic sensibility emerges from his interest in science visualization.

Reference: http://www.aaronkoblin.com/project/flight-patterns/

Project 07: Composition with Curves

sketchDownload


var bgR;
var bgG;
var bgB;
var x;
var y;

function setup() {
    createCanvas(480, 480);
    frameRate(10);
}

function draw() {
    bgR = map(-mouseY, 0, height, 50, 100); //select random background colors
    bgG = map(-mouseX, 0, width, 50, 200);
    bgB = map(-mouseY, 0, height, 0, 100);
    background(bgR, bgG, bgB);
    translate(220, 220);
    for (var c = 1; c < 5; c ++){ //draw the curve
        for (var d = 1; d < 5; d ++){
            push();
            translate(c * 10, d * 10);
            drawEpicycloidPedalCurve(); //reference to link -- https://mathworld.wolfram.com/EpicycloidPedalCurve.html
            pop();
        }
    }
}

function drawEpicycloidPedalCurve() {
    var a = map(mouseX, 0, width, 15, 100); //parameter of the curve moves with the mouse
    var b = map(mouseY, 0, height, 15, 50);
    noFill();
    stroke(mouseX, mouseY, 180);
    strokeWeight(0.8);

    push();
    beginShape(); //draw the curve
    for (var i = 0; i <= 600; i ++) {
        var theta = map(i, 0, 100, 0, PI); 
        x = (a+b)*cos(theta) - b*cos(((a+b)*theta)/b); //epicycloids are given by the parametric equations
        y = (a+b)*sin(theta) - b*sin(((a+b)*theta)/b);
        vertex(x, y);
    }
    endShape();
    pop();
}
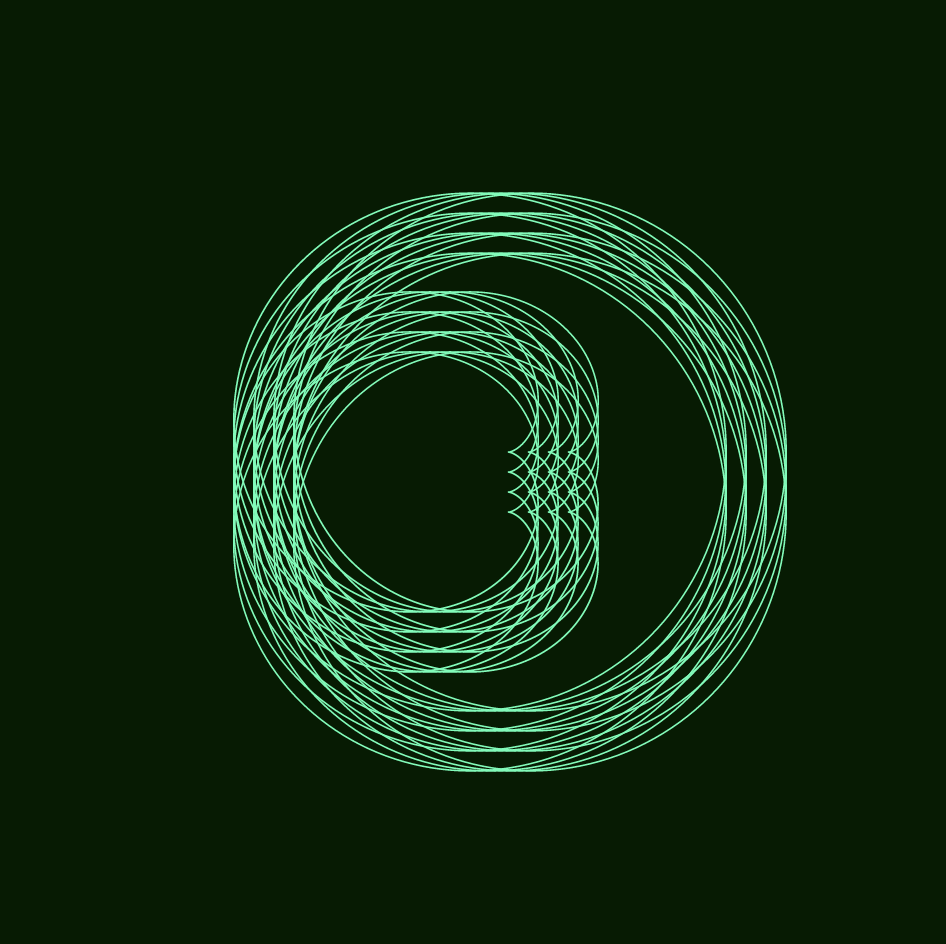
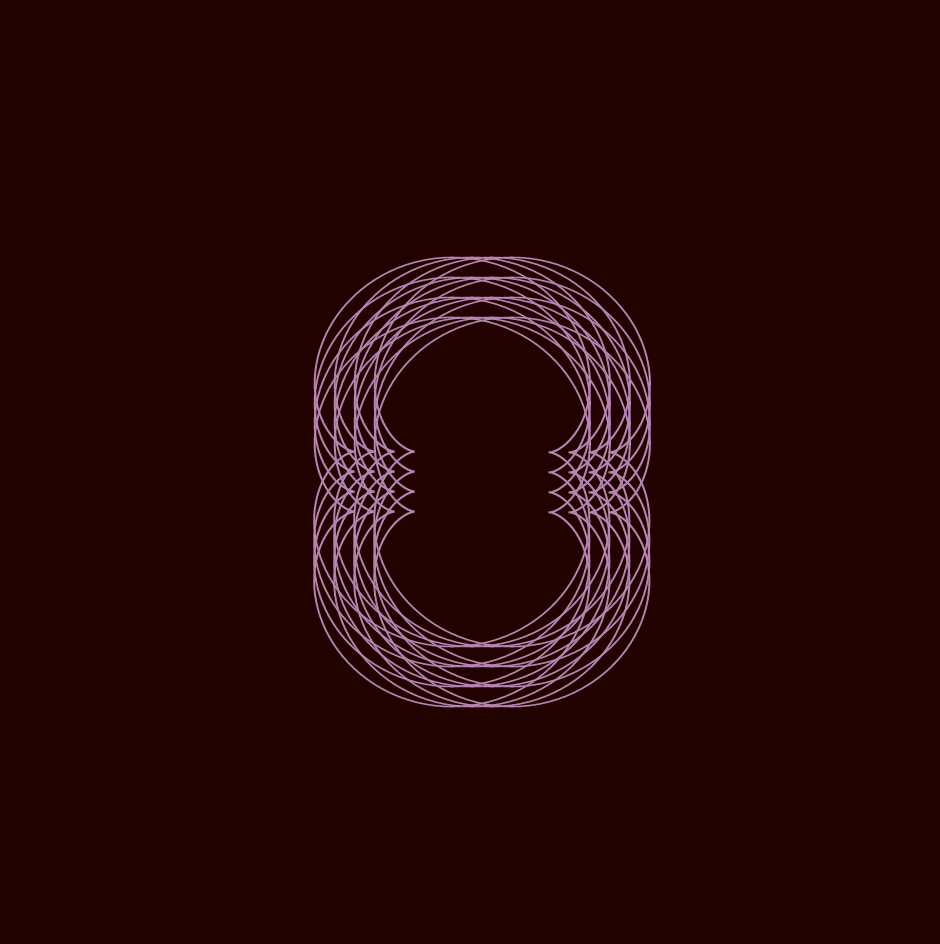
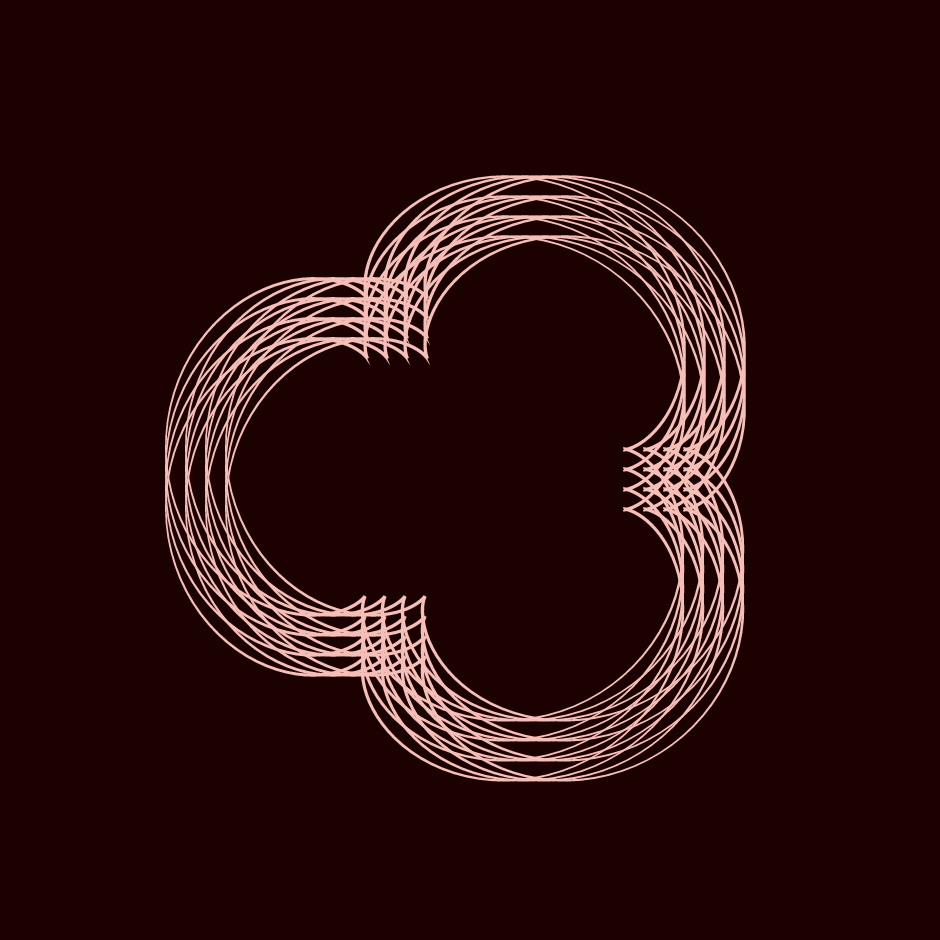
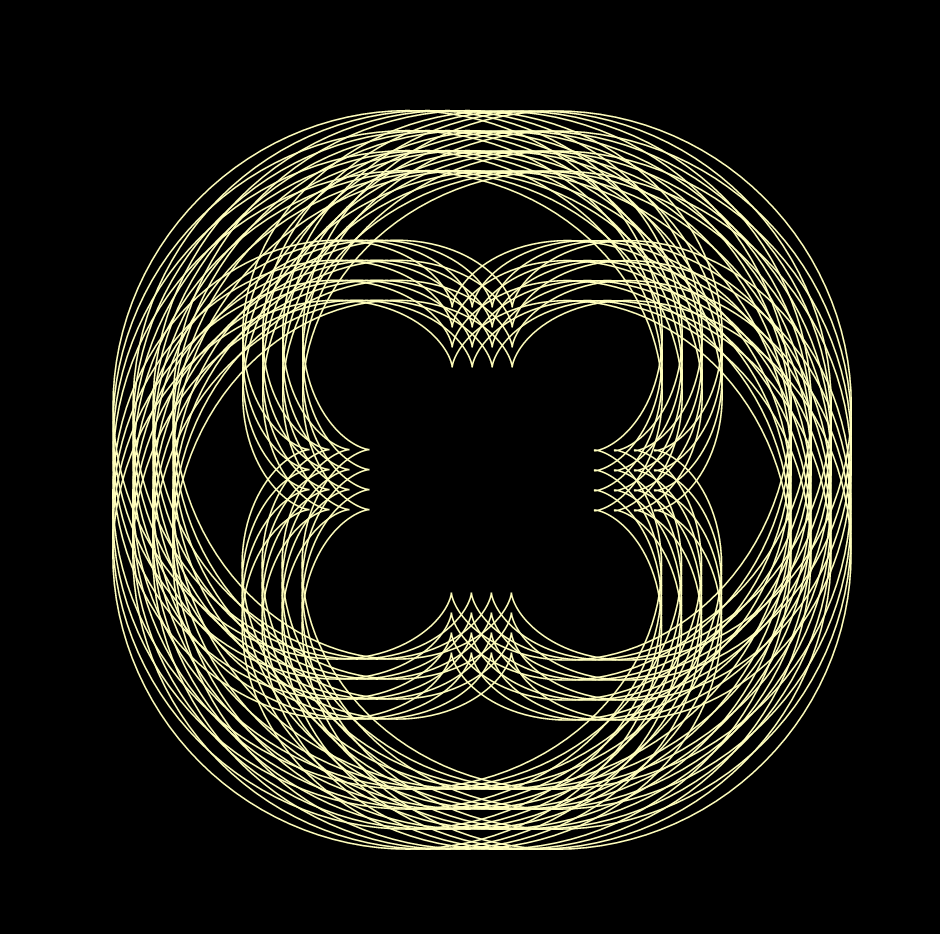
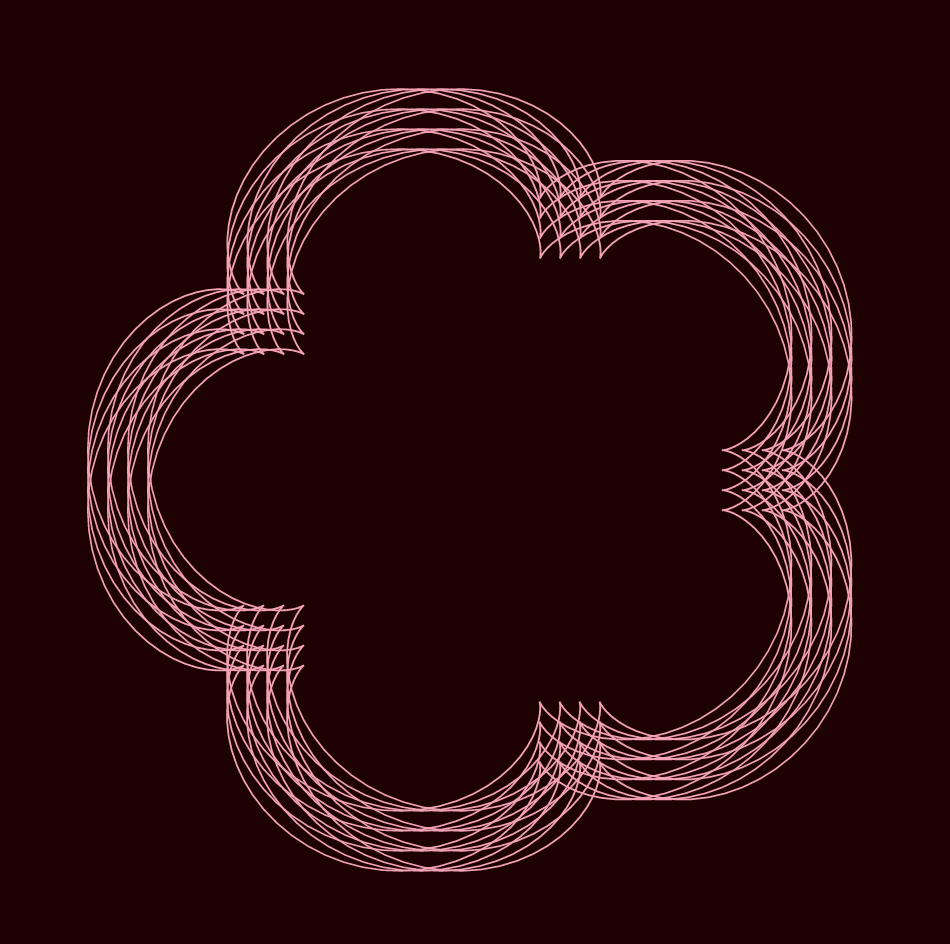
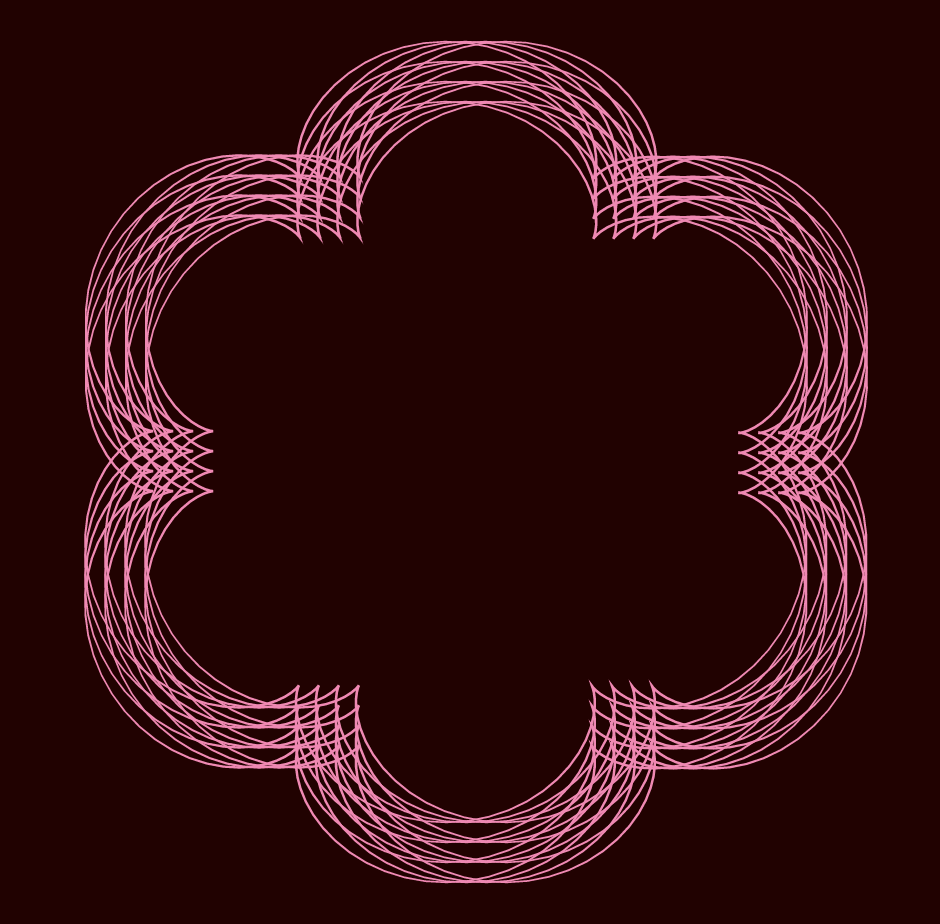
The pedal curve of an epicycloid with pedal point at its origin

For this project, I wanted to iterate a flower-like shape using parameter equations so I decided to draw Epicycloid Pedal Curve as the composition. I played with mouseX and mouseY as well as random RGB colors across the canvas so the user has the freedom to explore with unique variations of epicycloid pedal curve patterns.

Project-06: Abstract Clock

sketchDownload
var x = [];
var y = [];

function setup() {
    createCanvas(450, 380);
    var hr = hour();
    var min = minute();
    var sec = second();
    //set range for displaying sec location
    for (i = 0; i <= 60; i ++) { 
    	x[i] = random(315, 345);
    	y[i] = random(255, 285);
    }
}

function draw() {
    background(7, 55, 99);
    var hr = hour();
    var min = minute();
    var sec = second();
    var mapHr = map(hr, 0, 20, 0, width);
    var mapMin = map(min, 0, 50, 0, width);
    var mapSec = map(sec, 0, 50, 0, width);

    //flowerpot
    fill(76, 32, 1);
    strokeWeight(8);
    stroke(102, 42, 0);
    ellipse(110, 110, 110, 110);

    //succulent leaf [represents hour]
    if (hr > 12) {
    	hr = hr % 12;
    }
    noStroke();
    fill(114, 196, 143);
	for (var i = 0; i < hr; i ++) {
		push();
		translate(110, 110);
		rotate(radians(i * 30));
		ellipse(0, -30, 20, 50);
		pop();
	}

	//flower
	fill(244, 204, 204);
	ellipse(110, 97, 19, 19);
	ellipse(95, 108, 19, 19);
	ellipse(125, 108, 19, 19);
	ellipse(101, 125, 19, 19);
	ellipse(119, 125, 19, 19);
	ellipse(110, 111, 21, 21);
	fill(255, 229, 153);
	ellipse(110, 112, 13, 13);

	//coffee plate
    fill(220, 200, 186);
    stroke(255, 248, 244);
    strokeWeight(2);
    ellipse(330, 270, 100, 100);

    //coffee handle [represents minute]
    noStroke();
    push();
    translate(330, 270);
    rotate(radians(min * 6));
    fill(255, 248, 244);
    rect(-6, -60, 12, 60, 4);
    pop();

    //coffee cup
    strokeWeight(3);
    fill(220, 200, 186);
    stroke(255, 248, 244);
    ellipse(330, 270, 70, 70);

    //coffee 
    fill(78, 34, 0);
    stroke(120, 52, 0);
    strokeWeight(2);
    ellipse(330, 270, 53, 53);

    //coffee bubble [represents second]
    for (i = 0; i < sec; i ++) {
        fill(120, 52, 0);
        ellipse(x[i], y[i], 2, 2);
    }
    //keyboard
    noStroke();
    fill(188, 188, 188);
    rect(280, 30, 300, 140, 7);
    fill(238, 238, 238);
    rect(280, 30, 300, 10, 1);

    //keyboard keys
    fill(255, 255, 255);
    stroke(145,145,145);
    strokeWeight(1);
    rect(288, 48, 19, 11, 2); //first row keys
    rect(310, 48, 19, 11, 2);
    rect(332, 48, 19, 11, 2);
    rect(354, 48, 19, 11, 2);
    rect(376, 48, 19, 11, 2);
    rect(398, 48, 19, 11, 2);
    rect(420, 48, 19, 11, 2);
    rect(442, 48, 19, 11, 2);

    rect(288, 63, 19, 17, 2); //second row keys
    rect(310, 63, 19, 17, 2);
    rect(332, 63, 19, 17, 2);
    rect(354, 63, 19, 17, 2);
    rect(376, 63, 19, 17, 2);
    rect(398, 63, 19, 17, 2);
    rect(420, 63, 19, 17, 2);
    rect(442, 63, 19, 17, 2);

    rect(288, 84, 30, 17, 2); //third row keys
    rect(321, 84, 19, 17, 2); 
    rect(343, 84, 19, 17, 2); 
    rect(365, 84, 19, 17, 2); 
    rect(387, 84, 19, 17, 2); 
    rect(409, 84, 19, 17, 2); 
    rect(431, 84, 19, 17, 2);     

    rect(288, 105, 37, 17, 2); //fourth row keys
    rect(328, 105, 19, 17, 2); 
    rect(350, 105, 19, 17, 2); 
    rect(372, 105, 19, 17, 2); 
    rect(394, 105, 19, 17, 2); 
    rect(416, 105, 19, 17, 2); 
    rect(438, 105, 19, 17, 2); 

    rect(288, 126, 49, 17, 2); //fifth row keys
    rect(340, 126, 19, 17, 2); 
    rect(362, 126, 19, 17, 2); 
    rect(384, 126, 19, 17, 2); 
    rect(406, 126, 19, 17, 2); 
    rect(428, 126, 19, 17, 2); 
    rect(450, 126, 19, 17, 2); 

    rect(288, 147, 19, 17, 2); //sixth row keys
    rect(310, 147, 19, 17, 2); 
    rect(332, 147, 19, 17, 2); 
    rect(354, 147, 19, 17, 2); 
    rect(376, 147, 100, 17, 2); 


    //iPad
    fill(45, 45, 45);
    stroke(255, 255, 255);
    strokeWeight(10);
    translate(90, 230);
    rotate(PI / 5.0);
    rect(0, 0, 130, 200, 3);
    fill(0);
    noStroke();
    ellipse(65, 0, 3, 3);

}


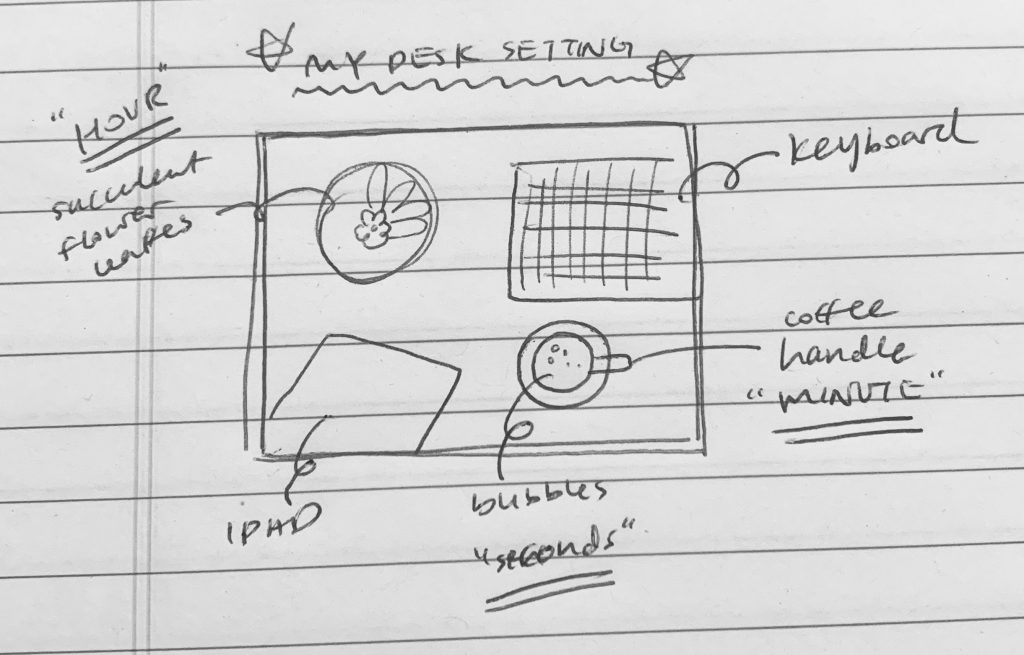
Sketch of how I wanted to illustrate my desk setting

For this project, I wanted to create a 12-hour clock illustration using a top-view desk setting. To represent the numerical value of ‘hour’, I used the leaves of the flower. To represent the ‘minute’, I used the handle of the coffee cup to direct actual minute. Last but not least, I used the bubbles of coffee to represent ‘second’. In addition, I added details of my desk of an iPad along with my MacBook keyboard. It was super fun to depict my desk surrounding into this project.