![[OLD – FALL 2016] 15-104 • COMPUTING for CREATIVE PRACTICE](https://courses.ideate.cmu.edu/15-104/f2016/wp-content/uploads/2020/08/stop-banner.png)
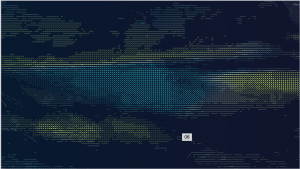
(still of interactive piece Project Ukko)
This is interactive data visualization, entitled Project Ukko, was created by Moritz Stefaner as a representation of the wind patterns across the world. What I find rather amazing about this piece is predictive power. In addition to being a easy to follow visualization of the wind patterns it can also predict future wind patterns based on the data set. I also appreciate how intuitive and simple the design is. The thickness of the lines represents strength while color and tilt represent increase/decrease in speed. It is very user friendly, which when looking at other visualizations wasn’t always the case. This visualization has practical applications for energy farmers and others in the energy sector, and I think when it comes to these types of data visualizations, practicality translates well into ease of use. For less practical data sets I think artists can make the visualizations a little more abstract.
1 thought on “Alison Hoffman – Looking Outwards 7”