Project 7 – Simin Li

siminl-project7

// Simin Li
// Section C
// siminl@andrew.cmu.edu
// Project 7

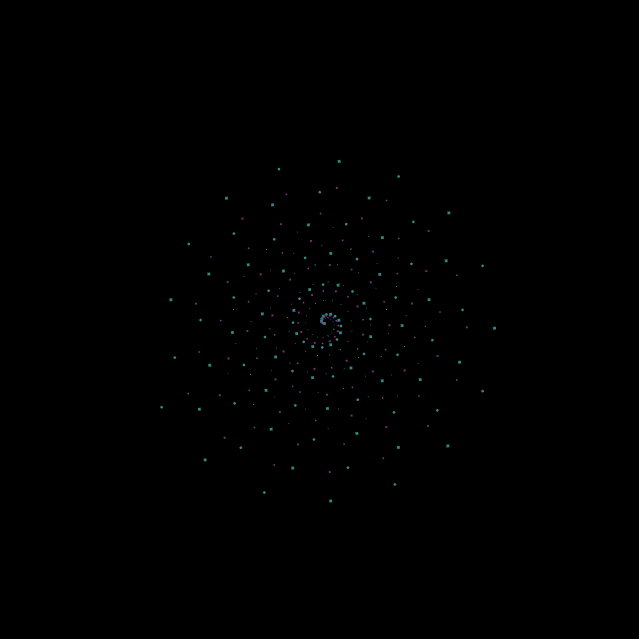
//Archimedean Spiral
//r = a * pow( theta, 1 / n)
var nPoints = 100; //number of points in each individual spiral
var radius; // radius of the polar function
function setup() {
    createCanvas(640, 640);
    frameRate(8);
}

function draw() {    
	background(0);
	var X = constrain(mouseX,0,width);
	var Y = constrain(mouseY,0,height);
	//it wont work if cursor is off canvas
    var gap1 = map(X , 0, width, 0, 6);
    var gap2 = map(X, 0 , width, 4,0);
    var ellipseD = map(Y, 0 , height, 0, 4);  
    var R = map(Y, 0 , height, random(0,255), random(0,255));
    var G = map(X, 0 , width, random(0,255), random(0,255));
    var B = map(X + Y, 0 , width + height, random(0,255), random(0,255));
    //RGB values are randomly selected and then influenced by X and Y to make 3 colors
    var angle = map(X,0,width,0,3 * TWO_PI);
    color1 = color(R,G,B);
    color2 = color(G,R,B);
    color3 = color(R,B,G);
    //three colors are used to fill the three spirals in the center
    
    
    spiral(width / 2 ,height / 2,gap1 + 2,ellipseD + 2,color3,angle,1);//largest spiral
    spiral(width / 2 ,height / 2,gap1 + 1.2,ellipseD + 1,color2,angle,1);//larger spiral
    spiral(width / 2 ,height / 2,gap1,ellipseD ,color1,angle,1); //small spiral
    //center spiral group

    spiral(width / 4 ,height * 3 / 4,gap2 + 2,2,255,angle,1);
    spiral(width / 4 ,height * 3 / 4,gap2 + 1,2,255,angle,1);
    spiral(width / 4 ,height * 3 / 4,gap2,2,255,angle,1); 
    //bottom left spiral group

    spiral(width * 3 / 4 ,height * 3 / 4,gap2 + 2,2,255,angle,1);
    spiral(width * 3 / 4 ,height * 3 / 4,gap2 + 1,2,255,angle,1);
    spiral(width * 3 / 4 ,height * 3 / 4,gap2,2,255,angle,1);
    //bottom right spiral group

    spiral(width * 3 / 4 ,height / 4,gap2 + 2,2,255,angle,1);
    spiral(width * 3 / 4  ,height / 4,gap2 + 1,2,255,angle,1);
    spiral(width * 3 / 4  ,height / 4,gap2,2,255,angle,1);
    //top right spiral group

    spiral(width / 4 ,height / 4,gap2 + 2,2,255,angle,1);
    spiral(width / 4 ,height / 4,gap2 + 1,2,255,angle,1);
    spiral(width / 4 ,height / 4,gap2,2,255,angle,1);
    // top left spiral group
 }
 function spiral(spiralX,spiralY,gap,ellipseD,shade,angle,tightness){
 //draw spiral at spiralX,spiralY
 //the gap between each loop is gap
 //the diameter of the small circles or squares that make up the spiral is ellipseD
 //fill with shade
 //rotate by angle
 //tightness controls how wound up the spiral is
 //when tightness = 1 it is the famous Archimedes' spiral
push()
    translate(spiralX, spiralY);
    //coordinates of center of spiral
    rotate(angle);
    for (var i = 0; i < nPoints; i++) {
        var theta = map(i, 0, nPoints,0,  6 * TWO_PI);
        //map theta so there will be nPoints of squares or circles drawn
        radius = gap * pow( theta, 1 / tightness);
        var px = radius * cos(theta);
        var py = radius * sin(theta);
        //coordinates of squares or circles
        noStroke();
        
        fill(shade);
        if(i % 2 == 0){
        rectMode(CENTER);
        rect(px - 5, py - 5, ellipseD, ellipseD);}
        else{
        ellipse(px - 5, py - 5, ellipseD, ellipseD);
        }
        //alternate squares and circles
    }
pop();
}

file_000

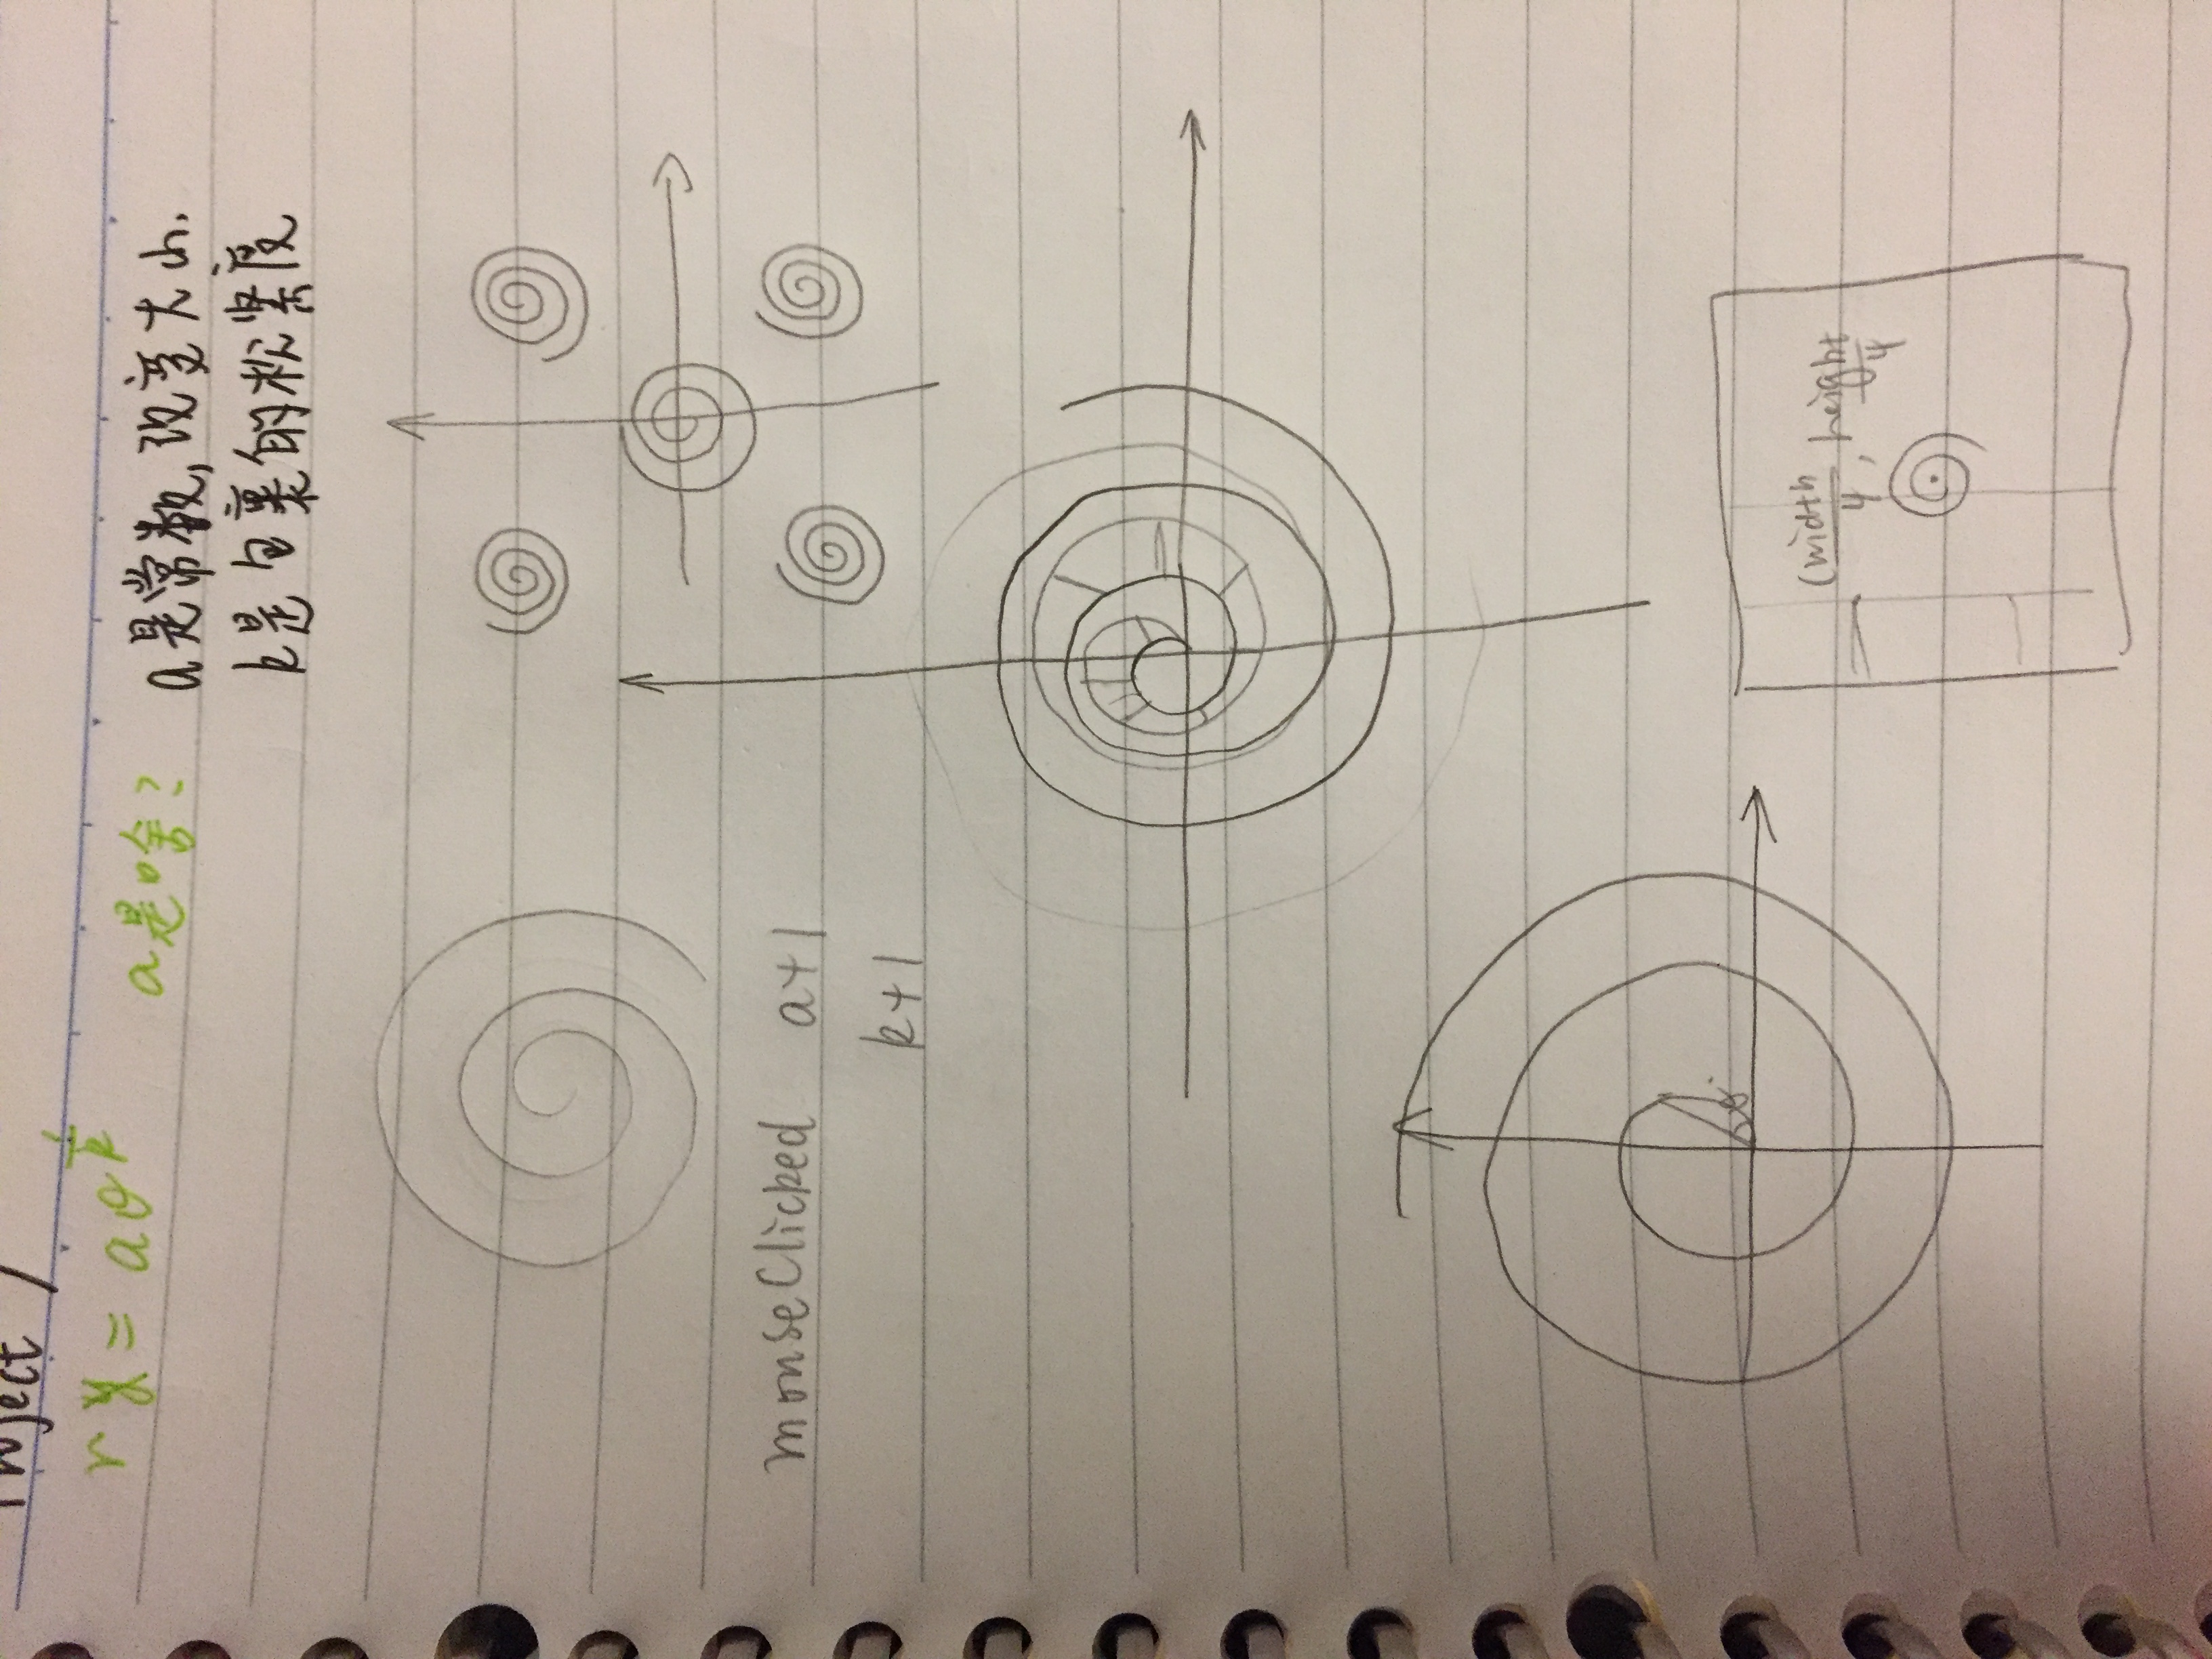
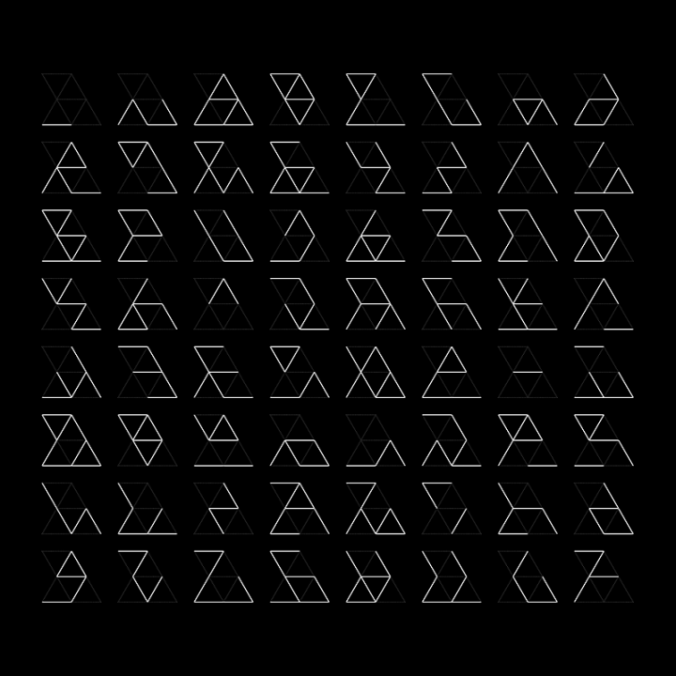
I searched through the functions provided on math world and selected this   spiral because it had a simplicity to it, yet it could have so many different forms. I created this starry night image because spirals remind me of stars. A problem that I had to deal with was that if you put too many circles in a single spiral each ring would align and look less interesting.

screen-shot-2016-10-12-at-8-24-23-pm
Stage 1: a single spiral group that cannot rotate when mouse is moved

Simin – Looking Outwards 7

A Facebook Flower by Stamen Designs

A Facebook Flower by Stamen Designs

Facebook Flowers is a project by Rachel Binx and Stamen Design that visualizes how posts are shared on Facebook. Her animations show in less than a minute how single posts are distributed and redistributed in the Facebook community in the course of 3 months. Binx uses WebGL to turn data like gender, time since first shared and times posts have been shared into beautiful flower like images. After trying several ways to visualize this data Binx decided that having curves branch out of each individual could best exhibit the connections made through online interaction. The more shares a post gets the more branches it generates. Posts reposted at an earlier stage fade to white gives you the sense of time and the way different genders have different colors adds to the animation’s complexity and Dynamicity.

Experimenting with colors in Facebook Flowers by Stamen Designs

What’s interesting is that this project can tell stories in an abstract manner. In the flower of Marvin the Martian you can see at 10 seconds and 20 seconds there is a sudden burst at the original point. This tells you that there was someone very influential who reposted the image and caused a ripple of effects. In addition, the end of the video, which is 3 months in real time, everything goes white. The epidemic like post is no longer reposted and loses its popularity. It gives me a sense of how all it takes is an influential person to launch something to stardom and an equally short amount of time for this once omnipresent epidemic to lose its popularity.

Links

Rachel Binx on Facebook Flowers

Stamen Turns Facebook Sharing Into Intricate Digital Art

Data Visualization: Photo-Sharing Explosions

Marvin the Martian Facebook Flower by Stamen on Vimeo

Famous Failures Facebook Flower by Stamen on Vimeo


Project 6 Simin Li

siminl-project6

// Simin Li
// Section C
// siminl@andrew.cmu.edu
// Project 6
var radiusMax = 130;
var rHour; // radius of hour circle
var rMin; // radius of minute circle
var rSec; // radius of second circle
var h; //hour
var Min; 
var sec;
var time; //the string of the current time
var row = [];//row of each seed
var collum = [];//collum of each seed
function setup() {
    createCanvas(640, 640);
    background(184,66,75);
}

function draw() {    

   if(sec > 58){
    background(184,66,75);
   }
   //when second reaches 59, refresh the page
var strapWidth = radiusMax * 1.25;//the width of wristwatch strap
    fill(255);
    rectMode(CENTER);
    noStroke();
    rect(width / 2,height / 2,strapWidth,height);//draw strap
    
var fromHour = color(255);//white
var toHour = color(126,165,103 );//green
var fromMin = color(202,108,98 );//light pink
var toMin = color(177,42,45);//dark red
var fromSec = color(255);//white
var toSec = color(219,183,178);//really light pink
var circleX = width / 2;
var circleY = height / 2; //center of clock face

    fill(220,190,140);
    ellipse(circleX,circleY,radiusMax,radiusMax);
    //draw full clock face
    
    h = hour();
    Min = minute();
    sec = second();

var shadeHour = lerpColor(fromHour,toHour,(h) / 24); 
var shadeMin = lerpColor(fromMin,toMin,(Min)/ 60);
var shadeSec = lerpColor(fromSec,toSec,sec / 24);
//fill shade of the circle according to the time
    rHour = sqrt(radiusMax * radiusMax  * (h + 1) / 24 );
    //radius of hour circle
    rMin = sqrt((rHour * rHour / 60) * (Min + 1));
    //radius of minute circle
    rSec = sqrt((rMin * rMin / 60) * (sec + 1));
    //radius of second circle
    noStroke();
    ellipseMode(RADIUS);
    fill (shadeHour);
    ellipse(circleX,circleY,rHour,rHour);
    //draw hour circle(second largest circle)
    fill (shadeMin);
    ellipse(circleX,circleY,rMin,rMin);
    //draw minute circle(second smallest circle)
    fill (shadeSec);
    ellipse(circleX,circleY,rSec,rSec);
    //draw second circle(smallest circle)

    time = nf(hour(), 0, 0) + " : " + nf(minute(), 0, 0) + " : " + nf(second(), 0, 0); 
    //nf converts to string
    textAlign(CENTER);
    fill(0);
    text(time, circleX, 634);//display numerical time
    

    seedsAt(sec);
    //draw seed
  }
  function seed(a,b){
    var k = 10; //size of seed
    fill(0);
    beginShape();
    curveVertex(a,  b);
    curveVertex(a + (1 / 2) * k,  b + k * 2.5);
    curveVertex(a + (2 / 3) * k,  b + k * 3.5);
    curveVertex(a,  b + 4 * k);
    curveVertex(a - (2 / 3) * k,  b + k * 3.5);
    curveVertex(a - (1 / 2) * k,  b + k * 2.5);
    curveVertex(a,  b);
    endShape(CLOSE);
    //draws a black watermellon seed at (a,b) by filling curve
    //altered from blood drop in Project 2
}
 function seedsAt(sec){

    //draws seeds at the time "sec" 
    for(i = 0; i < sec ; i ++){
                if((i + 1) % 6 == 0){
    //if 6 is a factor of the number of the second. 
    //eg when sec = 0, it is the 1st second 
        row[i] = (i + 1 ) / 6; 
        //the row of this second 
        collum[i] = 6;
        //the last collum
    }
    else{
    row[i] = (i + 1 - ((i + 1) % 6)) / 6 + 1; 
    collum[i] = (i + 1) % 6;
     
}
    if (collum[i] > 3){ 
    seed(2 * radiusMax + collum[i] * ((width - 2 * radiusMax)/ 7),row[i] * height / 11 - 30);
    //x position needs to avoid overlaping the watch
}
    else{
    seed( collum[i] * ((width - 2 * radiusMax)/ 7),row[i] * height / 11 - 30);

    }
}
 }

In this project I was inspired by a watermelon and wanted to the size of the clock face. I wanted to make the clock abstract and have something tangible as well. This is why after I finished making a clock that tells time according to the area and color of each circle, I added watermelon seeds that could count the current second in the background.

file_000 file_001

Looking Outwards 6 – Simin Li

Prime Hex by Marius Watz Photographed by James Bedell

Prime Hex B was a project by Marius Watz in 2013 that used computation to create “random” permutations of light behavior. The piece is composed of 64 clusters of light tubes that each contain 11 individual light tubes that turn on and off according to different time intervals. It is likely that he used closed system self-generative software because he stated the benefits of using it in generative art. The numbers of seconds in each interval are all carefully computed prime numbers to get the longest nonrepeating cycle. It also helps avoid “the inevitable bias of pre-programmed content”. This is not the first project Marius Watz has done using this kind of controlled randomness. His other projects that are also named “Prime” including one installation in the Wergeland tunnel use the same mechanism.

MARIUS WATZ :: PRIME HEX B

It is almost guaranteed that each time you see the piece it will be different. This is interesting because the artist cannot possibly go through all of the permutations but he can count on computation and his software to make the piece creative and diverse. In a way, his artwork is no longer his own. This reminds me of working with watercolor: after your brush leaves the paper what happens to the pigment is all up to chance. I come back to the painting when it is dry and realize that it has turn into something completely different. Watz is painting with software and leaving the rest to chance.

Close up of Prime Hex B by Marius Watz

Links:

Marius Watz :: Prime Hex B

Overcoming Manual Inadequacy: An Interview With Marius Watz

Projects by Marius Watz


Project 5 Simin Li

siminl-project5

// Simin Li
// Section C
// siminl@andrew.cmu.edu
// Project 5
var d = 40;

function setup() {
    createCanvas(640, 640);
    background("LightSalmon");
}

function draw() {
	colorMode(RGB);
	colorA1 = color(0,1,16);
    colorA2 = color(84,137,207);
    colorB1 = color(62,141,99);
    colorB2 = color(229,188,47);
    colorC1 = color(226,51,50);
    colorC2 = color(254,251,248);
	var gapY = d * sqrt(3) / 2;
    //differnce of x values between two adjacent 
    var gapX = d *  3 / 2;
    //differnce of y values between two adjacent hexagon left corners
    for (var j = -10; j < 15; j++) {
    //to achieve diagonal rows and collums we need two x variables and y variables
	    var X = 18 + gapX * j;
        var Y = gapY * j;
            for (var i = -10; i < 15; i++) {
                cubeX = X + gapX * i;
                //x coordinates of hexagon
                cubeY = Y - gapY * i;
                //y coordinates of hexagon
                lerpA = lerpColor(colorA1,colorA2,dist(cubeX,cubeY,width,height)/ dist(0, 0,width,height));
                lerpB = lerpColor(colorB1,colorB2,dist(cubeX,cubeY,width,height)/ dist(0, 0,width,height));
                lerpC = lerpColor(colorC1,colorC2,dist(cubeX,cubeY,width,height)/ dist(0, 0,width,height));
                cube(cubeX, cubeY,lerpA,lerpB,lerpC);
            }
                //draw cube
            }            
    
    noLoop();
}

function rhombus(x,y,angle){
//create function that draws rhombus at x,y
//rotate by angle
    var h = d * sqrt(3)/2;
    //height of rhombus
    push();
        translate(x, y);
        rotate(radians(angle));
        shearX(radians(30));
        //shifts a rectangle into a parallelogram by 30 degrees
        rect(0, 0, d, h);
    pop();
}
function cube(x,y,lerpA,lerpB,lerpC){
//create function that combines three rhombuses into a cube
	stroke(255);
	strokeWeight(1);
	fill(lerpA);
    rhombus(x,y,0);//draws darkest rhombus
    
    fill(lerpB);
    rhombus(x,y,300);//draws lightest rhombus
    push();
        translate(1.50 * d, d * sqrt(3)/2);
        fill(lerpC);
        rhombus(x,y,240);//draws second darkest rhombus
    pop();
}

Black & White
Black & White
screen-shot-2016-09-30-at-3-50-09-pm
Tides
screen-shot-2016-09-30-at-3-54-45-pm
Pink is the best color
screen-shot-2016-09-30-at-4-10-20-pm
Fine Lines
screen-shot-2016-09-30-at-4-12-50-pm
Purple

I wanted to do this project by using hexagons as the basic tiles because they merge so well. I used value because I liked how they conveyed space so well.

img_1184

Looking Outwards 5- Digital Emily


“Digital Emily” Introducing Image Metrics

A 3D computer graphic image of Emily by Image Metrics
Emily under 156 LED lights at USC Institute for Creative Technologies Graphics Lab
slide03
The fifteen photographs of the face under different lighting conditions by Image Metrics

The Digital Emily Project was done by Paul Debevec and his team from Image Metrics in 2008. They built a 3d digital puppet of the actress Emily O’Brien that they could manipulate. Viewers could not tell whether they were watching the real person or the computer graphic animation. Countless rays of light produced by 156 bulbs bounced off the surface of Emily’s skin and into the camera, which allowed people to “scan” her face. Different from putting trackers on her face, this process can capture more details like pores and fine wrinkles. The team used hybrid normal map rendering in Maya 8.0.

sm_slide36
Specular (high-res) geometry image of Emily O’Brien by Image Metrics

The use of hybrid normal maps created better effects than diffuse map rendering because it made the surface more like skin. Emily’s eyelashes were often covering her eyelids and pupils so they had to build the model of her eyes from scratch. A program that could move each part of Emily’s face like her brows and teeth allowed the team to create whatever expression the real Emily could make. Using this program, they made a Computer Graphic animation by replicating each frame from a video of the real Emily in less than two weeks. It is surprising how the actual animation process only took so little time. It gives us a sense of how powerful this tool is once the process of generating the system is finished. I admire this project because it can be applied easily in the film industry. One of the intentional decisions that Debevec made was determining the extent to which Emily’s facial expressions could be exaggerated and what kind of expression would be considered realistic. This whole project gave me an appreciation of the complexity of the human face.

Links:

The Digital Emily Project: Achieving a Photoreal Digital Actor

Acquiring the Reflectance Field of a Human Face

Check out the TED talk given by Paul Debevec on The Digital Emily Project:


Simin Li- Looking Outwards 4

Fantasy-Impromptu, by Frederic Chopin, accompanied by a graphical score by Stephen Malinowski

The animated graphical score project known as the Music Animation Machine was created by Stephen Malinowski in 1974 and is still an ongoing project. The composer and programmer was overwhelmed by reading the score of a Brandenburg concerto and wanted to display complex music in a way that listeners of all levels could easily follow. He decided to use animation to visualize musical pieces by writing a program on an Atari using BASIC. The result was a video that synchronized with music using movement, shape and color. He explains that the notes we hear most recently are most vivid and the notes we hear a while ago seem to fade away, so he uses solid shapes to represent present notes and hallow shapes to represent faded notes. He also uses different shapes for different types of instruments that interact together. In 2012, his software could generate animation in a live performance. He now uses frame-rendering software that inputs a MIDI file (software unknown). A music appreciation teacher has used his work to teach students to grasp convoluted pieces and the results have been significant. What I admire most about this project is that it conveys music visually through one program. The animation Malinowski makes reminds me of dance. The programming that he does is actually choreography: he pays attention to the position and movement of different elements while following a certain rhythm and theme. This makes me wonder whether a single algorithm can be used to generate dance and other visual art.

Links

THE DAILY BEAST This Amazing Machine Lets You ‘Paint’ Mozart’s Music by Nick Romeo

Dazed and Confused, full interview with Stephen Malinowski

Stephen Malinowski and the Music Animation Machine

Stephen Malinowski on youtube

Check out his performance at TEDxZurich.

Simin Li Project4- String Art


siminl-project4

// Simin Li
// Section C
// siminl@andrew.cmu.edu
// Project 4
var X1 
var Y1 //coordinates of first point on line segment
var X2 
var Y2 //coordinates of second point on line segment
function setup() {
    createCanvas(640, 480);
    background("LightSalmon");
     X1 = 0;
     Y1 = 0; 
     X2 = length / 2;
     Y2 = sqrt(3) * length / 2; //use trig to set outer triangle to be equilateral
 }
function draw() {
	    flower(width/ 2, height / 2,240);
    	strokeWeight(0.3);
        flower(width/ 2, height / 2,110);
        //draw flowers at width/ 2,height / 2 with "radius" of 240 and 110 
    noLoop();
   }
function halfPetal(x, y, a, sign, length) {
//defines the function halfPetal() which draws half a petal either facing down or up.
//x,y determines the left tip of petal
//a dtermines the radians rotated
//sign dtermines whether petal is facing up or down
//length determines the length of petal
	push();     
    X1 = 0;
    Y1 = 0;
    X2 = length / 2;
    Y2 = sign * sqrt(3) * length / 2; //reset the coordinates of point 1 and point 2 before loop
    gapX = length / 60; //the difference of X values between two adjacent starting points and end points
    gapY = sqrt(3) * length / 60;//the difference of Y values between two adjacent starting points and end points
    translate(x,y);
    rotate(a);
    for(var i = 0; i < 31; i ++){  
            line(X1, Y1, X2, Y2); 
    	    X2 = X2 + gapX;
    		Y2 = Y2 - gapY * sign;
    		X1 = X1 + gapX;
    		Y1 = Y1 + gapY * sign;//connect the dots to form a curve
    		}
    pop();
    }
function flower(centerX,centerY,length){
//defines the function flower() which draws a flower at centerX,centerY with petal length of length
    stroke(223,40,62);
    halfPetal(centerX,centerY,(PI / 3), 1,length);
    halfPetal(centerX,centerY,2 * PI  / 3 + (PI / 3), 1,length);
    halfPetal(centerX,centerY,4 * PI / 3 + (PI / 3), 1,length);
    halfPetal(centerX,centerY,(PI / 3) , -1,length);
    halfPetal(centerX,centerY, 2 * PI  / 3 + (PI / 3), -1, length)
    halfPetal(centerX,centerY, 4 * PI / 3  + (PI / 3), -1,length);
    //draw pink flower by combing top and bottom petal together and rotating
    
    stroke(35,66,26);
    halfPetal(centerX,centerY,0, 1,length);
    halfPetal(centerX,centerY,2 * PI  / 3 , 1,length);
    halfPetal(centerX,centerY,4 * PI / 3 , 1,length);
    halfPetal(centerX,centerY, 0 , -1,length);
    halfPetal(centerX,centerY, 2 * PI  / 3 , -1,length);
    halfPetal(centerX,centerY, 4 * PI / 3  , -1,length);  
    //draw green flower with same proceedure

    }

I was surprised that straight lines could produce such organic curves. The shapes reminded me of a flower so I made a flower inside a flower.

image-5

Looking Outwards 3- fahz


An example of a Fahz by Nicholas Desbiens
Base of fahz by Nicholas Desbiens
Base of fahz by Nicholas Desbiens. Tick marks show the precise location of each profile.

Fahz initially started as a project by Nicholas Desbiens in 2015 for Mother’s Day. It created a customized 5″ vase that seamlessly incorporated the faces of him and his two children in the vase’s surface structure. Utilizing a custom software program he calls the “Fahz-o-matic” built by Rhino, Grasshopper, Python and Processing, he made a digital model of each person’s profile headshot. The variables for this probably include the distance from each point on the face to the y-axis. Then, he rotated the 2D models about the y-axis generating a 3-D vase. Finally, 3D printers bring the algorithms to life. The material used is a plastic called PLA. Desbiens’s intentional decisions include utilizing negative space. The coding also determines how to join each slice of the vase together. Because the height and depth of each face on an individual vase is different, the program needs to decide which two faces are joined together and how many to join together. (12 faces generated a “dog-bowl” rather than a vase)

Closeup of fahz by Nicholas  Desbiens Tick marks show the precise location of each profile.
Closeup of synthetic sandstone fahz by Nicholas Desbiens

This project was inspired by Edgar Rubin’s Figure–Ground Vase. It is inspirational that coding can bring 2D art from 100 years ago into a customized 3D sculpture today. This Digital Pottery project has now expanded into a business that allows customers to submit profile pictures and get a customized vase. Building on Professor Levin’s idea, each individual vase is already fascinating, but the program that creates infinite varieties of it is priceless.

Sources

fahz

Desbiens Design Research – fahz

Check out the video:

Nicholas and Martha Desbiens talking about fahz on Kickstarter

SiminLi- Project 3 One Point Perspective Dynamic Drawing

siminl-project3

// Simin Li
// Section C
// siminl@andrew.cmu.edu
// Project 3
var sqrMin = 20;
var sqrMax = 180; //limitations to size of square
var vanishX = 320;
var vanishY = 240;
var X1 = 200;
var Y1 = 120;
var A1 = 20; //coordinates and length of top left large square

var X2 = 440;
var Y2 = 120;
var A2 = 20; //coordinates and length of top right large square

var X3 = 200;
var Y3 = 360;
var A3 = 20;//coordinates and length of bottom left large square

var X4 = 440;
var Y4 = 360;
var A4 = 20;//coordinates and length of bottom right large square

var light = 255; //control brightness of large suqares and background

function setup() {
    createCanvas(640, 480);
}
function draw() {
    colorMode(RGB);
	background(255 - light);//changes the color of the background with respect to distance from 
    //vanishing points to center of canvas
    rectMode(CENTER); 
    noCursor();//remove mouse

var from14 = color(255,255 ,0);//"Yellow"; first base color for squares 1 and 4
var to14 = color(65,105,225);//"RoyalBlue"; second base color for squares 1 and 4
var from23 = color( 0,191,255); //"Deepskyblue"; first base color for squares 2 and 3
var to23 = color(255,255 ,0);//"Yellow"; second base color for squares 2 and 3
	
    A1 = map(dist(vanishX,vanishY,X1,Y1),0, dist(X1,Y1,640,480),sqrMin,sqrMax);
	var a1 = A1 * 2 / 3; //length of small squares is always a third of the large squares
	A2 = map(dist(vanishX,vanishY,X2,Y2),0, dist(X2,Y2,0,480),sqrMin,sqrMax);
    var a2 = A2 * 2 / 3;
    A3 = map(dist(vanishX,vanishY,X3,Y3),0, dist(X3,Y3,640,0),sqrMin,sqrMax);
    var a3 = A3 * 2 / 3;
    A4 = map(dist(vanishX,vanishY,X4,Y4),0, dist(X4,Y4,0,0),sqrMin,sqrMax);
    var a4 = A4 * 2 / 3;
    // length of sqaures is correlated to the distance from square center to farthest corner

    light = map(dist(vanishX,vanishY,width / 2,height / 2),0, dist(width / 2,height / 2,0,0),0,255);
    //changes the color of the background with respect to distance from vanishing points to center of canvas
  
    fill(light);
    rect(X1,Y1,A1,A1);
    rect(X2,Y2,A2,A2);
    rect(X3,Y3,A3,A3);
    rect(X4,Y4,A4,A4); // draw large squares

	vanishX = min( max(0,mouseX),640);
    vanishY = min(max(0,mouseY), 480);//vanish point of one point perspective
    
    var x1 = (2 * X1 + vanishX) / 3; 
    var y1 = ((vanishY - Y1) / (vanishX - X1)) * (x1 - X1) + Y1; //position of small squares are at
    // a third of vanishing point and center of large square
    var X1L = X1 - A1 / 2;
    var X1R = X1 + A1 / 2;
    var Y1T = Y1 - A1 / 2;
    var Y1B = Y1 + A1 / 2;// coordinates of 4 corners of large squares(used later to draw lines)
    var x1L = x1 - a1 / 2;
    var x1R = x1 + a1 / 2;
    var y1T = y1 - a1 / 2;
    var y1B = y1 + a1 / 2; // coordinates of 4 corners of small squares


	strokeWeight(4);
	line(X1L, Y1T, x1L, y1T);//top left connect 
    line(X1R, Y1T, x1R, y1T);//top right connect
    line(X1L, Y1B, x1L, y1B);//bottom left connect
    line(X1R, Y1B, x1R, y1B);//bottom right connect

    var x2 = (2 * X2 + vanishX) / 3; 
    var y2 = ((vanishY - Y2) / (vanishX - X2)) * (x2 - X2) + Y2;
    var X2L = X2 - A2 / 2;
    var X2R = X2 + A2 / 2;
    var Y2T = Y2 - A2 / 2;
    var Y2B = Y2 + A2 / 2;
    var x2L = x2 - a2 / 2;
    var x2R = x2 + a2 / 2;
    var y2T = y2 - a2 / 2;
    var y2B = y2 + a2 / 2;
    

	strokeWeight(4);
	line(X2L, Y2T, x2L, y2T);//top left connect 
    line(X2R, Y2T, x2R, y2T);//top right connect
    line(X2L, Y2B, x2L, y2B);//bottom left connect
    line(X2R, Y2B, x2R, y2B);//bottom right connect

    var x3 = (2 * X3 + vanishX) / 3; 
    var y3 = ((vanishY - Y3) / (vanishX - X3)) * (x3 - X3) + Y3;
    var X3L = X3 - A3 / 2;
    var X3R = X3 + A3 / 2;
    var Y3T = Y3 - A3 / 2;
    var Y3B = Y3 + A3 / 2;
    var x3L = x3 - a3 / 2;
    var x3R = x3 + a3 / 2;
    var y3T = y3 - a3 / 2;
    var y3B = y3 + a3 / 2;

	strokeWeight(4);
	line(X3L, Y3T, x3L, y3T);//top left connect 
    line(X3R, Y3T, x3R, y3T);//top right connect
    line(X3L, Y3B, x3L, y3B);//bottom left connect
    line(X3R, Y3B, x3R, y3B);//bottom right connect

    var x4 = (2 * X4 + vanishX) / 3; 
    var y4 = ((vanishY - Y4) / (vanishX - X4)) * (x4 - X4) + Y4;
    var X4L = X4 - A4 / 2;
    var X4R = X4 + A4 / 2;
    var Y4T = Y4 - A4 / 2;
    var Y4B = Y4 + A4 / 2;
    var x4L = x4 - a4 / 2;
    var x4R = x4 + a4 / 2;
    var y4T = y4 - a4 / 2;
    var y4B = y4 + a4 / 2;

    strokeWeight(4);
    line(X4L, Y4T, x4L, y4T);//top left connect 
    line(X4R, Y4T, x4R, y4T);//top right connect
    line(X4L, Y4B, x4L, y4B);//bottom left connect
    line(X4R, Y4B, x4R, y4B);//bottom right connect
    
    colorMode(RGB);
    inter1 = lerpColor(from14, to14,dist(vanishX,vanishY,X1,Y1) / dist(X1,Y1,height,width));// far right corner is(640,480)
    inter4 = lerpColor(from14, to14,dist(vanishX,vanishY,X4,Y4) / dist(X4,Y4,0,0));// far left corner is(0,0)
    inter2 = lerpColor(from23, to23,dist(vanishX,vanishY,X2,Y2) / dist(X2,Y2,0,height));//far left corner is(0,640)
    inter3 = lerpColor(from23, to23,dist(vanishX,vanishY,X3,Y3),0, dist(X3,Y3,width,0)); //fills squares based 
    //their distance from their furthest corner(according to x, y position)
    //far right corner is(640,0)
    fill(inter1);         
    rect(x1,y1,a1,a1);
    fill(inter4); 
    rect(x4,y4,a4,a4); 
    fill(inter2); 
	rect(x2,y2,a2,a2);
    fill(inter3); 
	rect(x3,y3,a3,a3); //draw and fill small squares 
  
    
     push();  //draw rotating flower to replace cursor
    translate(mouseX,mouseY);
    scale(2, 1); //stretched horizontally to 2 times
    rotate(millis() / 1000) ;
    noStroke();

    fill(255);
    ellipse(0,0,20,4);
    ellipse(0,0,4,20);//white petals 

    push();
    rotate(PI/4.0);
    ellipse(0,0,20,4);
    ellipse(0,0,4,20);//white petals that are rotated 45 degrees 
    fill("Gold");
    ellipse(0,0,5,5);//center
    pop(); 
    pop();
}

The idea for this project was inspired by learning about one point perspective, two point perspective and three point perspective images in drawing class. In one point perspective images all lines on the yz plane intersect at one point called the vanishing point. the rest of the lines are parallel. The vanishing point in this dynamic drawing is the flower and the boxes are leaves.

project-3-2project-3