![[OLD FALL 2017] 15-104 • Introduction to Computing for Creative Practice](../../../../wp-content/uploads/2020/08/stop-banner.png)
// Emmanuel Nwandu
// enwandu@andrew.cmu.edu
// Section D
// Project-07-Curves
function setup() {
createCanvas(400, 400);
}
function draw() {
background(0);
translate(width/2, height/2); // Center drawing on canvas
drawEpitrochoid(); // Calls the function drawEpitrochoid
}
// Creates the geometry of the Epitrochoid curve
function drawEpitrochoid() {
noFill();
stroke(200, 0, 0);
var points = 750;
var x;
var y;
var h = constrain(mouseX, 0, 250)
var a = 375;
var b = a/constrain(mouseY, 0 , 250) //Constrains the width of geometry created
// by the curves between the top and bottom edge of the canvas
beginShape();
for (var i=0; i < points; i++) {
var t =map(i, 0, points, 0, TWO_PI);
// Equation of epitrochoid applied to the x and y variables
x = (a-b)*cos(t) + h*cos(((a-b)/b)*t)
y = (a-b)*sin(t) + h*sin(((a-b)/b)*t)
vertex(x, y);
}
endShape();
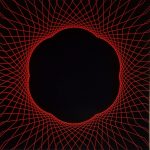
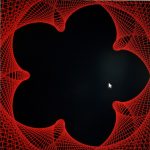
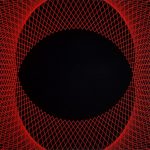
}I ended up going for an Epitrochoid curve, but I bounced between that and the logarithmic spiral as an option. I played around with both, but ended up going for the Epitrochoid curve. I was initially confused about what parameters of the drawing would be controlled by what variables, but I played around with it for a while until I understood how my manipulation of the code influenced my drawing. I would suggest moving slowly across the canvas, in both x and y directions to see the full breadth of geometry generated by the code.
Source: http://mathworld.wolfram.com/Epitrochoid.html