![[OLD FALL 2017] 15-104 • Introduction to Computing for Creative Practice](../../../../wp-content/uploads/2020/08/stop-banner.png)
Project One: Spotify – Pride Stories by Studio Giant Ant
Year of Creation: 2016
Link to Project Work: http://www.giantant.ca/spotify-pride-stories
Link to Creator Bio:http://www.giantant.ca/about/
—–
Project Two: Most Female and Male Occupations Since 1950 by Flowing Information
Year of Creation: 2016
Link to Project Work: http://flowingdata.com/2017/09/11/most-female-and-male-occupations-since-1950/
Link to Creator Bio: http://flowingdata.com/
The two projects I chose to compare for my final Looking Outwards take two different approaches in delivering messages to audiences — both, however, are rooted in computational media, with varying degrees of computation usage.

Giant Ant’s Spotify Pride Stories is an information visualization-animation discussing the role of same-sex marriage laws in the workplace, and the lifestyles of stakeholders tied to those laws. It uses primarily Adobe Illustrator and Adobe AfterEffects to tell a story with their information, and uses computationally-derived data to form infographics on specific moments within the animation.
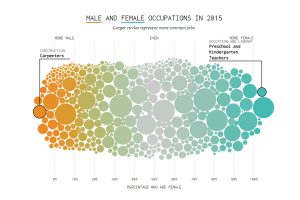
In comparison, Flowing Data’s Most Female and Male Occupations Since 1950 is a static infographic running on javascript and HTML/CSS that encourages user interaction through mouse-hover. Viewers are introduced to the topic of gender in the workplace through a gradient visualization, which they can experience for themselves by placing their cursor over different areas within the inforgraphic.
As a set, these two projects represent approaches to design that I’m very invested in — animation, world-building, and information delivery.