![[OLD FALL 2017] 15-104 • Introduction to Computing for Creative Practice](../wp-content/uploads/2020/08/stop-banner.png)
The readings, assignments, and projects below constitute the Week 4 Deliverables and are due by 11:59pm EDT on Friday, September 22nd:
- Technical Readings
- Looking Outwards 04 [Blog]
- Assignment-04-A (Mini Calendar) [Autolab]
- Assignment-04-B (Geometric Progression) [Autolab]
- Project-04: (String Art) [Blog]
1. Technical Readings
2. Looking Outwards 04: Sound Art
Our Looking Outwards topic for this week is sound and is specifically concerned with how artists use computation to work with sound and music. You might consider how digital storage and networks change the way we think about sound; how sound is generated digitally or processed digitally; how sound data is transformed to physical sound through conventional means (loudspeakers, headphones) and unconventional means; and how sound has been visualized. Computation creates the possibility of sophisticated generative music, ranging from computational soundscapes to automated emulations of musical style, as well as provocative new instruments for human expression.
Identify a particular project or work in the area of sound and computation which you find interesting. In a blog post of about 100-200 words,
- Please discuss the project. What do you admire about it, and why do you admire these aspects of it?
- What do you know (or what do you suppose) about the algorithms that generated the work?
- It what ways are the creator’s artistic sensibilities manifest in the final form?
- Link (if possible) to the work. To the best of your abilities, be sure to provide the creator’s name, title of the work, and year of creation.
- Embed an image, sound, and/or a YouTube/Vimeo video of the project (if available).
- Label your blog post with the Categories LookingOutwards-04 and your section, e.g. Section A.
Some additional good places to find projects include:
- http://www.creativeapplications.net/tag/sound/
- http://thecreatorsproject.vice.com/article/gsearch?query=sound
- https://vimeo.com/search?q=maxmsp
- https://www.youtube.com/user/MediaArtTube/videos
- The archives of NIME
- The archives of ICMC
- The work of artists/composer/musicians including Christian Marclay, Christina Kubisch, Don Ritter, Ikue Mori, Janet Cardiff, Keiko Uenishi (o.blaat), Laetitia Sonami, Luke Du Bois, Pamela Z, Pauline Oliveros, Robert Henke, Ryoji Ikeda, Trimpin, Zimoun… (Search for their works on Google, YouTube etc.!)
3. Assignment 04-A: A Mini-Calendar
Thirty days hath September,
April, June, and November.
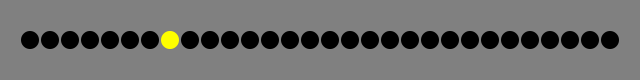
In this Assignment, you will use a for() loop to generate a row of 30 visual elements. These 30 elements are intended to represent the 30 days of September (the current month, as I write this). All of the elements should be drawn identically — except for the one whose index (as counted from left to right) corresponds to the current day. That one should be drawn “highlighted”.
This Assignment is to be submitted through Autolab. Its purpose is to practice your skills in combining iteration with conditional testing, while simultaneously introducing some basic timekeeping functions.
Requirements:
- Using a single
for()loop, generate a row of 30 elements. These elements will represent the 30 days of September, which is the current month. These might be circles, rectangles, or something similarly simple. - All of the elements should be drawn identically — except for the one that corresponds to the current day, which should be drawn “highlighted”. For example, I’ve used circular elements in the example above. As you can see, the screenshot above was recorded on September 8th, and thus the 8th circle has been (automatically) drawn with a yellow highlight. Your program must automatically highlight the correct element, depending on whichever day of the month it is.
- To highlight the special “today” element, you must use a conditional test, such as an
if()block. You’ll also need to use p5’sday()function. To clarify: the “today” element must substitute for a regular one; you may not render the “today” element over (on top of) a regular one. - As a guide: your entire program should be shorter than two dozen lines of code, all told. If your code is longer than this, you’re probably not doing this the right way. (Our version is 16 lines long, or maybe 20 line including comments.) The only exception to this would be:
- For a totally optional 5% bonus on this assignment, instrument your program so that it shows the correct number of days for whatever the current month might happen to be (e.g., September hath 30 days, but October hath 31). To reckon the length of February, use the algorithm provided here for determining Leap Years (https://en.wikipedia.org/wiki/Leap_year#Algorithm). Naturally, you’ll need to know how to obtain and use the current
month()andyear(). If you decide to attempt this bonus problem, please say so in a comment at the top of your code. - Don’t forget to comment your code, and please give attention to code style.
Then, as per usual for all Assignments uploaded to Autolab:
- Put the following information into comments at the top of your code: Your name; Your class section or time; Your email address, including @andrew.cmu.edu; and Assignment-04-A
- Name your project directory UserID
-04-a. For example, if your Andrew ID isplacebo, then your directory name should beplacebo-04-a, and this directory should containsketch.jsandindex.html. Please be attentive to this! - Zip and upload this directory and also a directory for Assignment 04-B to Autolab, using the provided instructions.
4. Assignment 04-B: A Geometric Progression
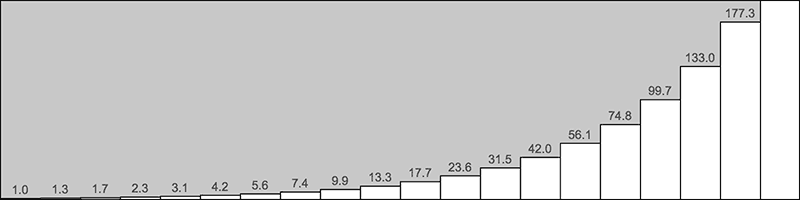
In this Assignment, you will use a for() loop to visualize a geometric progression. Also known as a geometric sequence, a geometric progression is a series of numbers where each term after the first is computed by multiplying the previous one by a fixed number called the common ratio.
This Assignment is to be submitted through Autolab. Its purpose is to practice your skills writing iterative computations, to introduce some commands related to displaying text onscreen, and to test your attention to visual detail. Successful solutions to this prompt will closely resemble the screenshot above. This assignment may be thought of as a possible precursor to the practice of information visualization.
Requirements:
- Create a p5.js program that displays a canvas whose dimensions are precisely 800 x 200 pixels. Declare a variable that will be used to represent the width of each of the rectangles, and compute its value to be one-twentieth of the width of the canvas. Now, using this variable and a
for()loop, divide the canvas horizontally into 20 equally-spaced rectangles. - Assign the height of the first (leftmost) rectangle to be exactly 1.0 pixels. We will use 1.333333 as our progression’s common ratio for this Assignment. Thus, the height of every subsequent rectangle should be precisely 1.333333 times as large as the one to its left. (For example, the third rectangle will be 1.0 * 1.333333 * 1.333333 ≈ 1.777777 pixels tall; and so forth.) You may find it helpful to create variables that represent the common ratio and the height of the current rectangle under consideration.
- For full credit, render your rectangles such that they rise upward from the bottom of the canvas, rather than hanging down from above.
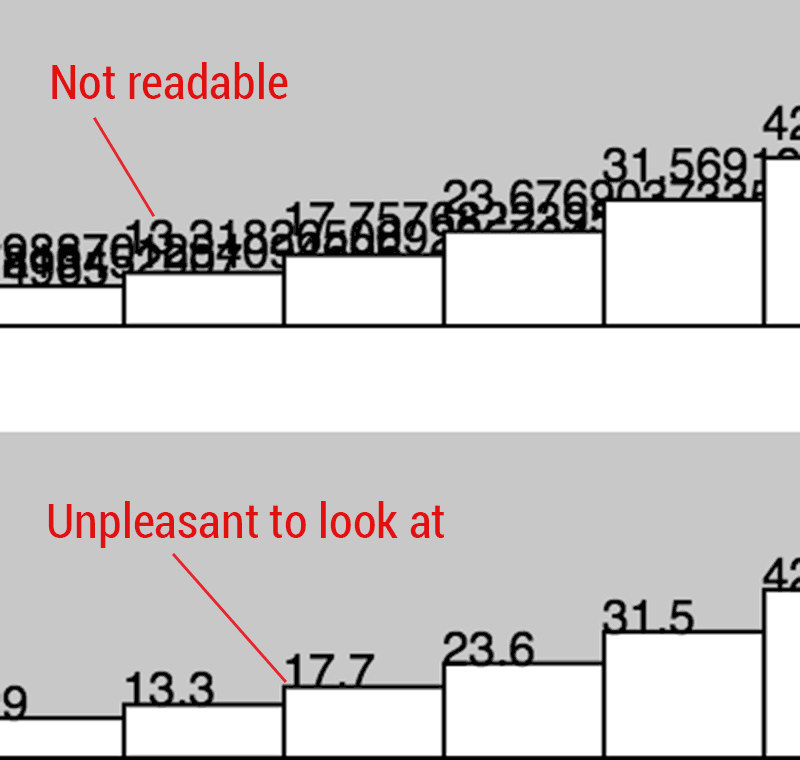
- It’s now time to label your values. In the region just above each rectangle, using the
text()command, display a number representing that rectangle’s height. - Hey: make your labels legible. Note, for example, that the numbers shown in the screenshot above represent rounded values. Below you can see some of the graphical problems you’ll need to solve. Dealing with this kind of stuff is called craft. You may find it helpful to use the
textAlign()andnf()commands. - Don’t forget to comment your code, and please give attention to code style.
Then, as per usual for all Assignments uploaded to Autolab:
- Put the following information into comments at the top of your code: Your name; Your class section or time; Your email address, including @andrew.cmu.edu; and Assignment-04-B
- Name your directory UserID
-04-b.For example, if your Andrew ID isplacebo, then your project directory name should beplacebo-04-b, and this directory should containsketch.jsandindex.html. Please be attentive to this! - Zip and upload this directory and your Assignment 04-A directory (both in one zip file) to Autolab, using the provided instructions.
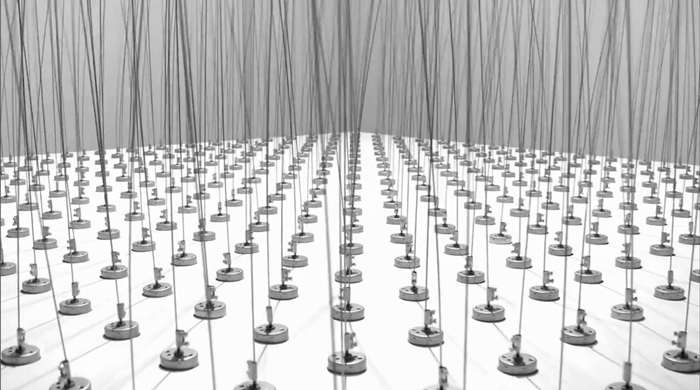
5. Project-04: String Art
In this Project, which (as usual for Projects) is to be uploaded to our course WordPress blog, you will create a drawing using “string art” techniques. These images convey some of the vast possibilities:
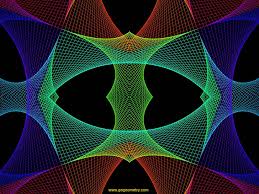 |
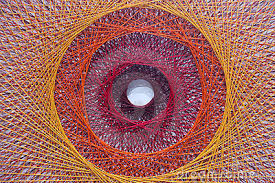 |
| from Google Images: gogeometry.com | from Google Images: bestpatterns.ludug.com |
 |
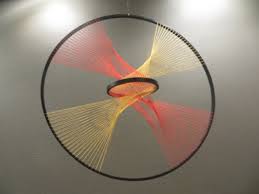 |
| from Google Images: youtube.com | from Google Images: momath.com |
How to make “string art”. One basic idea of string art is that you draw lines (stretch string) where the line end-points lie along a progression of points, often in a straight line. If you don’t have a good intuition for this, check out Holly Hatfield’s blog on “7th Grade String Art”.
From a programming perspective, you’ll have to figure out how to generate the points where you “connect” the string. Keep in mind that you’ll need to make two sequences: E.g. you can generate x1,y1 and x2,y2, then draw from x1,y1 to x2,y2. How do you generate a sequence of points? One way is by incrementing x1 and x2 by fixed amounts, just like in animation where you can increment position by velocity. E.g. if you update x1 += x1StepSize; and y1 += y1StepSize;, that should generate a nice progression of x1,y1 values. You can do the same for x2,y2 (but x2StepSize,y2StepSize should probably take you in a different direction than x1StepSize,y1StepSize).
Another possibility is to use the lerp() function, which generates interpolated values between two numbers. For example, you could write x1 = lerp(20, 200, amt); y1 = lerp(50, 80, amt); to generate x1,y1 points along the straight line from 20,50 (when amt == 0) to 200,80 (when amt == 1). When amt is 0.1, you get 1/10 of the way from 20,50 to 200,80.
Finally, here are the Project-04 Requirements:
- Using a canvas size whose dimensions are 400×300 (or 300×400, whichever you prefer), create a program in p5.js that generates a “string art” drawing.
- You must draw at least 4 “curves” where each curve consists of lines between two sequences of points.
- Comment your code – it should be easy to tell how the code works, e.g. explain coordinate calculations and describe what parts of the drawing are drawn by different parts of your code. (Note: adding comments while you are programming to document your thought process is a good idea.)
- When you’re done, embed your p5.js sketch in a blog post on this site, using the (usual) instructions here. Make sure that your p5.js code is visible and attractively formatted in the post.
- In your blog post, write a sentence or two reflecting on your process and product. In discussing your process, it would be nice to see any of your paper sketches from your notebook; these could be as simple as photos captured with your phone.
- Label your project’s blog post with the Categories Project-04-String-Art and your section, e.g. Section E.