![[OLD FALL 2017] 15-104 • Introduction to Computing for Creative Practice](../wp-content/uploads/2020/08/stop-banner.png)
The readings, assignments, and projects below constitute the Week 6 Deliverables and are due by 11:59pm EDT on Friday, October 6th:
- Technical Readings
- Looking Outwards 06 [Blog]
- Assignment-06-A (Pie Chart 1) [Autolab]
- Assignment-06-B (Pie Chart 2) [Autolab]
- Assignment-06-C (Simple Clock) [Autolab]
- Project-06: (Abstract Clock) [Blog]
1. Technical Readings
- p5js Transformations (and rotations). This could be especially helpful for the clock project (Project-06).
- A Quick Look Into The Math Of Animations With JavaScript
- all about arrays: http://www.w3schools.com/js/js_arrays.asp
- A nice (and a little lengthy) explanation of arrays in Javascript
- all about strings: http://www.w3schools.com/js/js_strings.asp
- all about string functions: http://www.w3schools.com/js/js_string_methods.asp
2. Looking Outwards 06: Randomness
Our Looking Outwards topic for this week is Randomness. Randomness has had a huge impact on the sciences and the arts, particularly in the 20th Century, with quantum physics, chance music, “found” art, and with the advent of computing, Monte Carlo methods for simulation and random numbers used in many generative algorithms for sound, images, and sculpture. In Looking Outwards 06, your task is to find and report on the use of randomness in the computation of art (in any medium, including sound). Try to be as informative as possible about how randomness is used. For example, there are “truly” random numbers, usually obtained from the real world, and “pseudo-random numbers,” which are reproducible and deterministic sequences that merely behave like random numbers. Also, “random” numbers can be biased (sometimes strongly). E.g. the weather may be random, but it’s not going to be -10 or 200 degrees tomorrow. Artists use different probability distributions to bias randomness to get interesting results.
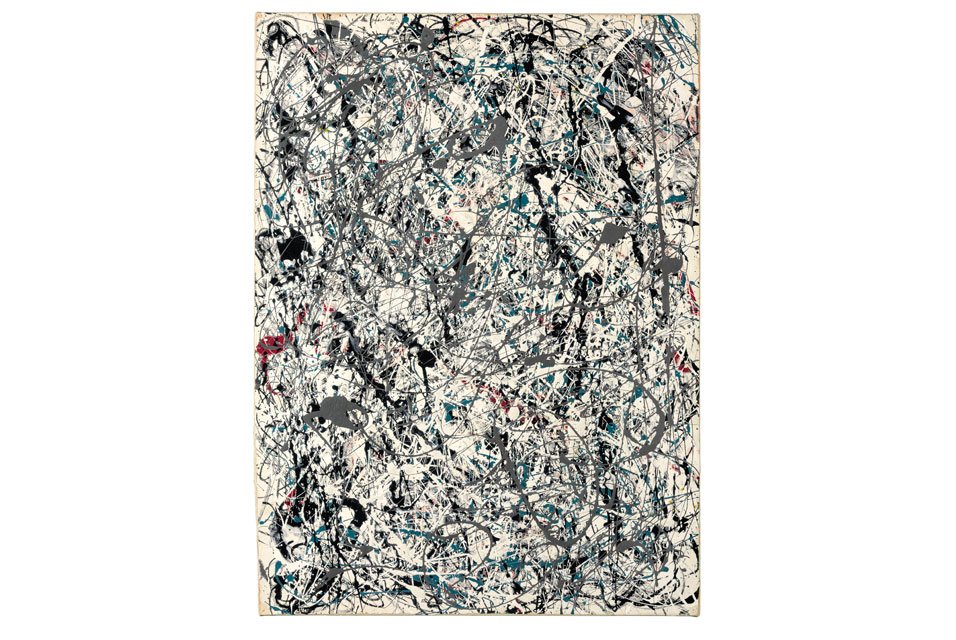 Jackson Pollock, Number 19, 1948. Oil and enamel on paper laid down on canvas, 30 7/8 x 22 7/8 in. (78.4 x 58.1 cm.). Photo from artdaily.com’s report on a recent sale for $58M. |
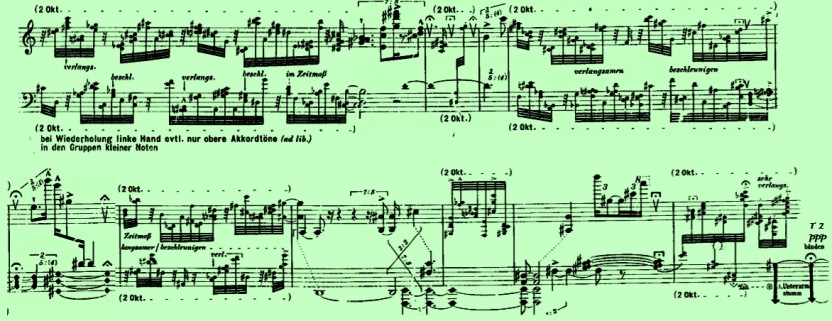 Fragment from the score of Karlheinz Stockhauen’s groundbreaking piece KLAVIERSTÜCK XI (Piano Piece 11, 1956), which relies on chance operations and a non-deterministic score. Image is from stockhausenspace.blogspot.com |
Identify a particular project or work that you find interesting and that exemplifies computation, randomness, and creativity.
In a blog post of about 100-200 words,
- Please discuss the project. What do you admire about it, and why do you admire these aspects of it?
- What do you know (or what do you suppose) about algorithms and randomness in the work?
- It what ways are the creator’s artistic sensibilities manifest in the final form?
- Link (if possible) to the work. To the best of your abilities, be sure to provide the creator’s name, title of the work, and year of creation.
- Embed and caption an image, sound, and/or a YouTube/Vimeo video of the project (if available).
- Label your blog post with the Category, LookingOutwards-06.
3. Assignment 06-A: Pie Chart 1
This Assignment is to be submitted through Autolab. Its purpose is to practice your skills with graphics and introductory information visualization.
The code below declares four variables, which are assumed to be globally declared. In this Assignment, you will use p5.js code to generate a pie chart which displays these values using filled arc() primitives:
|
1 2 3 4 |
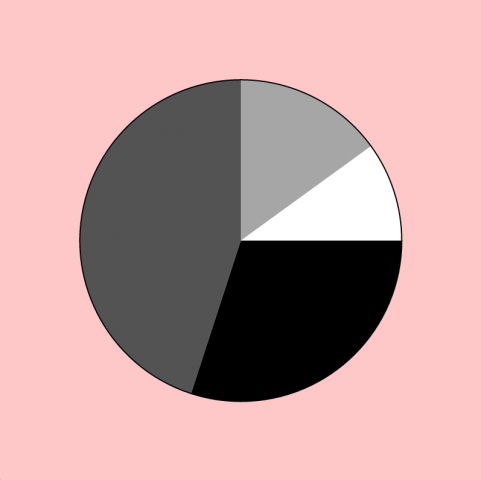
var val0 = 0.30; var val1 = 0.45; var val2 = 0.15; var val3 = 0.10; |
Your pie chart should look something like the screenshot below. The black arc represents val0 (30% of the pie), the dark gray arc represents val1 (45% of the pie), etcetera.
You can define the colors for the pie pieces however you please, but you’ll need some solution for coloring the pieces differently. I colored each wedge with a grayscale level proportional to its start-angle. Another solution might color each wedge proportional to its index (0, 1, 2) if you were to count them. Another solution might color the wedges with an array of custom-selected colors.
Now introduce the following mousePressed() code to the bottom of your program. Your pie chart should accommodate the changes automatically — so that when the user clicks the mouse, the pie chart adjusts to the new values of the four variables.
|
1 2 3 4 5 6 |
function mousePressed() { val0 = random(0.1, 0.3); val1 = random(0.1, 0.3); val2 = random(0.1, 0.3); val3 = 1.0 - (val0 + val1 + val2); } |
Then, as usual for all Assignments uploaded to Autolab:
- Put the following information into comments at the top of your code: Your name; Your class section or time; Your email address, including @andrew.cmu.edu; and Assignment-06-A
- Name your project UserID
-06-a.For example, if your Andrew ID isplacebo, then your project directory (folder) name should beplacebo-06-a. Please be attentive to this! - Zip and upload your code to Autolab, using the provided instructions. Zip a directory (folder) containing this and also Assignment-06-B and maybe Assignment-06-C.
4. Assignment 06-B: Pie Chart 2.
This Assignment is to be submitted through Autolab. Its purpose is to practice your skills with graphics, introductory information visualization, and arrays.
In this Assignment you will modify the Pie Chart you created in the previous section. At the top of your code, begin with the following two global variables: vals, which is an array of 4 numbers, and nVals, which is a number that stores the number of elements in that array (in this case, 4, clearly), which is obtained automatically using the .length property of the array. These variables replace the ones you had before (val0, val1, val2, etcetera).
|
1 2 |
var vals = [0.30, 0.45, 0.15,0.10]; var nVals = vals.length; |
Now that you’ve got that working, include the following mousePressed() function in your program. DON’T WORRY about the gory details of what’s going on in this voodoo. What you do have to know is that the following code will randomize this array whenever the user clicks. It also populates the array with a random number of elements (somewhere between 3 and 8, roughly), and reassigns the nVals variable appropriately. Your Pie Chart must accommodate.
|
1 2 3 4 5 6 7 8 9 10 |
function mousePressed() { vals = []; var sum = 0; while (sum < 1.0) { var v = random(0.08, 0.38); sum += v = ((1.0 - (sum + v)) < 0.05) ? (1.0 - sum) : min(v, 1.0 - sum); vals.push(v); } nVals = vals.length; } |
Here’s what it will look like when the user clicks:
Then, as usual for all Assignments uploaded to Autolab:
- Put the following information into comments at the top of your code: Your name; Your class section or time; Your email address, including @andrew.cmu.edu; and Assignment-06-B
- Name your project UserID
-06-b.For example, if your Andrew ID isplacebo, then your project directory (folder) name should beplacebo-06-b. Please be attentive to this! - Zip and upload your code to Autolab, using the provided instructions. Zip a directory (folder) containing this and also Assignment-06-A and maybe Assignment-06-C.
5. Optional Extra Credit: Assignment 06-C, A Simple Clock
In this Assignment, you are asked to write a program that displays a commonplace circular clock, similar to the animated illustrations below. The purpose of the assignment is to strengthen your skills (1) with graphical rotations, (2) with the system’s functions for accessing the current time, and (3) with simple string formatting. This Assignment is to be submitted through Autolab.
Requirements:
Just in case you missed it, Assignment 06-C is optional.
Create a p5.js program with a canvas of 300 x 300 pixels.
In this canvas, display a standard circular clock: with an hour hand, minute hand, and second hand that rotate around the center of the canvas. (You’ll need to use the p5.js hour(), minute(), and second() functions.) Make sure your clock’s hands look different from each other. Conventionally, the hour hand is short and fat, while the minute hand is longer and thinner. You may render your clock’s hands with any graphical primitives you prefer.
To display the clock’s hands, you may choose between calculating their positions directly (with trigonometric functions like sin() and cos()), or using graphics functions like push(), rotate(), translate() and pop(). You’ll probably find it more straightforward to do the latter, but both are acceptable approaches.
Your clock should be a 12-hour (not 24-hour!) clock. Because the hour() function returns a number from 0-23, you’ll need to devise a solution for converting from 24-hour to 12-hour time. (The modulus (%) operator is the tidiest method; alternatively, you could use some if/else logic.)
The clock’s “zero” should be at the top. For example, when the minute hand rolls over from 59 to 0, it should be at the top of the clock’s face. This may seem obvious, but will require some attentive hacking.
Additionally, as in the illustration shown above, and so that you (and we!) may verify your work, please show a written display of the current time using the text() command. You’ll need to use number-formatting string functions like nf() to make sure the time is displayed correctly.
All of your code should adhere to the style guidelines found in our “Style Do’s and Don’ts”.
Then, as usual for all Assignments uploaded to Autolab:
- Put the following information into comments at the top of your code: Your name; Your class section or time; Your email address, including @andrew.cmu.edu; and Assignment-06-C
- Name your project UserID
-06-c.For example, if your Andrew ID isplacebo, then your project directory (folder) name should beplacebo-06-c. Please be attentive to this! - Zip and upload your code to Autolab, using the provided instructions. Zip a directory (folder) containing this and also Assignment-06-A and Assignment-06-B.
6. Project 06 – Abstract Clock
The interactive and dynamic control of visual media over time is a core concern in new-media arts. In this open-ended Project, you are asked to create an abstract visual clock to represent the current time. (Alternatively, you may also think of this as creating a “day-long animation”.)
We ask you to browse these resources for some inspiration on strategies for representing time in unconventional ways:
http://golancourses.net/2015/lectures/visualizing-time/ (This is a lecture by Professor Golan Levin on clocks in new media art.)
http://www.cabinetmagazine.org/issues/29/foer.php (This is a fantastic history of timetelling with unconventional clocks.)
…And we also highly recommend you gawk at the lovely abstract JavaScript clocks by Vincent Toupe: http://procyonic.org/clocks/
Your clock should appear different at all times of the day, and it should repeat its appearance every 24 hours. (You are permitted to make a 12-hour clock if you prefer, or one which depicts a non-circadian rhythm, if you’re prepared to argue for it). The final piece should somehow show the current time, either literally or abstractly. For example, you might depict the rising and setting of the sun, as a way of representing the time of day, or you might show particles flowing within an hourglass, or a shadow moving across a sundial, or a collection of colored stripes….
Below is an example of the simplest possible, minimally viable “abstract clock.” (Naturally, yours will be much more interesting than this.)
// p5.js program for a very simple "abstract clock"
// Golan Levin, for 15-104 & 60-212

//--------------------------
function setup() {
    createCanvas(640, 90);
}

//--------------------------
function draw() {
    background(255, 200, 200);
    noStroke();

    // Fetch the current time
    var H = hour();
    var M = minute();
    var S = second();

    // Compute the widths of the rectangles
    var mappedH = map(H, 0,23, 0,width);
    var mappedM = map(M, 0,59, 0,width);
    var mappedS = map(S, 0,59, 0,width);
    var rectHeight = height / 3;

    // Display the rectangles.
    fill(50);
    rect(0, 0*rectHeight, mappedH, rectHeight);
    fill(100);
    rect(0, 1*rectHeight, mappedM, rectHeight);
    fill(150);
    rect(0, 2*rectHeight, mappedS, rectHeight);

    /* Uncomment this block in order to
    // Display numbers to indicate the time
    fill(255);
    text(H, 9, 0*rectHeight + 19);
    text(M, 9, 1*rectHeight + 19);
    text(S, 9, 2*rectHeight + 19);
    */
}
If you do decide to make the time literally readable, you are not permitted to use conventional numerals (Roman, Arabic, Chinese etc.)! Instead, you would have to use countable graphic elements, or a display of numeric bit patterns, or some kind of tally system, or some other system that you devise.
Try to devise a novel graphic concept, e.g. not just a clock face without numbers! Feel free to experiment with any of the graphical tools at your disposal, including color, shape, transparency, etcetera. Reactivity to the cursor is optional. Naturally, you’ll need to use p5’s hour(), minute(), second(), and millis() functions, but you’re also welcome to use day() and month() for a calendar-sensitive clock.
The goal of this assignment is to give you practice in using code to control visual design over time. Sometimes this is called animation, but the practical demands of producing a “day-long animation” illustrate the necessity of using code to achieve this.
Requirements:
- Sketch first on paper.
- No, really. Ponder things like biological time (chronobiology), ultradian rhythms and infradian rhythms, solar and lunar cycles, celestial time, geological time, historical time, psychological time, and subjective time. Read about the incredibly interesting history of timekeeping. Check out this, that, and the other link we recommended to you above.
- Create your clock in p5.js.
- Limit your design to a canvas which is no larger than 480 x 480 pixels, please.
- When you’re done, embed your p5.js sketch in a WordPress blog post on this site, using the (usual) instructions here.
- Ensure that your p5.js code is visible and attractively formatted in the post.
- In your blog post, write a paragraph or two (~100-150 words) reflecting on your process and product.
- Document your work by embedding images of paper sketches from your notebook; these could be as simple as photos captured with your phone.
- Label your project’s blog post with the Category Project-06-Abstract-Clock.
- Label your project’s blog post with your Lab Section Category too.
- All of your code should adhere to the style guidelines found in our “Style Do’s and Don’ts”.
For this assignment, we encourage you to seriously question basic assumptions about how time is represented. For example, the seemingly ubiquitous convention that we use 12 (or 24) hour time is totally arbitrary — an artifact of ancient Egyptian astronomy. Other systems have been used and proposed. Until quite recently, a six-hour day was used in Thailand. During the French Revolution, when the metric system was invented, people seriously proposed decimal time; here’s a decimal clock from the 1780s: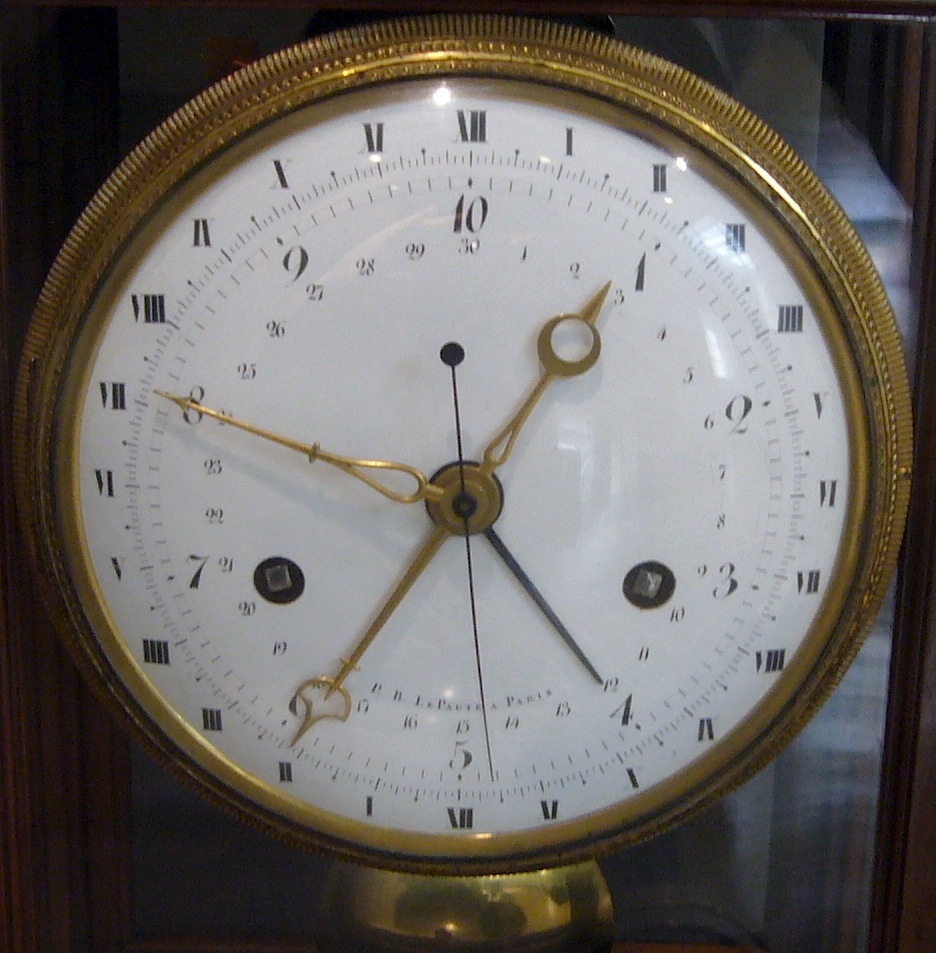
Below is some p5.js code to get you started. This example shows milliseconds that roll-over correctly, in synchrony with the advancing seconds.
var prevSec;
var millisRolloverTime;

//--------------------------
function setup() {
    createCanvas(300, 300);
    millisRolloverTime = 0;
}

//--------------------------
function draw() {
    background(255,200,200); // My favorite pink

    // Fetch the current time
    var H = hour();
    var M = minute();
    var S = second();

    // Reckon the current millisecond,
    // particularly if the second has rolled over.
    // Note that this is more correct than using millis()%1000;
    if (prevSec != S) {
        millisRolloverTime = millis();
    }
    prevSec = S;
    var mils = floor(millis() - millisRolloverTime);

    fill(128,100,100);
    text("Hour: "   + H, 10, 22);
    text("Minute: " + M, 10, 42);
    text("Second: " + S, 10, 62);
    text("Millis: " + mils, 10, 82);

    var hourBarWidth   = map(H, 0, 23, 0, width);
    var minuteBarWidth = map(M, 0, 59, 0, width);
    var secondBarWidth = map(S, 0, 59, 0, width);

    // Make a bar which *smoothly* interpolates across 1 minute.
    // We calculate a version that goes from 0...60,
    // but with a fractional remainder:
    var secondsWithFraction   = S + (mils / 1000.0);
    var secondsWithNoFraction = S;
    var secondBarWidthChunky  = map(secondsWithNoFraction, 0, 60, 0, width);
    var secondBarWidthSmooth  = map(secondsWithFraction,   0, 60, 0, width);

    noStroke();
    fill(40);
    rect(0, 100, hourBarWidth, 50);
    fill(80);
    rect(0, 150, minuteBarWidth, 50);
    fill(120)
    rect(0, 200, secondBarWidthChunky, 50);
    fill(160)
    rect(0, 250, secondBarWidthSmooth, 50);
}
So… this …should… be obvious, but you may not submit your Assignment-06-C (Simple Clock) for this Project; you’re being asked to design a clock of your own invention. Furthermore, the purpose of the code above is to provide some potentially helpful technical scaffolding for you, not to suggest that your designs ought to look like rectangular bars. This Project is an invitation to invent!
For more inspiration on timetelling, check out this brief video: