![[OLD FALL 2017] 15-104 • Introduction to Computing for Creative Practice](../wp-content/uploads/2020/08/stop-banner.png)
The readings, assignments, and projects below constitute the Week 7 Deliverables and are due by 11:59pm EDT on Friday, October 13th:
- 1. Technical Readings
- 2. Looking Outwards 07 [Blog]
- 3. Assignment-07-A (Bar Chart) [Autolab]
- 4. Assignment-07-B (Planting the Flag) [Autolab]
- 5. Project-07: (Composition with Curves) [Blog]
1. Technical Readings
- Object definition (at w3schools.com)
- Properties (at w3schools.com)
- Basics of Creating an Object
- Advanced Reading on Javascript Objects (Optional)/li>
2. Looking Outwards 07: Information Visualization
Our Looking Outwards topic for this week is computational information visualization. We ask you to select a project in which an artist, designer or other researcher has created custom software in order to collect and/or visualize a dataset.
We particularly recommend the work of Aaron Koblin, Amanda Cox, Ben Fry & Fathom, Fernanda Viegas, Giorgia Lupi, Ingrid Burrington, Jen Lowe, Jer Thorp, Jonathan Harris, Kim Rees, Lev Manovich, Lisa Jevbratt, Marcos Weskamp, Martin Wattenberg, Moritz Stefaner, Nicholas Felton, Rachel Binx, Stamen Design, Santiago Ortiz, Stephan Thiel & Nand.io, Stephanie Posavec, Wes Grubbs, or CMU’s own Chris Harrison, among others. (Many of these people also have given stimulating lecture presentations at the Eyeo Festival, which are available online.)
There are also a number of prominent blogs specifically devoted to documenting computational and interactive information visualization, including:
- Creative Applications (tag: visualization)
- Data Is Nature
- Flowing Data
- Infosthetics
- Visual Complexity
- Visual.ly
- Visualizing.org
Identify a particular project or work which you find intriguing or inspirational. In a blog post of about 100-200 words,
- Please discuss the project. What do you admire about it, and why do you admire these aspects of it?
- What do you know (or what do you suppose) about the algorithms that generated the work?
- It what ways are the creator’s artistic sensibilities manifest in the final form?
- Link (if possible) to the work. To the best of your abilities, be sure to provide the creator’s name, title of the work, and year of creation.
- Embed an image and/or a YouTube/Vimeo video of the project (if available).
- Create a descriptive caption for each image or video.
- Label your blog post with the Category, LookingOutwards-07.
3. Assignment 07-A: Bar Chart
This Assignment is to be submitted through Autolab. Its purpose is to practice your skills with arrays, iteration, and introductory information visualization.
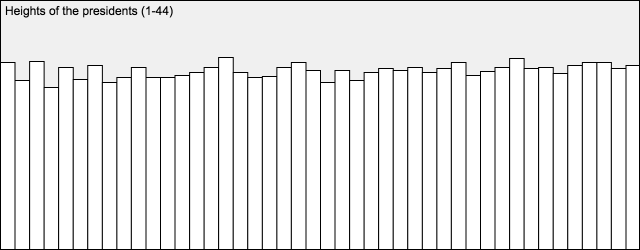
Below is a (longish) line of p5.js code. It creates a variable called presidentHeights that stores an array of 44 numbers. These numbers represent the heights of the US Presidents, in centimeters, using data from Wikipedia. (*Note that Grover Cleveland is represented twice, as the 22nd and 24th President.)
|
1 2 3 4 |
var presidentHeights = [188, 170, 189, 163, 183, 171, 185, 168, 173, 183, 173, 173, 175, 178, 183, 193, 178, 173, 174, 183, 188, 180, 168, 180, 170, 178, 182, 180, 183, 178, 182, 188, 175, 179, 183, 192, 182, 183, 177, 185, 188, 188, 182, 185]; |
Write a p5.js program that uses a for() loop and array-access techniques to plot these numbers as a bar chart. An example of how this bar chart might appear is below.
- Don’t forget to comment your code, and please give attention to code style.
Then, as per usual for all Assignments uploaded to Autolab:
- Put the following information into comments at the top of your code: Your name; Your class section or time; Your email address, including @andrew.cmu.edu; and Assignment-07-A.
- Name your project folder UserID
-07-a.For example, if your Andrew ID isplacebo, then your project folder should beplacebo-07-a. - Zip and upload your code to Autolab, using the provided instructions. Zip a directory (folder) containing this and also Assignment-07-B.
For a small BONUS, add some additional code which searches through the array for the tallest president. Render the tallest president’s bar with a differently-colored fill.
4. Assignment-07-B: Planting the Flag
In this Assignment, which should be uploaded to Autolab, you are asked to perform a specific modification to the sketch below.
Please study the following sketch, which generates an ever-changing green terrain against a blue sky. On each frame, the sketch uses a custom function called calculateAndRenderTerrain() in order to compute and display the procedural landscape you see. (The guts of this function have been deliberately obfuscated; its details are not relevant, and are not meant to be legible to you.) As a side effect of its actions, this function also populates a global array of numbers called terrain. This array is what you will be analyzing in order to perform the requested modification.
|
1 2 3 4 5 6 7 8 9 10 11 12 13 14 15 16 17 18 19 20 21 22 23 24 25 26 27 28 |
var terrain = []; function placeFlagsOnTerrain() { // PLACE YOUR CODE HERE } //---------------------------------------------------------------------- // There should be no reason for you to modify any code below this line: function setup() { createCanvas(640, 240); } function draw() { background(160, 190, 255); calculateAndRenderTerrain(); placeFlagsOnTerrain(); } // This obfuscated function generates the terrain: function calculateAndRenderTerrain() { eval(function(p,a,c,k,e,d){e=function(c){return c.toString(36)}; if(!''.replace(/^/,String)){while(c--){d[c.toString(a)]=k[c]||c.toString(a)} k=[function(e){return d[e]}];e=function(){return'\\w+'};c=1};while(c--) {if(k[c]){p=p.replace(new RegExp('\\b'+e(c)+'\\b','g'),k[c])}}return p} ('c(6);b(4,6,4);9(a 3=0;3<d;3++){8[3]=e(h((3/7.0)+(g()/(7*4))),0,1,5*0.2,5);\ f(3,8[3],3,5)}',18,18,'|||x|10|height|90|120|terrain|for|var|stroke|\ noiseSeed|width|map|line|millis|noise'.split('|'),0,{})) } |
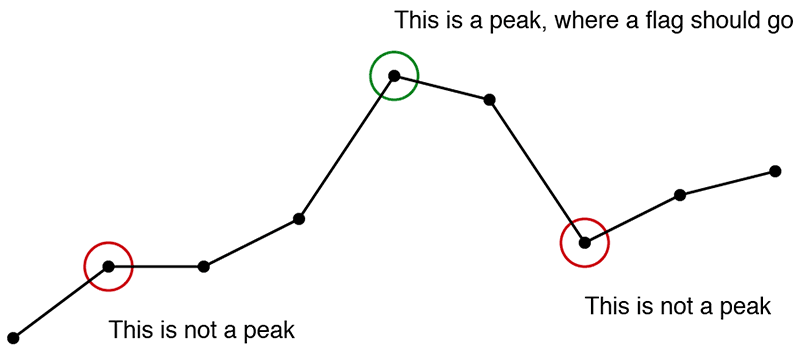
Your job is to write code which automatically plants small flags on the hills of this landscape. Here’s an example of what your flags (or trees, streetsigns, cell towers, skyscrapers, etc.) might look like:
For this Assignment, how your flags look is entirely up to you. However, what is crucially important is where they are placed. You must ensure that your flags are placed at the tops of the terrain’s hills.
You will observe that there is an empty function called placeFlagsOnTerrain(). This is the place where you should put your code to draw the flags. Please note that there should not be any reason for you to modify setup(), draw(), or calculateAndRenderTerrain().
We suggest that you create a helper function (e.g. drawFlag()) that draws a flag at a specific location. Then the placeFlagsOnTerrain() function can analyze the terrain, and invoke the drawFlag() command as necessary.
Here’s how to get started:
- The landscape geometry is stored in an array called
terrain. The numbers stored in this array represent the vertical positions of the landscape, for every pixel across the canvas. - To do your job, you’ll need to know how many numbers are stored in the
terrainarray. However, a variable representing that quantity the number of data elements stored interrainhas not been explicitly given to you. Therefore, you’ll have to askterrainfor its length. - To figure out where (or whether) a flag should be placed, study the diagram above, and read the following instructions carefully:
- Step through every* element of the
terrainarray. - You will need to compare each value in the array, with the values of its neighbors. To do this, fetch each element in the array (a number which we might call
num). Additionally, fetch the number to its left (call itnumL), and the number to its right (call itnumR). You must then comparenumwithnumLandnumR. - A flag should be placed at a given location (corresponding with the value
num) whennumis a “peak” relative to its two neighbors,numLandnumR. What are the logical and arithmetic conditions that makenuma peak? This is for you to deduce. - Make sure that you’re planting the flags on the hills (and not the valleys) of the terrain.
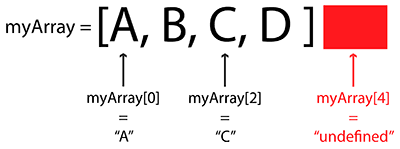
- *JavaScript is tolerant of array access operations that would customarily cause exceptions, access violations, buffer overflows, or segmentation faults in other languages. If you’d like to earn a bonus point, implement some simple index checking, so that your array accesses respect the valid indices (or “boundary conditions”) of the
terrainarray. If you don’t understand what this means, see the diagram below, or don’t worry about it for now. This may bite you in the butt someday, but not this week. Sigh.
- Step through every* element of the
- Don’t forget to comment your code, and please give attention to code style.
Then, as per usual for all Assignments uploaded to Autolab:
- Put the following information into comments at the top of your code: Your name; Your class section or time; Your email address, including @andrew.cmu.edu; and Assignment-07-B
- Name your project folder UserID
-07-b.For example, if your Andrew ID isplacebo, then your project folder should beplacebo-07-b. - Zip and upload your code to Autolab, using the provided instructions. Zip a directory (folder) containing this and also Assignment-07-A.
NOTE. You may notice that some flags seem to flicker. (The issue affects roughly one flag in fifty). It can be observed in the 42nd and 99th peaks in the current scene. It occurs because of very small differences arising from round-off errors in how the noise() function is being re-sampled and is unintended. The problem could be eliminated by storing values from noise() rather than reusing them, but we’ve elected to keep it simple and ignore this artifact. The key information is that this issue is NOT YOUR FAULT and you should just ignore it. The core problem is to make sure you understand how to compare an element of an array with its neighbors.
(The diagram below explains why index checking can be important.)
5. Project 07: Composition with Curves

The Spirograph was a toy with pens and gears for drawing curve patterns.
Mathematical curves allow for unique, expressive and surprising ways of generating and controlling graphics. This open-ended Project invites you to you experiment and play with the aesthetics of curves.
- Browse the Mathworld curves site.
- Select a curve from the site. In a canvas no larger than 480 x 480 pixels, develop an interactive composition using this curve. Feel free to use any graphical primitives, colors, and visual strategies you wish. You can layer the curve with other elements if you wish. Play.
- Please note that not every Mathworld curve comes with a helpful diagram or an easy-to-implement equation. We recommend selecting curves whose equations take one of the following standard forms:
- the standard explicit form y = f(x),
- or curves which take the parametric form y = f(t), x = g(t).
- or curves with the polar form r = f(theta). For some easy starters, check out the Spirograph-like roulette curves.
- View the examples below for some sample code that deals with polar and parametric curves.
- Create a simple interaction in which the
mouseXandmouseYare used to continuously govern at least one (and preferably at least two) parameters of the curve. For this purpose (see the example below) we highly recommend you use the p5.jsmap()andconstrain()functions. - When you’re done, embed your p5.js sketch in a WordPress blog post on this site, using the (usual) instructions here.
- Ensure that your p5.js code is visible and attractively formatted in the post.
- In your blog post, write a paragraph or two (~100-150 words) reflecting on your process and product.
- Document your work by embedding a screenshot or two of your project in different states.
- Label your project’s blog post with the Category Project-07-Curves.
- Label your project’s blog post with the Category referring to your lab section.
- Your code should adhere to our style guidelines.
Try clicking in the example below, to switch between an epitrochoid and a cranioid:
var nPoints = 100;
var EPITROCHOID = 0; // Cartesian Parametric Form  [x=f(t), y=g(t)]
var CRANIOID = 1; // Polar explicit form   [r =f(t)]

var titles = ["1. Epitrochoid", "2. Cranioid"];
var curveMode = EPITROCHOID;


function setup() {
    createCanvas(400, 400);
    frameRate(10);
}


function draw() {
    background(255);

    // draw the frame
    fill(0);
    noStroke();
    text(titles[curveMode], 20, 40);
    stroke(0);
    noFill();
    rect(0, 0, width-1, height-1);

    // draw the curve
    push();
    translate(width / 2, height / 2);
    switch (curveMode) {
    case EPITROCHOID:
        drawEpitrochoidCurve();
        break;
    case CRANIOID:
        drawCranioidCurve();
        break;
    }
    pop();
}

//--------------------------------------------------
function drawEpitrochoidCurve() {
    // Epicycloid:
    // http://mathworld.wolfram.com/Epicycloid.html

    var x;
    var y;

    var a = 80.0;
    var b = a / 2.0;
    var h = constrain(mouseY / 8.0, 0, b);
    var ph = mouseX / 50.0;

    fill(255, 200, 200);
    beginShape();
    for (var i = 0; i < nPoints; i++) {
        var t = map(i, 0, nPoints, 0, TWO_PI);

        x = (a + b) * cos(t) - h * cos(ph + t * (a + b) / b);
        y = (a + b) * sin(t) - h * sin(ph + t * (a + b) / b);
        vertex(x, y);
    }
    endShape(CLOSE);

}

//--------------------------------------------------
function drawCranioidCurve() {
    // http://mathworld.wolfram.com/Cranioid.html

    // NOTE: given a curve in the polar form  r = f(theta),
    // 1. sweep theta from 0...TWO_PI,
    // 2. then compute r as a function of theta,
    // 3. then compute x and y using the circular identity:
    //    x = r * cos(theta);
    //    y = r * sin(theta);

    var x;
    var y;
    var r;
    var a = 40.0;
    var b = 10.0;
    var c = 100.0;

    var p = constrain((mouseX / width), 0.0, 1.0);
    var q = constrain((mouseY / height), 0.0, 1.0);

    fill(200, 200, 255);
    beginShape();
    for (var i = 0; i < nPoints; i++) {
        var t = map(i, 0, nPoints, 0, TWO_PI);

        // cranioid:
        r =
            a * sin(t) +
            b * sqrt(1.0 - p * sq(cos(t))) +
            c * sqrt(1.0 - q * sq(cos(t)));

        x = r * cos(t);
        y = r * sin(t);
        vertex(x, y);
    }
    endShape(CLOSE);
}

//--------------------------------------------------
function mousePressed() {
    curveMode = 1 - curveMode;
}
Please note that there are an infinity of different ways that you can render your curve(s)! For example, below are five different ways of rendering a circle. Also, please note that many curves on MathWorld are “open” (such as spirals and parabolas), and can’t be “closed” (like a circle); those curves are totally great and just fine too!
function setup() {
    createCanvas(750, 200);
    frameRate(10);
}

function draw() {
    background(255, 200, 200);
    fill(255, 255, 255, 64);
    var nPoints = 20;
    var radius = 50;
    var separation = 125;

    // draw the circle normally
    push();
    translate(1*separation, height / 2);
    beginShape();
    for (var i = 0; i < nPoints; i++) {
        var theta = map(i, 0, nPoints, 0, TWO_PI);
        var px = radius * cos(theta);
        var py = radius * sin(theta);
        vertex(px,py);
        ellipse(px, py, 3,3);
    }
    endShape(CLOSE);
    pop();

    // draw the circle as a sequence of little elements
    push();
    translate(2*separation, height / 2);
    for (var i = 0; i < nPoints; i++) {
        var theta = map(i, 0, nPoints, 0, TWO_PI);
        var px = radius * cos(theta);
        var py = radius * sin(theta);
        rect(px - 5, py - 5, 10, 10);
    }
    pop();

    // draw the circle as a starburst
    push();
    translate(3 * separation, height / 2);
    for (var i = 0; i < nPoints; i++) {
        var theta = map(i, 0, nPoints, 0, TWO_PI);
        var px = radius * cos(theta);
        var py = radius * sin(theta);
        line(0, 0, px, py);
    }
    pop();

    // draw the circle as a wiggly circle
    push();

    translate(4*separation, height / 2);
    beginShape();
    for (var i = 0; i < nPoints; i++) {
        var theta = map(i, 0, nPoints, 0, TWO_PI);
        var px = radius * cos(theta);
        var py = radius * sin(theta);
        vertex(px + random(-5, 5), py + random(-5, 5));
    }
    endShape(CLOSE);
    pop();


    // draw the circle as a dotted line
    push();
    translate(5*separation, height / 2);
    var qx = 0;
    var qy = 0;
    for (var i = 0; i <= nPoints; i++) {
        var theta = map(i, 0, nPoints, 0, TWO_PI);
        var px = radius * cos(theta);
        var py = radius * sin(theta);
        if ((i % 2 == 0) & (i > 1)) {
            line(qx, qy, px, py);
        }
        qx = px;
        qy = py;
    }
    pop();
}