Sharon Yang Project 07 Curves

Project

/*Sharon Yang
Section C
junginny
Project-07
*/

var nPoints = 100;

function setup() {
  createCanvas(480, 480);
}

function draw() {
  background(254, 200, 200);
  push();
  translate(width/2, height/2);
  rotate(PI); //rotating the shape 180 degrees
  drawHeart(); //call the function to draw the shape
  pop();
}

function drawHeart() { //function to create the heart shape
  noStroke();
  if (mouseX <= 240 & mouseY <= 240) { //the mouse X and Y determines the color of the shape
    fill(255, 0, 0); //red
  }
  else {
    fill(200, 25, 60); //burgundy
  }
  beginShape(); //create the heart shape
  for (var i = 0; i < nPoints; i++) {
    var t = map (i, 0, nPoints, 0, TWO_PI);
    var consMouseX = constrain(mouseX,0,width/2);
    var consMouseY = constrain(mouseY,0,height/2.2);//constrain to stay within the canvas border 
    x = 16 * pow(sin(t), 3);
    y = 13 * cos(t) - 5 * cos(2 * t) - 2 * cos(3 * t) - cos(4 * t); //formula for the shape
    x = map(x,0,16,0,consMouseX);
    y = map(y,0,16,0,consMouseY);
    vertex (x, y)
  }
  endShape(CLOSE);
}

This project was particularly difficult to start as a mathematical equation also had to be incorporated for the geometric shape. However, once making the shape with begin and end shape, it was quite straightforward to make the shape increase and decrease in size and make the color change with mouse X and Y. The following are the screenshots of the varying image with different mouse X and Y.

Project 07 – Sean McGadden

Project 07 Curves

This project was super interesting to make and play with. Some of the math involved with the manipulation of more complex curves eluded me a little. However, I found overlaying the Dumbbell Curve and Devil Curve to be really pleasing to spin around and mess with the sizing of them. This was a difficult assignment and I wish I could’ve para-metricized the curves more into a perspective or abstract three dimensional volumes. This project looks really flat and I think after more practice I would like to impose more perspective lines and curves that reach beyond the canvas in a more interesting composition.


The Dumbell Curves make nice looking clover shapes that have some hidden shapes behind it from the Devil’s Curve.

sketch

//Sean McGadden
//smcgadde@andrew.cmu.edu
//Project 07
//Section C

 
//Drawing Setup
function setup() {
    createCanvas(640, 400);
    
}

//Chosing to call from curveX or curveY
function draw() {
  background(160, 190, 255);
    push();
    translate(width / 2, height / 2);
    drawCurve(false, false);
    drawCurve(false, true);
    drawCurve(true, true);
    drawCurve(true, false);
    pop();    
}

//Drawing Dumbell Curve 
//basic varible defintion and instantiation of Dumbell Curve
function drawCurve(isDumbell, isFlipped) {
    
    var x;
    var y;
    var nPoints = 100;
    
    var percX = mouseX / 640.0;
    var percY = mouseY / 400.0;
    rotate(TWO_PI * percY);
    
    var a = 200.0 * percX;
    var t 
    
    stroke("lightcyan");
    fill("green");
    beginShape();
    for (var i = 0; i < nPoints; i++) {
        var t = map(i, 0, nPoints, 0, TWO_PI);
        
        x	=	curveX(isDumbell, a, t);
        y	=	curveY(isDumbell, a, t);
        
        if (isFlipped) {
            var temp = x;
            x = y;
            y = temp;
        }
        vertex(x, y);
    }
    endShape(CLOSE);
}

//Returns x value of the desired curve
//Choosing between Dumbell Curve or the Devil's Curve based on a and t
//Devil's Curves uses thrid variable called b initialized below
function curveX(isDumbell, a, t) {
    if(isDumbell){
        return a * sin ( t);
    } else {
        var b = a / 2.0;
        return cos(t) * sqrt(((a * a * sin(t) * sin(t))-(b * b * cos(t) * cos(t)))/((sin(t) * sin(t)) - (cos(t) * cos(t))));
    }
    
}
//Returns y value of the desired curve
//Choosing between Dumbell Curve or the Devil's Curve based on a and t for the 
//Devil's Curves uses thrid variable called b initialized below
function curveY(isDumbell, a, t) {
    if(isDumbell){
        return a * sin(t) * cos(t);
    } else {
        var b = a / 2.0;
        return sin(t) * sqrt(((a * a * sin(t) * sin(t))-(b * b * cos(t) * cos(t)))/((sin(t) * sin(t)) - (cos(t) * cos(t))));
    }
}


Sean McGadden

Project 7 Liz Maday

emadayflames

//Elizabeth Maday
//Section A
//emaday@andrew.cmu.edu
//Project 7

var nPoints = 450;

//background color
var r = 0;
var g = 0;
var b = 0;
//red fire colors
var r1 = 255;
var b1 = 0;
var g1 = 0;
var r2 = 255;
var g2 = 85;
var b2 = 0;
var r3 = 255;
var g3 = 164;
var b3 = 0;
var r4 = 255;
var g4 = 204;
var b4 = 0;
//blue fire colors
var R1 = 7;
var G1 = 83;
var B1 = 130;
var R2 = 27;
var G2 = 125;
var B2 = 186;
var R3 = 73;
var G3 = 174;
var B3 = 237;
var R4 = 105;
var G4 = 185;
var B4 = 234;
//shadow colors red
var rr = 108; //inside
var gg = 22;
var bb = 0;
var rrr = 255;//outside
var ggg = 58;
var bbb = 0;
//shadow colors blue
var RR = 4; //inside
var GG = 22;
var BB = 33;
var RRR = 22; //outside
var GGG = 63;
var BBB = 89;
//water colors blue
wr = 47;
wg = 102;
wb = 191;
//water colors green
WR = 12;
WG = 201;
WB = 72;

function setup() {
	createCanvas(400, 400);
	frameRate(6);
	strokeWeight(0.7);
}

function mouseClicked() {	
	if (r1 === 255) { 
		r1 = R1;
		g1 = G1;
		b1 = B1;
		r2 = R2;
		g2 = G2;
		b2 = B2;
		r3 = R3;
		g3 = G3;
		b3 = B3;
		r4 = R4;
		g4 = G4;
		b4 = B4;
		r = 4; 
	    g = 22;
	    b = 70;
	    rr = RR;
	    gg = GG;
	    bb = BB;
	    rrr = RRR;
	    ggg = GGG;
	    bbb = BBB;
	    wr = WR;
	    wg = WG;
	    wb = WB;
	} else if (r1 === 7) { 
		r1 = 255;
		g1 = 0;
		b1 = 0;
		r2 = 255;
		g2 = 85;
		b2 = 0;
		r3 = 255;
		g3 = 164;
		b3 = 0;
		r4 = 255;
		g4 = 204;
		b4 = 0;
		r = 0;
		g = 0;
		b = 0;
		rr = 108;
		gg = 22;
		bb = 0;
		rrr = 255;
		ggg = 58;
		bbb = 0;
		wr = 47;
		wg = 102;
		wb = 191;
	}
}

function draw() {
	background(r, g, b);
	translate(200, 200);
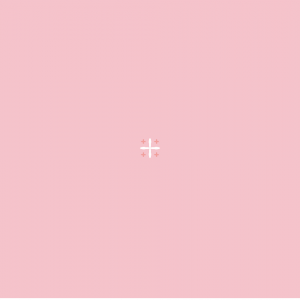
    shadows(0, 0); 
    fire(0, 0);
    water2(0, 0);  	
    textSize(15);
    text('Click!', -170, 170);
}

function shadows(x, y) {
	translate(x, y);
	push();
    ellipseMode(CORNER);
    fill(rrr, ggg, bbb); //outside
    ellipse(-35, 5, random(125, 130), random(40, 50));
    fill(rr, gg, bb); //inside
    ellipse(-25, 5, 70, random(20, 30));
	pop();
}

function fire(x, y) {
	translate(x, y);
	beginShape();
	fill(r1, g1, b1);
	//outermost part
	for (var i = 0; i < nPoints; i += 1) {
		var num = random(1, 1.4);
		var r = num - sin(theta);
		var theta = map(i, 0, nPoints, 0, TWO_PI);
		var grow = (dist(mouseX, mouseY, width/2, height/2))/3.5;
        var x = grow * (r*cos(theta));
        var y = grow * (r*sin(theta));
        vertex(x, y);
	}
	endShape(CLOSE);
	//second to outermost part
	beginShape();
	fill(r2, g2, b2);
	for (var i = 0; i < nPoints; i += 1) {
		var num = random(0.9, 1.2);
		var r = num - sin(theta);
		var theta = map(i, 0, nPoints, 0, TWO_PI);
		var grow = (dist(mouseX, mouseY, width/2, height/2))/3.5;
        var x = grow * (r*cos(theta));
        var y = grow * (r*sin(theta));
        vertex(x, y);
	}
	endShape(CLOSE);
    //second to innermost part
	beginShape();
	fill(r3, g3, b3);
	for (var i = 0; i < nPoints; i += 1) {
		var num = random(0.6, 1);
		var r = num - sin(theta);
		var theta = map(i, 0, nPoints, 0, TWO_PI);
		var grow = (dist(mouseX, mouseY, width/2, height/2))/3.5;
        var x = grow * (r*cos(theta));
        var y = grow * (r*sin(theta));
        vertex(x, y);
	}
	endShape(CLOSE);   
    //innermost part
	beginShape();
	fill(r4, g4, b4);
	for (var i = 0; i < nPoints; i += 1) {
		var num = random(0.2, 0.5);
		var r = num - sin(theta);
		var theta = map(i, 0, nPoints, 0, TWO_PI);
		var grow = (dist(mouseX, mouseY, width/2, height/2))/3.5;
        var x = grow * (r*cos(theta));
        var y = grow * (r*sin(theta));
        vertex(x, y);
	}
	endShape(CLOSE);	
}

function water2(x, y) {
	translate(x, y);
	fill(wr, wg, wb);
	for (var i = 0; i < nPoints; i += 1) {
        var x = dist(mouseX, mouseY, width/2, height/2) * 1.2;
        var y = dist(mouseX, mouseY, width/2, height/2) * 1.2;
        var size = dist(mouseX, mouseY, width/2, height/2)/4;
		ellipse(x, y, size, size);
		push();
		fill(255);
		ellipse(x - 2, y, size - (size*0.6), size - (size*0.6));
		pop();

		var x1 = (dist(mouseX, mouseY, width/2, height/2)) * -1;
		var y1 = dist(mouseX, mouseY, width/2, height/2);
		var size1 = dist(mouseX, mouseY, width/2, height/2)/5;
		ellipse(x1, y1, size1, size1);
		push();
		fill(255);
		ellipse(x1 - 2, y1, size1 - (size1*0.6), size1 - (size1*0.6));
		pop();

		var x2 = (dist(mouseX, mouseY, width/2, height/2)) * -1.2;
		var y2 = (dist(mouseX, mouseY, width/2, height/2)) * -1.2;
		var size2 = dist(mouseX, mouseY, width/2, height/2)/4;
		ellipse(x2, y2, size2, size2);		
		push();
		fill(255);
		ellipse(x2 - 2, y2, size2 - (size2*0.6), size2 - (size2*0.6));
		pop();

		var x3 = (dist(mouseX, mouseY, width/2, height/2));
		var y3 = (dist(mouseX, mouseY, width/2, height/2)) * -1;
		var size3 = dist(mouseX, mouseY, width/2, height/2)/5;
		ellipse(x3, y3, size3, size3);	
		push();
		fill(255);
		ellipse(x3 - 2, y3, size3 - (size3*0.6), size3 - (size3*0.6));
		pop();

		var x4 = width/2;
		var y4 = (dist(mouseX, mouseY, width/2, height/2)) * -1.5;
		var size4 = dist(mouseX, mouseY, width/2, height/2)/5;
		ellipse(x4 - 200, y4, size4, size4);	
		push();
		fill(255);
		ellipse(x4 - 200, y4, size4 - (size4*0.6), size4 - (size4*0.6));
		pop();

		var x5 = width/2;
		var y5 = (dist(mouseX, mouseY, width/2, height/2)) * 1.5;
		var size5 = dist(mouseX, mouseY, width/2, height/2)/5;
		ellipse(x5 - 200, y5, size5, size5);	
		push();
		fill(255);
		ellipse(x5 - 200, y5, size5 - (size5*0.6), size5 - (size5*0.6));
		pop();
	}
}


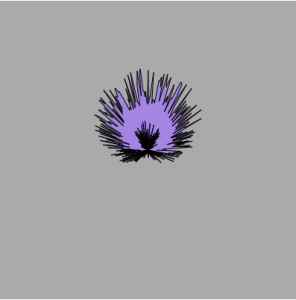
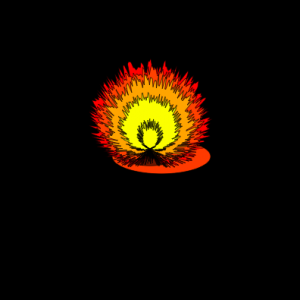
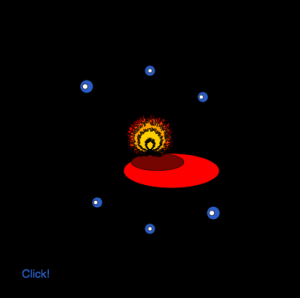
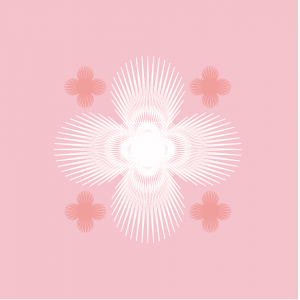
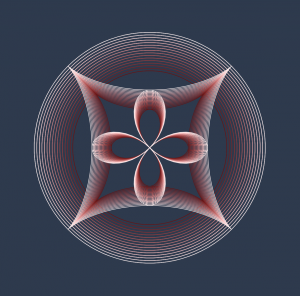
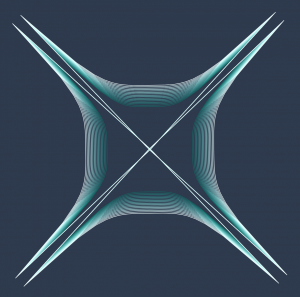
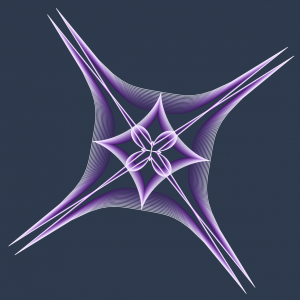
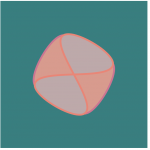
I liked working on this project because I gained a better understanding of how extensively you can use math in P5. I discovered how to make the flames by accident by randomizing one of the values in the equation of the curve. Once this happened, I was able to come up with a concept for the rest of the project. I liked working with colors and the mouseIsPressed conditional to change the image from red fire to blue fire. In the future, I would like to have a better ability to implement the map() function, as I feel that it would have been useful for my goals in this project.

Kai Zhang-Looking Outwards-07

Fathom

Fathom is a database analysis platform that understands data and converts them into a visualization form. There are various facets of the data analyzation happening within this platform.

Partnering with State Street, they built a visualization depicting the scale, growth, and complexity of 200 years of finance. Fathom combed through a database of 40,000 financial indicators and built prototypes to dig into selected data. Of the many possible stories to tell, they focused on four facets of growth: data, connectivity, complexity, and scope.

They also have partnership with On Being to create new ways of understanding the 14 years of diaglogs archived in the database. By doing this can help with On Going’s pattern of conversation happened and used visual representation that links the useful information of the same categories that for the purpose of developing new methodologies.


The part that fascinates me about this platform is how it’s super flexible about the utility in different fields of practice. The developers are devoted to create easier to understand database “translator” that everyone is able to understand to help people get the most out of their data. The data are most useful when it’s more straitforward and easeir to understand. The methodologies introduced is very meaningful for the evolution of database management in firms.

https://fathom.info/

Project 07 Curves – Sara Frankel

sketch

// Sara Frankel
// sfrankel
// Project 07
// Section A

function setup() {
    createCanvas(480, 480); 
}

var perwidth = 480.0; 
var constrainmin = 1.0;
var constrainmax = 1.4;

function draw() {
	
	background('pink');
	var changecenter = width/4 * mouseX / perwidth * constrain(1 - (mouseY / perwidth), constrainmin, constrainmax); // variable to insert into drawDevilsCurve to help assiciate its position from the 
																													// center curbe proportionately in both the x and y direction with the mouse

	//center curve
	drawDevilsCurve(true, width/2, height/2, 180, 150, 100);
	drawDevilsCurve(false, width/2, height/2, 180, 150, 100);
	
	//top left curve
	drawDevilsCurve(true, width/2 - changecenter, height/2 - changecenter, 40, 30, 35);
	drawDevilsCurve(false, width/2 - changecenter, height/2 - changecenter, 40, 30, 35);
	
	//bottom left curve
	drawDevilsCurve(true, width/2 - changecenter, height/2 + changecenter, 40, 30, 35);
	drawDevilsCurve(false, width/2 - changecenter, height/2 + changecenter, 40, 30, 35);

	//top right curve
	drawDevilsCurve(true, width/2 + changecenter, height/2 - changecenter, 40, 30, 35);
	drawDevilsCurve(false, width/2 + changecenter, height/2 - changecenter, 40, 30, 35);

	//bottom right curve
	drawDevilsCurve(true, width/2 + changecenter, height/2 + changecenter, 40, 30, 35);
	drawDevilsCurve(false, width/2 + changecenter, height/2 + changecenter, 40, 30, 35);
}

//-------------------------------------------------------

function drawDevilsCurve(isSide, centerX, centerY, maxA, maxB, nPoints) {
	
	var x;
	var y;
	var hx = mouseX / perwidth; //puts mouseX on a percent scale
	var hy = mouseY / perwidth; //mouseY on a percent scale
	var a = maxA * hx; //correlates maxA and hx for shape below
	var b = maxB * hy; //correlates maxB and hy for shape below
	var t = radians(2 * a); //angle of shape in relation to a

	beginShape();
	for (var i = 0; i < nPoints; i++) { //for loop to create the devils curve shape

		colorMode(HSB);
		stroke(280 * i, map(100 - i, 100, 0, 60, 0), 100 * i); //maps the color so that each curve corrolates in color (dependant on how many points are on the shape) in terms of pink
		
		var t = map(i, 0, nPoints, 0, TWO_PI); //maps the angle of the curve to corrolate with the number of points and i
		x = cos(t) * sqrt(((a * a) * (sin(t) * sin(t)) - (b * b) * (cos(t) * cos(t)) / (sin(t) * sin(t)) - (cos(t) * cos(t))));
		y = sin(t) * sqrt(((a * a) * (sin(t) * sin(t)) - (b * b) * (cos(t) * cos(t)) / (sin(t) * sin(t)) - (cos(t) * cos(t))));
		
		if(isSide){ //if statement that flips the curve over y=x so that it creates the same curve perpendicular to the original
			var temp = x;
			x = y;
			y = temp;
		}

		vertex(x + centerX, y + centerY); //draws curve
		vertex(-x + centerX, -y + centerY);	//draws inverse of curve (gives it the cool pointy look)

	}

	endShape(CLOSE);
	noFill();


}

When I was looking through the catalog of curves, there was something that caught my eye about the devils curve. The proportions and visual aspects fascinated me. I decided to make almost these flower shapes in proportion of one another (as well as the mouse) and track along more or less the y = x plane. Screenshots as follow:


Pictured is what to expect when the shape is almost as small as it can go. It is a plus shape surrounded by smaller “+”s.


Pictured is medium size expected when x and y are closer to the center

Jisoo Geum – Looking Outwards 07

Interstitial Fragment Processor (2007)  – Goland Levin

link:  http://www.flong.com/projects/ifp/

Interstitial Fragment Processor is an interactive system that maps and visualizes the negative space created by our bodies. The sensor records and collects data from the silhouette of people’s body, and then animates shapes that are based on the holes created from the silouette. The shapes in the screen eventually fall down and create sound effects as it hits the bottom of the screen. Although the artist Goland Levin has numerous other works that are based on interaction design and physical computing, I found Interstitial Fragment Processor the most interesting due to its sound element. Also, I thought that the idea of visualizing and mapping the shapes of our body was a unique topic within the category of data art. I also think the artist’s vision of creating works that provide rich interactive experience is best represented through Interstitial Fragment Processor since the software urges people to make different poses in order to see more of the artwork. The artistic sensibilities are best portrayed through the sound and animation in this work since these features effectively emphasize the physical and sensible nature of the work. In terms of algorithms, the artist built a spontaneous performance system for audiovisual improvisations and a synthetic visualization of the mass created by our body. The software can somewhat accurately outline the negative space of our bodies even when they are constantly moving, which is why I appreciate the building of this system.


Universo de Emociones // PalauGea

The Universe of Emotions project by PalauGea is a data visualization project based on the concept of emotions as a cosmic network of elements. By visualizing these emotions, PalauGea hopes to help people understand their moods. This graphic map teaches emotional intelligence.

Graphic Map, Universo de Emociones, PaluaGea

There are a total of 307 emotions represented, as well as documented in their text, Dictionary of Affective Emotions and Phenomena. The emotions are then structured into four levels based on their degree of importance, starting largely with 6 main emotional basins.

The universe is the entirety of space, time and any form of substance and energy. – Eduard Punset

Not only is the project aesthetically beautiful, but it is rich in information. There are multiple layers at which the data begins to interact which in turn creates the possibility of more inferences or perspectives.

As these emotions begin to develop relationships between each other, they are grouped into trios, creating different triangulations. These relationships show their interrelated properties.

Detail: Graphic Map zoom, Universo de Emociones, PaluaGea

By using algorithms based on cosmic properties such as the idea of the circle and the halo, which are key qualities of our galaxy, the Milky Way. These networks, inspired by a system we are already familiar with, helps to create a salient visualization.

Read more about the project here!

Kai Zhang-Project-07-Curves

sketch

//Kai Zhang
//Section B
//kaiz1@andrew.cmu.edu
//Project-07

var nPoints = 100;

function setup() {
    createCanvas(600, 600);
    colorMode(HSB, 100);
}

function draw() {
    background(60, 40, 30);
    angleMode(RADIANS);

    translate(width / 2, height / 2);
    rotate(-atan((mouseX - 300) / (mouseY - 300))); //rotate the object along with mouse

    for (var m = 50; m < 130; m += 5) {
        stroke(mouseX / 6, 130 - m, m - 10); // gives the radient curve colors
        drawdevilsCurve(m); // generates a series of curves

        stroke(mouseX / 6, 130 - m, m - 10);
        drawastroidpedalCurve(m);
    }

}

function drawdevilsCurve(v) {
    var x;
    var y;
    
    var a = (mouseX - 300) / 3 * (100 + v) / 100;
    var b = (mouseY - 300) / 3 * (100 + v) / 100;
    
    noFill();
    beginShape(); // draw the devil curves
    for (var i = 0; i < nPoints; i++) {
        var t = map(i, 0, nPoints, 0, TWO_PI);
        x = cos(t) * sqrt((pow(a, 2) * pow(sin(t), 2) - pow(b, 2) * pow(cos(t), 2)) / (pow(sin(t), 2) - pow(cos(t), 2)));
        y = sin(t) * sqrt((pow(a, 2) * pow(sin(t), 2) - pow(b, 2) * pow(cos(t), 2)) / (pow(sin(t), 2) - pow(cos(t), 2)));
        vertex(x, y);
    }
    endShape(CLOSE);

    beginShape(); // draw the devil curves 90 degree rotated
    for (var i = 0; i < nPoints; i++) {
        var t = map(i, 0, nPoints, 0, TWO_PI);
        y = cos(t) * sqrt((pow(a, 2) * pow(sin(t), 2) - pow(b, 2) * pow(cos(t), 2)) / (pow(sin(t), 2) - pow(cos(t), 2)));
        x = sin(t) * sqrt((pow(a, 2) * pow(sin(t), 2) - pow(b, 2) * pow(cos(t), 2)) / (pow(sin(t), 2) - pow(cos(t), 2)));
        vertex(x, y);
    }
    endShape(CLOSE);
    
}

function drawastroidpedalCurve(v) {
    var x;
    var y;
    
    var a = (mouseX - 300) / 3 * (100 + v) / 100;
    var b = (mouseY - 300) / 3 * (100 + v) / 100;
    
    noFill();
    beginShape(); // draw the pedals
    for (var i = 0; i < nPoints; i++) {
        var t = map(i, 0, nPoints, 0, TWO_PI);
        x = a * cos(t) * pow(sin(t), 2);
        y = a * sin(t) * pow(cos(t), 2);
        vertex(x, y);
    }
    endShape(CLOSE);

    beginShape(); // draw the astroids
    for (var i = 0; i < nPoints; i++) {
        var t = map(i, 0, nPoints, 0, TWO_PI);
        x = a * pow(cos(t), 3);
        y = a * pow(sin(t), 3);
        vertex(x, y);
    }
    endShape(CLOSE);


}

In this project, I’ve used the combination of a few equations to generate my curves: the devil curve, the astroid curve, and the pedal curve.

(URL: http://mathworld.wolfram.com/AstroidPedalCurve.html; http://mathworld.wolfram.com/DevilsCurve.html)

I was looking to find curves that are dual symmetrical in respect to both axis. And I used for loop technique to create an array of radient color curves. Also as I move the mouse, the curves will expand, shrink, and changes color, because I’ve embedded variables that changes it. I also used arctangent to deduce the mouse orientation to the origin and then the curves will rotate as I move my mouse around. Here are three different satate of the curves.

Alice Fang – Project 7

click me!

/*
Alice Fang
Section E
acfang@andrew.cmu.edu
Project-07-Curves
*/

// http://mathworld.wolfram.com/EightCurve.html  

// click to begin! and keep clicking to see it change! 

var nPoints = 100;
var clickCount = 0;

function setup() {
    createCanvas(400, 400);
    frameRate(10);
    strokeWeight(3);
    noFill();
}

function draw() {
    background(0, 128, 128);
    var rad; // scale of expansion (how much wider the petal becomes)
    var angle; // angle of rotation the curve is translated

    for (i = 0; i < clickCount; i++) {
    	rad = 0.1 * i; // becomes wider with every click
    	angle = 30 * i; // rotates with every click
    }

    // curve in top right corner
    push();
    translate(3 * width / 4, height / 4);
    rotate(radians(angle + 45));
    drawCurve(random(0, 255), rad); //random color, angle
    pop();

    // curve in bottom left corner
    push();
    translate(width / 4, 3 * height / 4);
    rotate(radians(angle + 45));
    drawCurve(random(0, 255), rad);
    pop();

    // curve in top left corner
    push();
    translate(width / 4, height / 4);
    rotate(radians(angle - 45));
    drawCurve(random(0, 255), rad);
    pop();

    // curve in bottom right corner
    push();
    translate(3 * width / 4, 3 * height / 4);
    rotate(radians(angle - 45));
    drawCurve(random(0, 255), rad);
    pop();

    // center curve
    push();
    translate(width / 2, height / 2);
    rotate(radians(angle + 90))
    drawCurve(random(0, 255), rad);
    pop();

    // perpendicular center curve
    push();
    translate(width / 2, height / 2);
    rotate(radians(angle));
    drawCurve(random(0, 255), rad);
    pop();
   
}

// draw eight curve
function drawCurve(c, r) {
    var x;
    var y; 
    var a = constrain(mouseX, 0, width / 2);
    
    stroke(c);
    beginShape();
    for (var i = 0; i < nPoints; i++) {
        var t = map(i, 0, nPoints, 0, TWO_PI); // map to unit circle

        // parametric function
        x = a * sin(t); 
        y = a * sin(t) * cos(t) * r;

        vertex(x, y);
    }
    endShape(CLOSE);
}

function mousePressed() {
	clickCount++;
}

I struggled a lot with this project in particular, because I forgot a lot of the algebra related. I found it really difficult to implement any curve at all, and I originally wanted to use a more complicated curve. However, I enjoy the simplicity of this curve and how complex it can become when layered on top of each other. This reminds me of tangled strings, especially the more you click and zoom in! The greyscale flickering happened on accident, but I really liked it so I kept it, moving away from the filled hour-glass shapes I had originally.

Playing around with fill; I like how this one looks like a round square!

A starting position; curve with width 0

Looks like string!

Zooming out from the previous screenshot

Interesting patterns form when they overlap at certain zoom levels

Romi Jin – Looking Outwards 06

Gifpop is the art of transforming a gif into a one, printable image (i.e. a postcard). Gifpop utilizes a process called lenticular printing, which is a technology that uses lenticular lenses to create an illusion of depth through images, or to create the ability to see different images from different angles (aka a “moving” image). The company takes up to ten frames and merges them to create a single image on a card (slower gifs with fewer frames will have better resolution).


(Examples of gifpop cards.)

This process (including lenticular printing) has a lot of potential to grow into something even larger, and I was intrigued to learn what lenticular printing is and how it can be applied.